CCAI Platform WFM forecasting is a critical component of workforce management. It involves configuring forecast queue groups, creating open interval forecasts, and configuring weekly and monthly patterns.
The first step in forecasting is to set up forecast queue groups, which are lists of campaigns with identical communication channels. See Configure queue groups.
After configuring forecast queue groups in CCAI Platform WFM, the next step is to create an open interval forecast, which is the most basic type of forecasting CCAI Platform WFM. They are calculated based on a weighted average of the number of calls and the average handle time for a specific time period, usually an hour or half-hour. Open interval forecasts are typically used for short-term forecasting, as they provide a real-time view of call volumes and handle times. This type of forecasting is particularly useful for call centers that experience high variability in call volume throughout the day or week. See Open interval forecasts .
After configuring open interval forecasts, the next step is to create weekly patterns and then combine them into monthly patterns. Monthly patterns provide a consistent and effective strategy for the month ahead. See Weekly pattern and Monthly pattern forecasts.
Types of forecasting
CCAI Platform WFM enables forecasters to run multiple types of forecasts at Run forecast, including the standard forecast, compiled forecast, and production forecast.
The following will outline the first type of forecast, the Standard forecast.
The compiled forecast combines multiple standard forecasts, and can be configured on the Compiled forecast tab.
The Production forecast allows for the merging of multiple forecasted data into one forecast. This might be useful if, for example, you have configured individual compiled forecasts for different teams and now you'd like to get a forecast for the entire company.
Configure queue groups
In CCAI Platform WFM, forecasting begins with the configuration of forecast queue groups. A forecast group is a list of queues with an identical communication channel—for example voice, email, or SMS. By uniting multiple queues in a group, you can conveniently calculate forecasts and create weekly and monthly patterns for those queues.
Create queue groups
Queue group management can be done at the Forecasting tab and then Queue groups.
To create a new queue group, click Add.
In the displayed window, specify the parameters of the forecast queue group.
Name: (Required) The name of the new forecast queue group.
Description: The description of the new forecast queue group.
Communication channel: (Required) The communication channel for this forecast queue group. When selecting campaigns later on, you will only see campaigns with this communication channel.
Queues: (Required) The list of campaigns associated with this forecast queue group.
Click Save.
Modify queue groups
To modify a forecast queue group, follow these steps:
Find the queue group to modify.
In the Actions column, click Edit.
Update the modifiable parameters of the forecast queue group.
Click Save.

Delete a queue group
To delete a forecast queue group, follow these steps:
Find the queue group to be deleted.
In the Actions column: click Delete.
Open interval forecasts
After configuring forecast queue groups in WFM, the next step is to create an open interval forecast, which is the most basic type of forecast. The open interval forecast is calculated based on a weighted average of the number of calls and average handle time for a specific time period, typically an hour or half-hour.
Calculate open interval forecasts
Management of open interval occurs on a separate tab, under Forecasting. To create a new open interval forecast follow these steps:
Click Add.
A four-step wizard appears where you can start configuring the forecast.
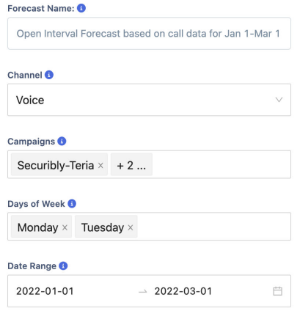
Provide the general information for the forecast.
Name: (Required) The unique name of the forecast.
Channel: (Required) The communication channel by which all campaigns and forecast queue groups in the next parameter are filtered.
Queues: (Required) The list of campaigns and forecast queue groups with the selected communication channel.
Days of the week: (Required) Only selected days of the week will be displayed.
Date: (Required) Date range of the call data, which the forecast calculated is based on.
After the generation information about the forecast is specified, click Next.
Select the target dates for the open interval forecast. Each column contains every instance of the weekday from the specified date range.
For example, if in the general information you selected Monday and Tuesday and a date range of Jan 1 – Mar 1, here you'll see all Mondays and Tuesdays between January 1 and March 1.
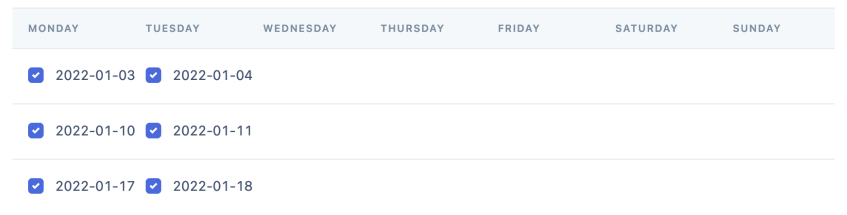
You might choose to remove certain outlier dates from the calculation process. If a date is deselected, you won't see it at the next step.
Click Next.
The interval forecast is calculated based on two source data modes which are outlined in the next sections:
Source data is call count.
Source data is average handle time (AHT).
After the forecast is calculated, you can save the forecast.
Click Save.
Each forecast must have a unique name.
There's also a checkbox that provides the ability to set this particular forecast as the default pattern in weekly patterns. If this checkbox is selected, the following two operations occur:
The new forecast is saved.
The default forecast is overwritten with the new forecast's values.
Call count mode
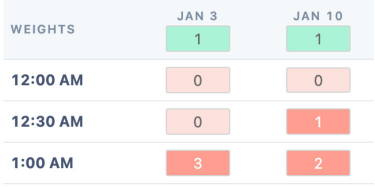
In this mode the table displays the call count for every 15/30/60-minute interval between 12:00 AM and 12:00 PM within the specified date range. Every day is a separate column. The duration of the interval (either 15, 30, or 60 minutes) is returned from the API:
If all campaigns have the same period, then that period is used.
If all campaigns don't have the same period, the default period from the client's group settings is used.
The forecast uses call data only from the campaigns selected on the first step.
The table displays the number of calls made during the corresponding 15/30/60-minute period. This data is fetched automatically from the CRM.
If you find an outlier date and you don't want it to negatively affect the entire forecast, change its value . Changed values have a darker background color compared to the actual call count.
Next, review the algorithm for calculating the open interval forecast by following these steps:
Calculate the weighted sum of each day for the 30-minute interval. To do that, take the call count for each day, multiply it by its weight, and then add those numbers.
For example,
15\*1 + 51\*1 + 44\*1 + 53\*1 = 163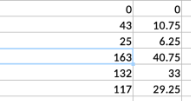
The weight is a value specified in the light green text field under each date. It can be in the range between 1.0 and 4.99. The default is 1.0.
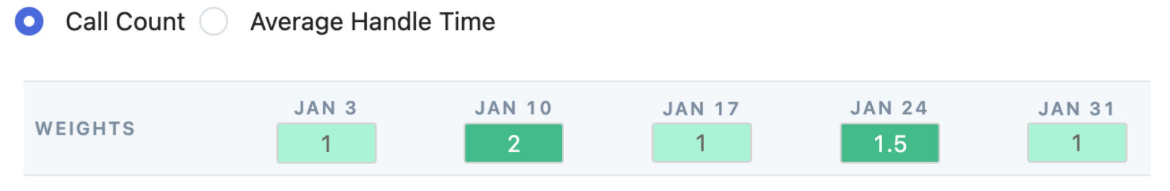
Divide the sum by the weight sum. To do that, take the sum from the previous step (163), and divide it by the sum of each date's weight
For example,
(1 + 1 + 1 + 1 = 4). 163 / 4 = 40.75Add the number from the Adjustment column. To do that, take the value from the previous step (40.75) and add to it the value from the Adjustment column.
For example,
40.75 + 0 = 40.75 (J21)In the portal, the adjustment numbers are specified in the Adjustment column with yellow text fields:
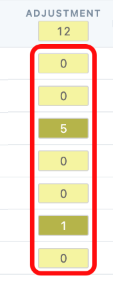
Under the Adjustment rows there is a Reset button, which resets all rows to 0.
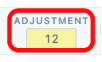
Multiply the value from the previous step by the adjustment percentage. To do that, take the value from the previous step (40.75) and add to it the percentage from the adjustment column.
For example, (12%). 40.75 * 1.12 = 45.64
In the portal, the adjustment percentage is specified in the header of the Adjustment column:
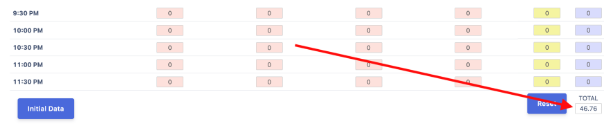
The resulting value is the forecast for the given 30-minute interval. At the bottom of the Forecast column there's another displayed value – aggregate forecast – which is the sum of all forecasts in the column.
Average handle time mode
In this mode the table displays the total duration of calls in seconds for every interval between 12:00 AM and 12:00 PM within the specified date range. Everyday is a separate column. Additionally, when the source data is average handle time, there are three different forecasting options, which are outlined in the following sections.

Option 1: Forecast
The values in the Forecast option rows are calculated in the same way they are calculated in the Call Count mode.
The value at the bottom – Total – is calculated according to the following formula.

Formula
For every period, take the forecast from the call data table (cells G3:G50), and multiply it by its corresponding value in the Call Data Forecast rows (cells V3:V50). Add these products together. Then divide the result by the Total Forecast from the call count mode (cell G51).
For example, =SUMPRODUCT(G3:G50,V3:V50)/G51
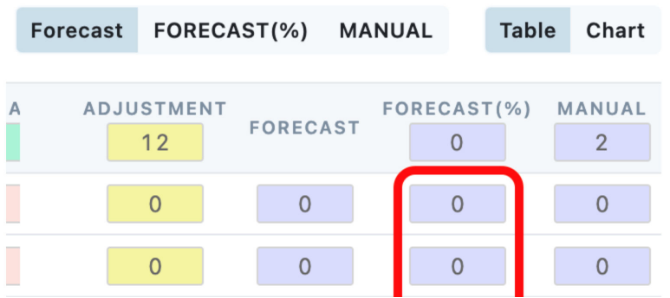
Option 2. Forecast (%)
In the Forecast (%) mode, the forecast is calculated according to the following calculation steps:
Calculate the call count sum for all periods of each day.
For example:
- B column (Nov 1): 488 calls
- C column (Nov 8): 642 calls
- D column (Nov 15): 529 calls
- E column (Nov 22): 526 calls
For every day, for every period, multiply the call count (B3:B50) by the average handle time (Q3: Q50), and add those numbers up (Q51:T51).
For every value from step 2 (Q51:T51), divide by the corresponding value from step 1.
For example,
Q51 / B53 = 249504 / 488 = 511.2 (Q53)For every value from step 3 (Q53:T53), multiply by the corresponding weight (Q1:T1), and then add those numbers up (Q55).
Divide the sum from step 4 by the sum of all weights:
For example,
Q55 / Z1 = 2206 / 4 = 551This value is the default percentage value in the header of the Forecast (%) column:
For every day, for every interval, take the forecasted value from the Forecast AHT column (Q3:Q50), and calculate the percentage difference between the forecasted value and the value from step 3. For example, suppose we have one interval with the AHT of 612 minutes (Q21). The value from step 3 is 511 (Q53). 612 is greater than 511 by 19.7%.
Calculate the average percentage for each day. It is calculated according to this formula: take the calculated percentage from step 6 for each day, multiply it by the day's weight, and then add those products together. Then divide this sum by the total weight (Z1) and put it in the AH column (AH3:AH50).
Add or subtract the percentage from step 7 from the value in the Forecast (%) column header (W1) and put it in the W3:W50 column. This is the value in the Forecast (%) rows:
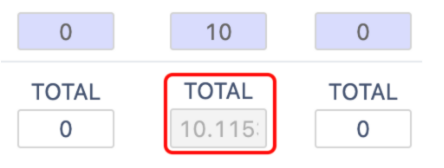
The value at the bottom – Total – is calculated according to the following formula:
For every period, take the forecast from the call data table (cells G3:G50), and multiply it by its corresponding value in the Forecast % rows (cells W3:W50). Add these products together. Then divide the result by the Forecast from the call count mode (G51):
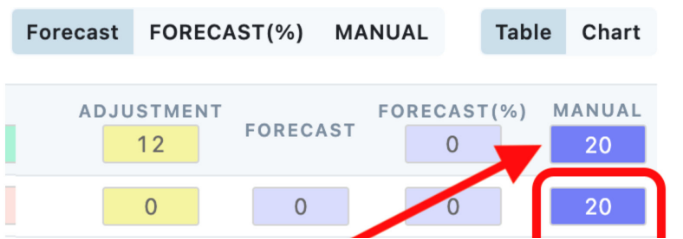
Option 3. Manual mode
In this mode, you enter a value and then this value is replicated in all of the rows. By default, it has a default value: if all campaigns used in this forecast have the same AHT, we use it as the default value; if the value differs in some campaigns, we use the company's default AHT.
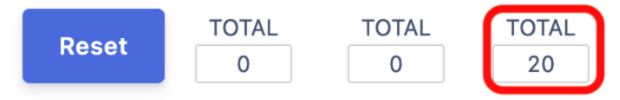
At the bottom of the Manual column there is value called Total. Here's the formula for its calculation:
For every period, take the forecast from the call data table (cells G3:G50), and multiply it by its corresponding AHT (cells X3:X50). Add these products together. Then divide the result by the from the call count mode (G51):
Resetting the call count and average handle time data
If you need to reset the call count and average handle time data, click the Initial data button.
All values in the table will be reverted back to their original values.
Default open interval forecast
When CCAI Platform WFM is enabled, the default open interval forecast is automatically inserted into the database.
The default forecast contains the following data:
| Parameter | Value | Description |
|---|---|---|
| Name | DEFAULT | The name of the default forecast. |
| Communication channel | Voice | The default forecast's communication channel |
| Period | 60 minutes | The duration of each forecasted time interval. Each day will have 24 60-minute periods. |
| Call counts | 24 units of 1 | Number of calls for each 60-minute period. |
| Call AHTs | 24 units of 100 seconds | Average handle time for each 60-minute period. |
| Selected AHT | Forecast | Selected AHT mode in the table mode. |
After the open interval forecasts are configured, you can configure the weekly patterns.
Weekly patterns
After an open interval forecast is created, the next step is to create a weekly (and subsequently a monthly) pattern. Weekly patterns combine open interval forecasts for each day of the week for both voice and non-voice communication channels.
Create weekly patterns
To create a weekly pattern, follow these steps:
In the portal click Add in the top-right corner.
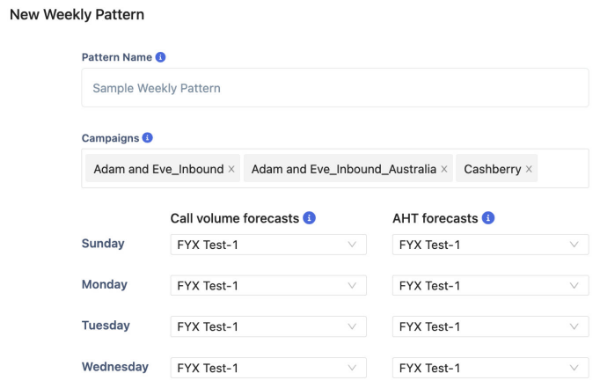
In the menu that displays, specify the following values:
Name: The unique name of the weekly pattern.
WFM Queues: The list of campaigns in CCAI Platform WFM that this weekly pattern will be attached to.
Active: Indicates if this weekly pattern can be used during forecast configuration.
Call volume forecasts: For each day of the week, you must select an open interval forecast from which call volume data will be used.
AHT forecasts: For each day of the week, you must select an open interval forecast from which average handle time data will be used.
Special: Indicates if the pattern is special. For example, a seasonal holidays week pattern.
View weekly patterns
Weekly patterns are listed on the Weekly patterns tab. The following table shows the list of all previously created weekly patterns and some of their corresponding values:
Name: The name of the weekly pattern.
Active: Indicates whether the pattern is active.
Created by: The person who created the pattern.
Special: Indicates if the pattern is special; for example, a Christmas week pattern.
Default pattern
When CCAI Platform WFM is enabled, to ensure the stability of the system and prevent technical issues, we automatically insert the default weekly pattern into the database with the following values:
| Parameter | Value |
|---|---|
| Name | DEFAULT |
| Special | False |
| Active | True |
| Queues | All existing campaigns |
| Monday Volume | From the DEFAULT open interval forecast. |
| Monday AHT | From the DEFAULT open interval forecast. |
| Tuesday Volume | From the DEFAULT open interval forecast. |
| Tuesday AHT | From the DEFAULT open interval forecast. |
| Wednesday Volume | From the DEFAULT open interval forecast. |
| Wednesday AHT | From the DEFAULT open interval forecast. |
| Thursday Volume | From the DEFAULT open interval forecast. |
| Thursday AHT | From the DEFAULT open interval forecast. |
| Friday Volume | From the DEFAULT open interval forecast. |
| Friday AHT | From the DEFAULT open interval forecast. |
| Saturday Volume | From the DEFAULT open interval forecast. |
| Saturday AHT | From the DEFAULT open interval forecast. |
| Sunday Volume | From the DEFAULT open interval forecast. |
| Sunday AHT | From the DEFAULT open interval forecast. |
When you're done configuring weekly patterns, you can create monthly patterns.
Monthly patterns
After weekly patterns are created, the next step is to combine those weekly patterns into monthly patterns, which are displayed on the Monthly patterns tab.
Monthly pattern setup
By following these steps, you can set up a monthly pattern for your communication channel and forecast queue group, ensuring that you have a consistent and effective strategy in place for the month ahead.
To set up a monthly pattern, follow these steps:
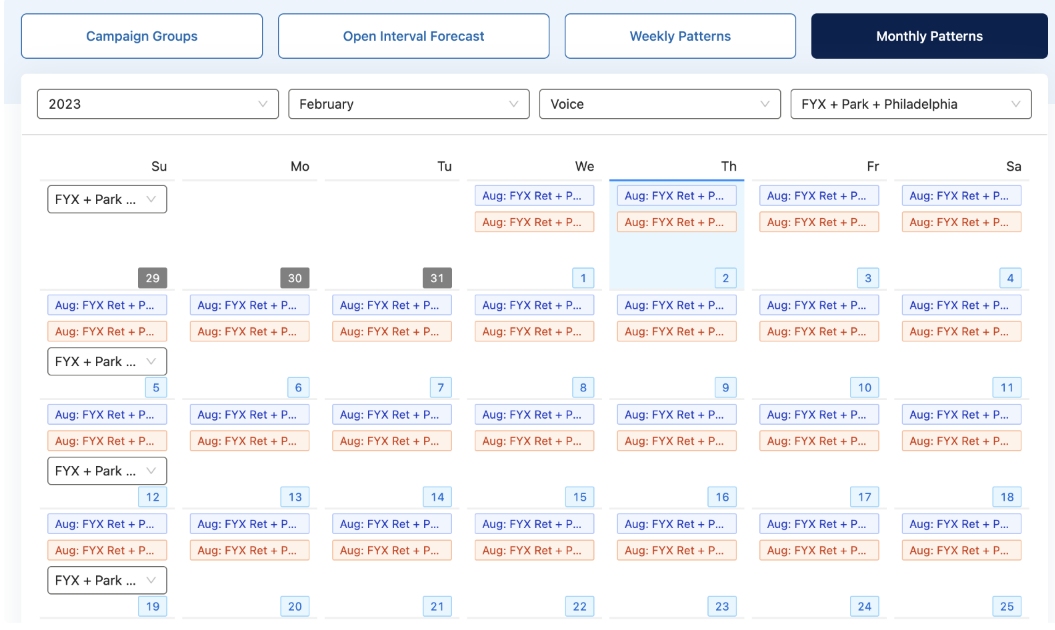
Select the target Month in the toolbar at the top.
Select the target communication Channel from the drop-down list.
Select the target Queue Group from the drop-down list. This list only displays forecast queue groups with the selected communication channel.
Assign a weekly pattern for each week of the month. The first day of the week features a drop-down menu where you can select a weekly pattern for this week. The list of weekly patterns contains only those patterns to which you have previously assigned campaigns from the selected forecast queue group.
Click Save.
Standard forecast
After you have finished serting up forecasting, the next step is to calculate the actual forecast that will serve as the basis for eventual schedule calculation.
The following information outlines the first type of forecast,—the Standard forecast—and its underlying algorithm. To generate a standard forecast follow these steps:
In the WFM portal, go to the Forecasting tab.
Select Run forecast.
Go to the Standard forecast tab.
Click Add in the menu that appears.
Enter the forecast's details:
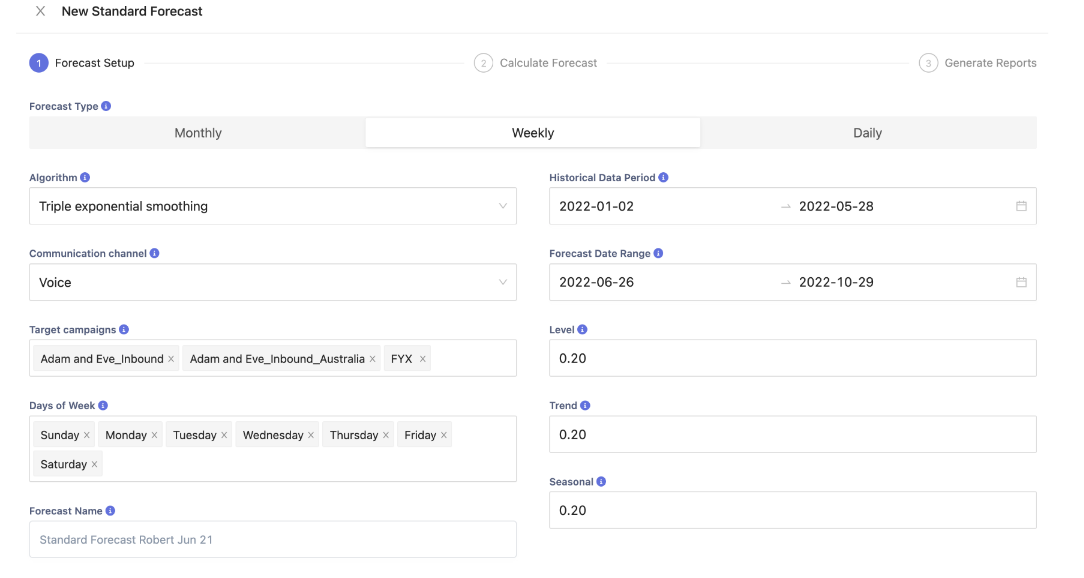
Forecast type: Determines the time span between two data points on the chart from the second step. For example, if you select weekly, the chart displays data for every week in the forecasted date range.
Algorithm: The algorithm used for calculating the forecast. Possible values include:
Double exponential smoothing.
Triple exponential smoothing.
Weighted forecast.
Communication channel: The selected communication channel ensures that only forecast queue groups with this channel are displayed in the next drop-down.
Target queues: Target campaigns for this forecast. This list of campaigns and forecast queue groups should be filtered by the communication channel selected in the other filter. If the selected campaigns have a different service level, a warning message displays.
Day of week: Indicates which days of the week are used in calculating the forecast.
*Forecast name: Name of the forecast as displayed in the table.
Historical data period: Date range for the historical call data that will serve as the basis for forecast calculation.
Forecasted date range: The date range for which the forecast is calculated.
Depending on the forecast type and algorithm, certain additional settings might apply:
Excluded date range: (Only for the double and triple exponential smoothing algorithms). If there's an outlier time period within the historical date range, you can exclude it from the calculation.
Weeks in cycle: (Only for the weighted forecast algorithm). Combines the specified number of weeks into a pattern that can be viewed on the chart from the second step.
Seasonal: (Only for the triple exponential smoothing algorithms). Must be in the range between 0 and 1.0. The default is 0.2.
Level: (Only for the double and triple exponential smoothing algorithms). Must be in the range between 0 and 1.0. The default is 0.2.
Trend (Only for the double and triple Exponential Smoothing algorithms). Must be in the range between 0 and 1.0. The default is 0.2.
If the forecast algorithm is Weighted forecast, there is one additional step to select the pattern.
On the earlier step, you specified the number of weeks in a cycle, which combines these weeks into a pattern.
For example, if you set this parameter to 2, on the pattern selection step each week will by default have alternately one of the two patterns. You can also manually change the pattern for each week or even remove it from the calculation altogether.
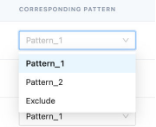
During configuration of the open interval forecasts, some forecasts were marked as special. These special patterns can also be selected instead of the auto-generated ones.

Some days from the historical period might have zero calls, calls with zero average handle time, or both. As a result, these days might negatively impact the resulting forecast. To resolve this we use the zero days smoothing. It is possible to manually change the call count and average handle time for each of those days on the step following pattern selection.
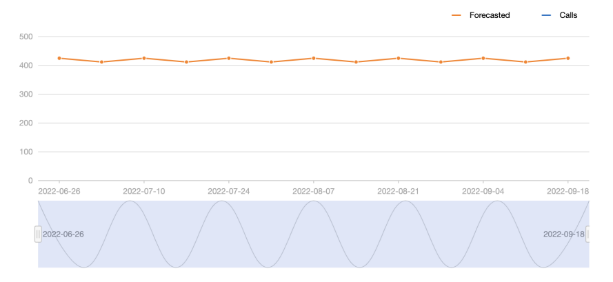
After the forecast is set up, you need to calculate the forecast. A calculation is performed and displays the results in a line chart.
The chart consists of two lines:
Orange: Displays the forecasted call count.
Blue: Displays the actual call count during the specified historical period.
The final step in calculating a standard forecast is to generate the following three reports:
By week multi-Q report.
Agent population report
Total finance report
Compiled forecast
The compiled forecast in CCAI Platform WFM combines multiple standard forecasts. To create a new compiled forecast, follow these steps:
In the WFM portal navigate to the Compiled forecast tab.
Select Run forecast.
Click + Add in the top-right corner of the table.
In the pane that appears, you can start configuring the details of the new forecast.
Specify the filters for the subsequent selection of standard forecasts:
Forecast type: Selects standard forecasts only of this type.
Communication channel: Selects standard forecasts only with this communication channel.
Forecast date range: Selects standard forecasts that overlap with this date range.
Select the target standard forecasts that have already been filtered based on the criteria defined on the first step:
- You can only select standard forecasts with identical service level settings.
You can view the results of the forecast for the specified period; that is, the forecasted call count and average handle time for every day in the specified period. To calculate the forecasted contact count, the system adds up contact counts from all standard forecasts.
For example,
414 + 387 = 801To calculate the forecasted contact count and average handle time, the system uses the following algorithm:
Take the contact count for each forecast, multiply it by the corresponding average handle time, and then add those products together.
For example,
414\*723 + 387 \* 219 = 384075Divide the number from the first step by the forecasted contact count:
384075 / 801 = 479
Three reports are generated, which include:
By Day Multi-Q Report
The by day multi-q report is an essential report for managers and planners, as it helps them to efficiently manage their resources and plan their staffing and scheduling to meet the forecasted contact volume.
It provides valuable insights on your contact count, average handle time, agent count, hours, and labor cost for each day. The report is broken down into the following columns:
Date: The date for which the forecasted values are provided.
Contact count: The estimated number of contacts for the given date.
AHT: (Forecasted) The average amount of time agents will spend on a contact.
Agent count: The estimated number of agents required to handle the predicted contact volume.
Hours: The expected total number of hours that agents will need to work to meet the predicted contact volume, assuming an 8-hour shift for all agents.
Cost: The estimated labor cost, based on the forecasted hours and the specified wage rate.
By Week Multi-Q Report
The by week multi-Q report contains the same columns as the by day multi-Q report, but the rows are grouped by week rather than by day. That is, instead of showing the forecasted data for each individual day weekly, the report displays the forecast for the specified date range. For example, the report might show the forecasted data for the weeks, starting on June 26, July 3, July 10, July 17, and July 24.
This format can be useful for managers who are interested in high-level trends over time rather than daily fluctuations. It can help them to make informed decisions about staffing and resource allocation for each week, based on predicted contact volume, average handle time, agent count, hours, and labor cost.
By month multi-Q report.
This report contains the following columns:
Date: The first day of the month.
Contact count: The forecasted contact count for the month.
AHT: The forecasted average handle time for the month.
Required average FTE: The required average number of full-time agents for the period.
Required max FTE: The maximum number of full-time agents required during the month.
Monthly hours: The forecasted total number of hours that agents will work during the month assuming an 8-hour shift for all agents.
Monthly cost: The forecasted labor cost for the month given the forecasted hours and the specified wage rate.
After you're done configuring the forecast, click Save.
You will now be prompted to provide a name for the forecast. Enter the name for the forecast, and click Save.
After you create a forecast, you can create the following:
A production forecast using several compiled forecasts.
A day planner based on this compiled forecast and start the scheduling process.
Production forecast
CCAI Platform WFM enables forecasters to combine several compiled forecasts into a single production forecast. It lets you merge multiple forecasted data into one production forecast
This might be useful if, for example, you have configured individual compiled forecasts for different teams and now you want to get a forecast for the entire company.
To create a production forecast, follow these steps:
In the WFM portal, select the Run forecast tab.
Select the Production forecast tab.
To add a new forecast, click Add.
On the first step of the production forecast setup, specify the following values:
Forecast type: Selects compiled forecasts only of this type.
Communication channel: Selects compiled forecasts only with this communication channel.
Forecast Date Range: Selects compiled forecasts that overlap with this date range.
Select eligible compiled forecasts based on the filters configured in the previous step.
View the results of the newly calculated production forecast.
You can examine the forecasted contact count and the forecasted average handle time for the target date range.

Both data sets can also be displayed in the chart mode.
Click Save. At this point you can use this newly created production forecast to create day planners.
Multi-skill forecasts
Multi-skill forecasts let you integration forecasts from various communication channels into one overall forecast. This can be useful for creating a comprehensive company forecast for teams using different modes of communication such as voice, email, and chat.
To create the multi-skill forecast, follow these steps:
In the WFM portal, click the Run forecast tab.
Click the multi-skill sub-tab.
To create a new forecast, click Add.
In the pane that displays, fill out the forecasting details.
First, select eligible daily forecasts of required type and communication channel:
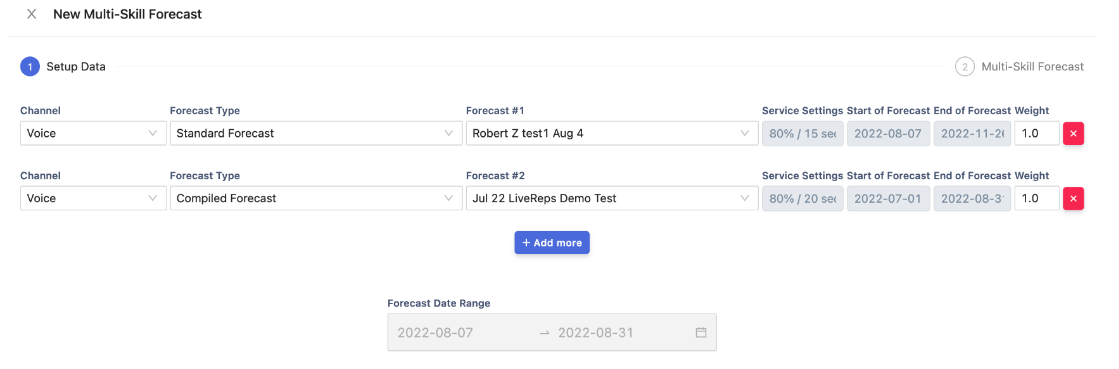
Channel: Filters forecast by this communication channel.
Forecast type: Filters forecast by this type. Note that the list contains only daily forecasts.
Service settings: Service level and service level time.
Start of forecast: Indicates the start date of the selected forecast.
End of forecast: Indicates the end date of the selected forecast.
Weight: Weight affects the prominence of a forecast relative to other forecasts. Must be in the range between 0.1 and 10.
Forecast date range: Intersection of all selected forecast date ranges. After you have selected the target forecasts, click Next.
Next, examine the results of the forecast.
This step contains two tabs: Multi-skill Forecast and Intermediate Data
This displays the actual forecast.
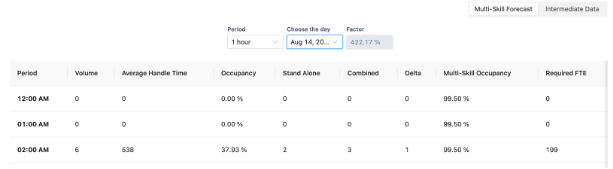
The following is a description of each column:
Volume: The forecasted aggregate volume, based on selected forecasts.
Average Handle Time: The forecasted average handle time for the period.
Occupancy: The forecasted occupancy, assuming that each agent works in only one communication channel.
Standalone: The forecasted headcount, assuming that each agent works in only one communication channel.
Combined: The forecasted required number of agents, assuming that each agent works in only one communication channel.
Delta: The forecasted reduction of headcount in case each agent works in multiple communication channels (Standalone less Combined).
Multi-Skill Occupancy: The forecasted occupancy, assuming that each agent works in multiple communication channels.
Required FTE: The forecasted headcount of multi-skill agents, adjusted for the factor.
Intermediate data
To provide supplementary information and display the intermediate calculations which are used for the formation of the multi-skill forecast, follow these steps:
In the WFM portal go to the Intermediate data tab.
The following is a description of each column:
Volume: The forecasted volume for the period.
Average handle time: The forecasted average handle time for the period.
Required: The forecasted number of agents for the period.
Occupancy: The forecasted agent occupancy for the period.
Really need: The forecasted number of agents, assuming 100% occupancy.
Left alone:: The difference between the forecasted number of agents with the target occupancy and 100% occupancy (rounded).
Enter the name of the forecast.
Click Save. You can now use this multi-skill forecast to create a day planner.