Landing page metrics
Total:
- Cases: Shows number of calls and chats based on the drop-down filter.
- Agent in call/chat: Total number of agents currently logged in.
Filter dropdown menu: Select a time range for the data displayed.
Call: Total number of calls within the selected time frame. Clicking this tile takes you to the Call Dashboard.
Chat: Total number of chats within the selected time frame. Clicking this tile takes you to the Chat Dashboard.
Call dashboard
For the Agents Logged In tile, agent information will not appear until the following:
- Agents have to have taken a call or chat to show up in the dashboard as logged in agent
- Agents have to be assigned the default Agent role even if the Custom role they have assigned contains Agent permissions.
Overview
The Call dashboard shows both real-time and aggregated data related to your contact center calls. This dashboard is controlled by a group of filters: Queue Group, Queue, Team, and Date. You can also click on certain tiles to see filtered views of the Connected, Queued, or Completed calls pages, as well as the Agent Monitoring page. Shows data from calls coming in from IVR, Mobile SDK, and Web SDK.
Data refresh rate
The data in the Call dashboard refreshes every 20 seconds.
View the call dashboard
Go to Dashboard > Call.
Call dashboard metrics
Calls:
Includes only inbound call interactions, including scheduled and overcapacity callback calls.
Includes all channels (for example, IVR, In-App, In-Web).
Excludes short-abandoned calls based on settings in Operation Management.
Excludes in-menu abandoned calls.
Call volume chart: Call interaction volume patterns over time in 15-minute increments.
Filters:
Queue Group: Filter by Queue Group.
Queue:
Language: If you have multiple languages configured, select the language first, then the queue.
Queue: For Top-level queues, you can drill down and click Apply next to a sub-queue or leaf-queue.
Team: Filter by user teams. Teams are configured in Settings > Users & Teams.
When a top-level team is selected:
If the Top-level team is not assigned to a queue, the dashboard will show data aggregated for all of the queues and agents the sub-teams are assigned to.
If a top-level team is assigned to a queue, the dashboard will show data aggregated for the queues that the top-level team is assigned to AND all of the queues the sub-teams are assigned to.
When a sub-team is selected, the dashboard will show data aggregated for the queues that the team is assigned to.
Date: Filter by time range. The dashboard shows aggregate data with respect to your computer's time zone. The Date filter does not impact Live metrics (marked with an asterisk, below.) Limited to 90 days of data.
Service Level: Monitors percentage of calls answered in x amount of seconds. Default and queue level metrics are set in Operations management.
When viewing the default view of the dashboard, the globally configured SLA target is displayed.
When viewing multiple queues (or a queue group), no target will be displayed when per-queue metrics are set with Queue Level Target Metrics.
Logged in Agent (LIVE)*: Number of agents logged in broken down by status. Click on the chart to see the Agents in each status.
Agents information will not appear until the following:
Agents have to have taken a call or chat to show up in the dashboard as logged in agent
Agents have to be assigned the default Agent role even if the custom role they have assigned contains Agent permissions.
Live Call (LIVE)*: # of calls: ongoing, queued, or in-IVR menu.
Longest Call Waiting (LIVE)*: Longest ongoing wait time for a call. Calculated with only current queued or ongoing calls and does not include finished calls.
% Transfers: Percentage of calls that have been transferred. Click on the metrics to see drill-down info.
Volume per Hour: Average volume of call interactions per hour.
Calls Handled: Number of finished call interactions. Click on the metrics to see drill-down info.
Average Handle Time: Average length of interactions [handle time] + [hold time]. Click on the metrics to see drill-down info.
Queue: Most CIQ (LIVE)*: Queues with highest number of calls waiting to be assigned to an Agent.
Avg Queue Duration: Average duration a consumer spends waiting for an Agent.
Queues: Longest EWT: Queues with longest estimated wait time.
Queues: Highest Traffic: Queues with highest number of interactions in the given time frame, including abandoned and failed calls.
Repeat Contacts: Number of callers who had multiple incoming sessions that finished in the same queue within the configured repeat contact timeframe set in Settings > Operation Management > Target Metrics. Click on the metrics to see more drill-down info.
CSAT: Average CSAT collected after call sessions.
Status Ratio: Finished calls broken down by call status broken down by(finished, abandoned, etc).
Voicemail Waiting: Number of unmanaged voicemails. Only voicemails listened via the Agent Adapter will be marked as read and not counted in this metric.
- Click Clear voicemails to set this metric to 0.
Voicemail Status: Number of voicemails received broken down by status.
Received: Number of voicemails received within the filtered time range.
Read: Voicemails an Agent has listened to via the Agent Adapter.
Waiting: voicemails received in the last week that have not be listened to via the Agent Adapter.
Report data versus dashboard data
With so many data points at your fingertips, there is a lot to take in! Below are some guidelines when comparing data across the Contact Center AI Platform (CCAI Platform) real-time and historical reporting features.
Reports and dashboards exclude calls abandoned during menu selection.
Report data excludes voicemails whereas the call dashboard data includes voicemails.
Historical report data generally includes short-abandoned calls, whereas the dashboard may not include this data based on settings in Settings> Operation Management.
Exception for short-abandoned call data if you download a historical report with aggregates of SLA, the short-abandons will not be included in the calculations; however, if you download a raw report of interactions, it will be there.
Chat dashboard
Overview
The chat dashboard shows both real-time and aggregated data. The dashboard can be filtered for various configurations, and you can drill into data by clicking to see filtered pages of Connected, Queued, or Completed chats, or the Agent Monitoring page.
Data refresh rate
The data refreshes at varying rates:
Every 20 seconds: Live data
Every 60 seconds: Service Level data
Every 5 Minutes: Daily aggregated data
Filters
Queue Group: Filter by Queue Group.
Queue
Language: If you have multiple languages configured, select the language first, then the queue.
Queue: For Top-level queues, you can drill down and click Apply next to a sub-queue or leaf-queue.
Team: Filter by user teams.
When a top-level team is selected:
If the Top-level team is not assigned to a queue, the dashboard will show data aggregated for all of the queues and agents the sub-teams are assigned to.
If a top-level team is assigned to a queue, the dashboard will show data aggregated for the queues that the top-level team is assigned to AND all of the queues the sub-teams are assigned to.
Date: Filter by time range. The dashboard shows aggregate data with respect to your computer's time zone. The Date filter does not impact Live metrics (marked with an asterisk, below).
Social: enables you to filter and view the social messaging chat session metrics. For now only WhatsApp will display. This filter will only appear if WhatsApp has been enabled.
Metrics
Chats: total number of chat interactions.
Chat volume chart: Chat interaction volume patterns over time in 15 minute increments.
Service Level: Monitors percentage of chats answered in x amount of seconds.
Logged in Agent*: Number of agents logged in.
Live Chat*: # of chats: connected, queued, or in-menu.
Longest Chat Waiting: Longest ongoing wait time for a chat in queue.
% Transfers: Percentage of chats that have been transferred.
Volume per Hour: Average volume of chat interactions per hour.
Chats Handled: Number of finished chat interactions.
Average Handle Time: Average length of the interaction [handle time] + [hold time].
Queue: Most CIQ: Queues with the highest number of chats waiting to be assigned to an Agent.
Avg Queue Duration (LIVE): Of the chats currently in queues, shows the average duration a consumer is spending waiting to be assigned to an Agent.
Queues: Longest EWT: Queues with longest estimated wait time.
Queues: Highest Traffic: Queues with the highest number of chats in the given time frame. Includes failed and abandoned chats.
Agent Response Avg: Average time for an agent to respond to an end user's message.
Chats per Agent: Average number of concurrent chat interactions per agent.
Status Ratio: Chat Status (finished, abandoned, and so on).
Repeat Contacts: # of callers who had multiple incoming sessions that finished in the same. queue within the configured repeat contact timeframe set in Settings> Operation Management.
CSAT: Average CSAT from chat interactions handled by Human Agents.
Social: display the total count of all Social Messaging chat sessions for the time period selected from the Time filter. Note: For now only WhatsApp will display. This tile will only appear if WhatsApp has been enabled.
Voice virtual agent dashboard
Overview
The dashboard displays metrics such as sentiment ratings, resolution rates, CSAT, and other performance data for virtual agents. Dashboard filters include Agent, Queue, and Timeframe.
If you have enabled the Voice Virtual Agent feature you can access this dashboard. To view the dashboard go to Dashboards > Virtual Agents > Calls.
Filters
Filters (Agent, Queue, Timeframe) are available at the top of the dashboard.
Metrics
This table describes each metric available in the Voice Virtual Agent Dashboard
Metric |
Description |
Total Sessions |
The number of VA call sessions. |
Total Volume per Hour |
The number of VA call sessions divided by the number of hours between provided from/to timestamps |
Consumer Initiated Sessions |
The number of VA call sessions started by the consumer directly (for example, not the Agent). |
Transferred by Live Agent Sessions |
The number of VA call sessions started by a transfer from a Live Agent call session by the Agent. |
Total Responses |
The number of VA responses across all call sessions. |
Resolved by Virtual agent |
The number of VA call sessions that the VA resolved. Usually a resolved call is one where the VA resolves the issue from the customer and gets some acknowledgement in the call that it has done so. |
Planned Transfer |
Indicates when the voice virtual agent transferred the call to a human agent through planned interaction. For example, the virtual agent understood what the consumer was requesting and sent them to the proper queue/agent. This formats as True or False. |
Escalation |
The number of VA call sessions that the VA escalated to an agent by explicit consumer intervention (either through clicking the escalate button or saying in a virtual agent call that they would like to talk to a human). |
Abandoned* (VA) |
The number of VA call sessions where the end user left before VA could resolve the call or escalate to a live agent. |
Average Handle Time |
The average time that a VA call session lasts. |
Average Abandon time* (VA) |
The average time that an abandoned VA call session lasts. |
Average Session Responses |
The average number of VA responses in a given VA session |
Rate of Misunderstanding |
The average number of fallback responses a VA makes in a given call session. A fallback response is a response that is given from the VA when it doesn't have a rule for what to say next with a given customer response. |
Sessions over time |
Time series data that plots the number of sessions over time within the given time range the query is operating in |
Rate of Misunderstanding over time |
Time series data that plots the rate of misunderstanding over time within the given time range. |
Rate of Misunderstanding by Virtual Agent |
A breakdown of Rate of Misunderstanding that computes the rate of misunderstanding for each virtual agent. |
Sentiment Score |
Average Sentiment Score of VA Sessions. Calculation: (Total Sentiment Score of all call sessions / Total no of Virtual Agent messages) |
Performance metrics dashboard
Overview
The Performance Metrics dashboard gives you a high level overview of your support center for both calls and chats. It is split into two primary sections: Global Metrics and SLA Metrics.
Details
Only inbound interactions are represented. Because outbound calls are not associated with a queue, they are not included.
Queue selection must be completed to show in the dashboard
In-menu abandons are not represented
View the dashboard
- Go to Dashboard > Performance Metrics.
Time filters
In the top right corner a filter drop down is available.
Today: the current date based on your locally configured time zone
Last 24 hours
This quarter: Starts at the first day of the current calendar quarter until the current day
Global metrics
The left-hand tile contains call-specific data, while the right-hand tile contains chat data.
| Call Volume | Count of inbound or outbound interactions offered, regardless of whether they were handled by an agent or not (includes abandons, failed contacts, etc) |
| Handled | Count of inbound or outbound interactions touched by an agent (excludes agent <> agent transfers) |
| Transfer % | SUM of finished or failed segments that are a transfer / SUM of all finished or failed segments |
| Inbound | Count of interactions created by a consumer and offered - regardless of whether it was handled by an agent (includes abandons, failed contacts, etc) |
| Outbound | Count of interactions created by an agent or auto-dialing system, regardless of whether the consumer answers the call |
| Calls in Queue | Count of inbound interactionscurrentlywaiting in queue |
| AHT | (average call duration + average wrap-up status associated with a Call ID) |
| Chat Volume | Count of interactions offered, regardless of whether they were handled by an agent or not (includes abandons, failed contacts, etc) |
| Handled | Count of interactions touched by an agent (excludes agent <> agent transfers) |
| Transfer % | Sum of finished or failed interactions that are a transfer / Sum of all finished or failed interactions |
| Chat Concurrency | The average concurrency of all ongoing chats (live metric) |
| Avg Response Time | Average time (seconds) that it takes for an agent to respond to a consumer |
| Chats in Queue | Count of inbound interactionscurrentlywaiting in queue |
| AHT | Average chat duration (no wrap-up status applied) |
SLA metrics
The top of the SLA Metrics shows two charts for Call SLA and Chat SLA respectively. The time range displayed here is representative of the time range selected at the top right of the page. The SLA displayed represents the total SLA across the support center.
Call and chat metrics: SLA bands
This section will help you quickly identify how many sessions are falling below the set SLA threshold. There are three pre-configured thresholds displayed by default:
SLA >= 80
60 > SLA < 80
SLA <= 60
The metrics displayed are defined as follows:
| Queues | See Data Dictionary |
| Total SLA | See Data Dictionary |
| Volume | Total interactions which qualify for SLA calculation. See SLA in Data Dictionary for more details. |
| Handled | Total completed interactions which qualify for SLA calculation. See Data Dictionary. |
| Abandoned | See Data Dictionary |
If you're interested in exploring the data further, click the explore
button
The metrics displayed are defined as follows:
| Queues | See Data Dictionary |
| Total SLA | See Data Dictionary |
| Volume | Interactions which qualify for SLA calculation. See SLA in Data Dictionary for more details |
| Handled | See Data Dictionary |
| Abandoned % | See Data Dictionary |
| Incoming SLA | See Data Dictionary |
| Transfer SLA | See Data Dictionary |
Call and chat average handle time (AHT)
The final section on this dashboard will give you insight into AHT (Average Handle Time) for your highest volume queues. Up to 5 queues show at a time and the volume shows everything including abandoned interactions.
Queue reports dashboard
Overview
The Queue Reports dashboard gives you a detailed, live overview of your Queue Groups and the queues within each group. This dashboard is well suited for monitoring the day to day performance and status of your operation.
View the dashboard
- Go to Dashboard > Queue Reports.
Dashboard details
Only inbound interactions are available in dashboards. Because outbound calls are not associated with a queue, they are not included on this dashboard
Queue selection must be completed to show in the dashboard
In-menu abandons are not represented in Dashboards currently
Views
From the top-left of the Queue Groups Dashboard page, you can toggle between two different views. One view shows metrics at the Queue Group level and the other shows detailed metrics for each queue within the Queue Group.
Queue groups summary (Today)
Displays detailed information on the health of your enabled voice and chat Queue Groups. Each row represents one of your Queue Groups - with exception of the Totals row, which displays an aggregate of all Queue Groups. The columns show metric (totaled or averaged depending on the metric) for all queues in the queue groups. The timeframe is always set to "Today" and all Call and Chat queue groups show on the same page.
Queue group details
The Queue Groups Details shows metrics from one queue group at a time. The queue group is selected from the dropdown in the upper-right view shows each queue as a separate line item and the individual metrics for each queue in the enabled queue groups.
Call, chat, or all display
Toggle between Call,Chat, or All icon to display the specific view options on the dashboard.
This is beneficial for users that would like to display the dashboards in different locations on Wallboards where only Chat or only Calls are applicable.
Click the All, Call , or Chat Icon to launch a new page and display the dashboard of your choice.

Data details
Data is categorized into three sections:
Service Level: Metrics displayed in this section are tied to service level (as set in Settings > Operation Management or the Queue Level Target Metrics.
Live Queue Metrics: Metrics displayed in this section reflect the live, current state of the Queue Group
Live Agent Status: Current count of Agents in a status or status category
- Click on any metric within the Live Agent section to drill down and see additional detail including a list of the agents in the respective status. You can use the filters at the top to adjust which statuses you're viewing.
Today: Metrics displayed in this section are aggregated across the current day. Time zone is typically set by your browser unless otherwise specified by your Admin team.
Time zone
The time zone is displayed at the top right of the dashboard and generally reflects the user's locally configured time zone. The Today section of the dashboard aggregates data for the current date based on the time zone displayed here.
Metric definitions
| Service Level | SL / 30min | Service Level within the past 30min |
| SL / day | Service Level for the current day | |
| SL Target | Service Level Target set for the queue | |
| Live | CIQ | Consumers in Queue |
| LCW / Sec | Longest Call Waiting | |
| AQD / Sec | Average Queue Duration (Waiting for an Agent) | |
| Live | Number of calls currently in progress with an agent | |
| Productive Agents | Number of agents with a productive status | |
| Live Agent Status | Available | Count of all available agents |
| On-hold | (Calls only)Count of agents who have placed a consumer on-hold | |
| Wrap-up | Count of all agents in the wrap-up status | |
| Custom | Count of all agents in custom statuses that are configured as productive | |
| Productive Agents | Count of all agents in a productive status as configured in Settings > Queue Groups | |
| Today | ABN % | Abandon rate |
| Volume | Total offered interactions including failed/abandoned sessions. Excludes in-menu abandoned sessions. | |
| Handled | Total number of completed interactions | |
| ASA / Sec | Average speed to answer | |
| AHT / Sec | Average Handle Time |
Virtual agent chat dashboard
This dashboard provides a range of status, session, and performance insights for Chat sessions attended by the Virtual Agents. The dashboard is controlled by a group of filters: Virtual Agent, Queue, and Time frame.
Dashboard filters and behaviors
Filter the dashboard
The current filter settings show in the Filtered by section.
Go to Dashboard > Virtual Agent.
Select a Time zone: Select the time zone of the dashboard data in the upper right corner dropdown.
Click Filter settings to show the filter options.
Select a Virtual Agent. Leave the default setting to see All Virtual Agents or select an individual Virtual Agent from the dropdown.
Make a queue selection. Leave the default setting for All Queues or select any individual queue. This list includes queues without Virtual Agents active so if no results show, be sure there is an online Virtual Agent assigned to the queue.
Select the time frame.
Click Apply to save your settings.
Data change indicators
Most tiles have a change indicator, marked by an up/down red/green arrow, and a numeric value of the chance percentage. Change is determined based on filter settings, comparing data to the time period before the current filtered data. The direction of the arrow indicates the numerical direction of the change in value, while green indicates a favorable change and red indicates an unfavorable change.
Tile - CSAT
Time frame - 24 hours
The change indicating arrow will point upwards and show green when the CSAT data from the previous 24 hours is lower than the current data. The upward green arrow marks a positive change to the current data when compared to the previous 24 hours.
Sections not impacted by filters
All tiles in the Current Status section are not impacted by the filter settings and show current data.
Dashboard tiles and definitions
Virtual agent sessions
Consumer Initiated: The total chat sessions initiated by the consumers and handled by Virtual Agents
Transferred from Human Agent: The total of chat sessions that are answered by a human agent and then transferred to a Virtual Agent
Total Messages Exchanged: The total number of individual messages exchanged between a Virtual Agent and a consumer during a chat session
Avg. Messages per Session: The average number of messages exchanged between a Virtual Agent and a consumer, per chat session. Calculation: (Total Messages exchanged in all VA chat sessions) / (Total number of Virtual Agent chat sessions)
CSAT: 1 to 5 rating given by the consumer at the end of a session which ended with a Virtual Agent. Chat may have started with a human agent and was transferred or could have been fully attended by a Virtual Agent. Must use the CCAI Platform CSAT feature to see a value here.
Performance
Resolved by Virtual Agent: The total number of chat sessions handled by a Virtual Agent to the end of the relevant programmed discussion points
Planned Transfer: The total number of chat sessions handled by a Virtual Agent that are then transferred to another agent (human) due to configuration/standard operating procedure
Escalated: The total number of chat sessions that are handled by a Virtual Agent but do not reach the end of the relevant programmed discussion points (due to consumer clicking on the "escalation" button, typing an escalation message, or in rare cases, technical failure on the part of the Virtual Agent - such as going offline)
Consumer Ended: The total number of chat sessions that are handled by a Virtual Agent but do not reach the end of the relevant programmed discussion points (due to the consumer leaving the chat)
Avg. Handle Time: Average time (MM:SS) that a Virtual Agent spends on a chat session.
Avg. abandoned time (Avg. Consumer Ended Time): Average time (MM:SS) between the start and end of a chat session, only for chats marked consumer ended.
Users Repeating/Returning: Total number of consumers who returned to interact with the same Virtual Agent within 24 hours of a previous session
"Did not Understand" Rate: The % of Virtual Agent chat messages sent where a Virtual Agent states that they did not understand the consumer
- (No. of default fallback responses / Total no. of VA responses) * 100
Current status
Top queues: Top 5 chat queues in order of the highest to lowest total Virtual Agent sessions
Top Virtual Agents: Top 5 Virtual Agents in order of the highest success rates
Virtual Agent status
Online: Enabled and functioning Virtual Agents
Offline: Enabled but unreachable. See Virtual Agent Platform statuses in Virtual Agent configuration
Inactive: Virtual Agent is turned off
Explorable metrics in real-time call and chat dashboards
Overview
Drill-down on explorable metrics in the Call and Chat Real time Dashboards to obtain additional insight into performance and details about the metric. For example, go to Dashboards > Call and click on Repeat Contacts, and it will bring you to a list of completed calls filtered by Repeated.
When metrics are presented in blue, it means the metric may be drilled into.
Call & chat metrics
Definitions for the metrics below can be found on their respective dashboard page:
Repeat Contacts
Click on the number visible within the tile and the page will load to display the details of the repeat contacts filtered by Repeated.
Handled
Click on the number of handled interactions and the page will load to display all of the interactions that have been handled/completed.
Average Handle Time
Click on the Handle Time metric and the page will load showing all completed interactions included in the Average Handle Time calculation.
% Transfers
Click into the Transfer percentage tile and the page will load displaying all interactions where a transfer took place.
Chats dashboard only
Volume Incoming and Volume Outbound SMS
Click the tile to see the number of SMS inbound and Outbound.
AHT Incoming & AHT Outbound SMS
Click on the tiles for a comprehensive breakdown of how the AHT is made up for both inbound and outgoing SMS.
Call or chat view only
Overview
You can now display a chat only or a voice only view of the Queue Reports dashboard. This is useful if you want to display dashboards in separate areas on company wallboards where only one channel is being supported by agents.
Go to Dashboard > Queue Reports
By default the Dashboard will open and display both Calls and Chats.
Click the Calls or Chats Icon to launch a new page and display the dashboard of your choice.
Toggle between All, Call or Chat icon to display the specific view options on the dashboard.
Agent monitoring page
The Agents page is a live view of all logged-in Agents (users who have the Agent role assigned) in your environment. It can be searched and filtered to provide helpful live views of your agents. Users with access to this page can also perform important actions like viewing Agent's assignment details, daily stats, changing the agent's status, and logging agents out.
Refresh rate
The Agent page is updated every 10-15 seconds depending on the connectivity of the machine you are using. The Agent page always displays information and stats of the "Today" timeframe.
Go to Agents.
The Agent Monitoring Page appears.
Column
Description
ID
The agent user ID.
Agent
The Agent's name, shown as entered when the agent's user profile was created.
Email
The email address for the user account.
Actions
Allows Admins and Managers to perform actions like viewing assignment and other agent-specific details.
Location
As entered in the user details under Settings > Users & Teams.
Status
Shows the current status the Agent is in and allows Admins and Managers to change an agent's status.
If the agent is In-call or In-chat, The name of the queue followed by {call type, language, queue priority} will appear alongside the status name.
If an agent is not In-call or In-chat and a queue name appears, they have recently transferred a call or chat to the queue shown and it has not been answered by another agent or deflected.
On-hold shows with the queue name when the Agent has a caller on hold
Elapsed Time
The amount of time the agent has been in the current status. When an agent has exceeded a certain threshold in a status, the color of the field will change. Thresholds are the following:
> 30 min = yellow highlight
> 60 min = red highlight
On-Hold Time
Current duration caller has been placed on hold.
Next Status
If the Agent is using the Next Status feature, the field show the status they will be placed in after their current interaction/s are completed.
Total Calls
(Calls) Count of the number of completed inbound and outbound calls the agent has taken in the Today timeframe
Call count on the Agent monitoring page counts sessions not interactions
Call sessions are attributed to the last agent who handled the session
Outbound and inbound calls are included
Due to some date/time matching differences, this column should only be used as a guide - use downloadable reports for specific call interaction counts per agent
Total Chats
(Chats) Completed chat sessions handled today
Last End Time
The end time of the last completed session
Last time offered
Shows the last time the agent was offered a call/chat notification. If the session was a multicast session, the agent may have received a notification but another agent picked up the call.
Average Response Speed
(Chats) Average time for agent to respond to any consumer message sent
AHT
Average Handle Time for the individual Agent.
Call: Includes hold and wrap-up time
Chat: includes chat duration
Average Wrap-up
(Calls) Average duration agent is in wrap-up status after call sessions.
Current Agent Network Quality
Provides a score based on the quality of the agent network. Possible values include: Excellent, Good, Average, Poor, Unusable.
Missed Calls Due to Network Quality
The count of missed calls due to network quality.
Concurrency Limit
(Chat) Current concurrent chats being handled by the Agent | Defined number of chats the agent is allowed to take. Chat concurrency can be set at the global and agent level.
Total Deltacast Missed Call Count
(Calls) If you are using Deltacast routing and have set a threshold for how many calls an agent can take before they are placed in Missed Call status, this number will show the number of times that day the agent has been placed in Missed Call Status.
Search and sort agents
Click Agents.
Click in the search field.
Enter the agent's name and press enter.
You can search for an Agent by first name, last name or both.
Select the channel - Chat, Call, or All.
If an agent is assigned to any queues for chat or call, they will appear in the associated channel section. By default, the page shows only Call Agents.
When All is selected:
Both call and chat metrics columns will show.
Agents assigned to chat or call channels for queues will show.
Agents not assigned to channels/queues will show.
Filters
Filtering the page allows the current logged in user to customize the Agents monitoring to display on the page. Once you filtered and click Apply, you can bookmark or save the URL to return to the same view again.
When your view is filtered to a specific group of Agents, when you use the search field, only the agents in the current filter will show.
Filter options
Select one or more of the following filter options to see specific Agents:
| Option | Description |
|---|---|
| Team | Agents assigned to the team via sub-team or top-level Team |
| Status | Shows current Agents in the selected status/es |
| Queue Group | Select from available queue groups. |
| Location | Agents with the selected location/s as set on the Users & Teams page |
| Language | Agents assigned to queues for the selected language/s |
| Role | Agents with assigned selected User Roles as set on the Users & Teams page. Must have Agent role assigned to show on this page. |
| Agent | Agents selected by specific name |
| Supervisor | Agents who are members of one or more teams the selected Supervisor is assigned as Team Manager |
| On-hold | Current Agents who have calls on hold (by pressing the hold option). Calls on hold are separate from calls waiting in queue. |
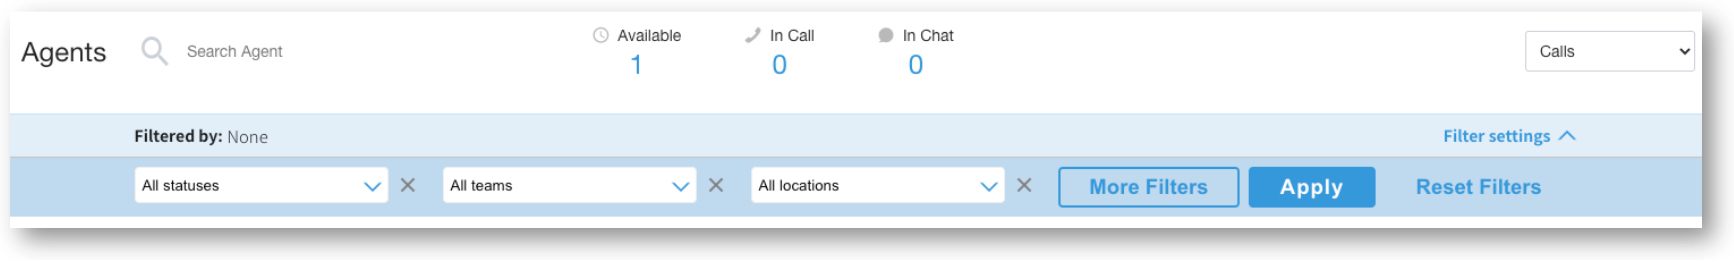
Steps to filter
Click Agents.
The current filter settings display in the Filtered by section.
Click Filter settings to show the filter options.
Select from the existing filters, or click More Filters, then select from the available list.
Click update to add the filter options.
Select one or more options from the filters using the checkbox.
Click the collapse arrow or click off of the selection window after you have made your selections.
Click Apply to save all filter selections. The filters will appear in the Filtered by area.
Bookmark or save the URL to revisit or share this filter.
Click Reset Filters to clear all selections.
Actions
View agent details and log an agent out
There are restrictions and limitations with the Log out agent action.
Click on Agents in the menu bar.
Locate the agent you wish to perform actions for by sorting or searching.
Click on the Actions icon.

View Agent Details launches a pop-up with any available information about the agent listed below:
Total Calls: Total inbound and outbound completed calls the agent handled today. If the agent was transferred a call and they were the last agent on the call, they receive the call count for that call rather than the first agent who picked it up.
Handle time: Average handle time for completed calls today.
CSAT: If CCAI Platform CSAT is being used, the average of the agent's combined scores will be shown. Avg. CSAT = Total of agent received CSAT scores/number of total scores. If you are utilizing a 3rd party service for CSAT, scores will not appear in the CCAI Platform portal.
Hold Total: The duration of the time an agent placed the caller on hold during a live call.
Repeat Callers: Shows if the agent has received calls from callers CCAI Platform has marked as repeat callers based on the contact record in your CRM.
Total Chats: Number of completed chats by the agent today. If the agent was transferred a chat and they were the last agent on the chat, they receive the chat count for that chat rather than the first agent who answered the chat.
Teams: Number of and which teams the agent is assigned to. See Users: Agents, Managers, Admins, and Teams for more information on assigning users to teams.
Assigned Queues: The queues for which the agent is assigned directly as an individual agent.
Assigned Queues From Team: Queues the agent is assigned to receive calls from based a team they belong to being assigned to the queue.
Select Log Out Agent to log the agent out of CCAI Platform, which places the agent in the Offline status.
Select Logout to confirm the action.
The agent will no longer appear on the Agent monitoring page once the agent is logged out.
Change an agent's status
There are restrictions and limitations to changing an agent's status.
Click on Agents in the menu bar.
Locate the agent you wish to perform actions for by sorting or searching (described above).
Place your mouse over the status field and click on the actions icon next to the Agent.
Select from the list of available default and custom statuses.
Use queues or teams to sort agents
Want to see a certain list of agents based on Queue assignments but don't see a way to do it from the above options? Try this trick.
Click on Dashboard > Call or Chat in the top menu bar.
Use the Queue filter to select the group of agents you would like to monitor.
Click on the Logged in Agents section of the Dashboard.
You will be brought to the Agent page with the Agents which are assigned to your selected Queue.
Queues monitoring page
Overview
The Queues page gives CCAI Platform Admins and Managers an overview of queue configurations, a live view of the queue activity, as well as data calculated for the past 24 hours. The data includes all activity for Call and/or Chat Queues that have been set up for the Account.
Columns can be customized to show various details such as the number of Agents and those agents' statuses, queue priority, number of calls, and more. You can also perform important actions by adding agents or viewing call volume.
Search and channel toggle
Search Queue - In the upper/left there is a Search field where you can enter the Queue Name or a partial Queue Name. This will then only show those Queue(s) to make locating specific queues in large organizations much easier.
A Toggle menu at the top of the Queues page will allow you to switch between Call and Chat queues
Call queues breakdown
The default view shows information about all of the various Call Queues that have been set up for IVR, In-app, and In-Web.
You may need to scroll to the bottom of the queue list in order to scroll to the right and view additional columns.
Customize Columns - Adjust which columns are shown in what order. The default column order with descriptions is listed below.
Click on the Gear Icon to expand the list of Columns. While the default columns 'Column Name', 'Actions', and 'Queue Groups' are static, all other display order of the other columns can be customized.
Queue Name - By default, queues are listed in the order they were created. Click the up/down arrow icon to sort the queue list alphabetically either ascending or descending.
The 'Queue Menu Path' is shown along with the 'Queue Menu'. You can click the downward arrow icon to expand the view to show the various Groups that have been set up for this Queue.
Actions - Click the arrow icon to expand the menu selection to view the available actions.
View Connected Calls takes you to Calls > Connected Calls filtered for that specific queue.
View Queued Calls takes you to Calls > Queued Calls filtered for that specific queue.
View Completed Calls takes you to the Calls > Completed Calls filtered for that specific queue.
Queue Groups - Shows the various Groups that you have set up for the queue.
When the 'Queue Menu path' is expanded you can click the upward arrow icon to expand the selection.
Add agents - Assign agents to this queue group directly from this view.
View Connected Calls: takes you to Calls > Connected Calls filtered for that specific queue.
View Queued Calls: takes you to Calls > Queued Calls filtered for that specific queue.
View Completed Calls: takes you to Calls > Completed Calls filtered for that specific queue.
Type: Shows the type of Queue. There are two types:
Cascade: for more information see Cascade Groups.
Allocation:For more information see Percent Allocation Groups.
By default, the Type column is sorted based on the default Queue Name column. To sort, click the up/down arrow icon.
Agents: shows the agents who have been assigned to the queue and the total number of agents that are:
*Assigned:* total number of Agents currently assigned the queue.
*Busy:* total number of agents that are not Available, and are also not currently assigned to a call/chat.
Ex. an Agent that has a status of 'Meal' would appear in this count.
Available: total number of agents in this queue that currently have a status of 'Available' and they are ready to take a call/chat.
Queue Priority: Queue Priorities that have been set up for the various queues and the queue languages. For more information see Queue Priority.
Total Offered: All Calls currently offered or projected to the Queue.
Total Connected: Total number of calls currently connected to Agents in this Queue.
Total Offered from Another Group: Finished calls transferred to this Queue from another group.
Type Breakdown: Percentage of calls by Type. See all session types here: Session Type Terminology.
StatusBreakdown: Percentage of calls per Call Status (Completed, Queued, Transferring, etc).
Total Volume: Total number of Connected, Finished, and Failed calls currently in this queue.
Avg. Volume per Hour: Calculates the average Connected, Finished, and Failed calls per hour during operation hours.
Avg. CSAT: Calculates the average of all the CSAT scores for completed calls where a CSAT score was logged.
Lowest CSAT: Lowest CSAT score that was logged.
Avg. Handle Time: Average duration of all calls handled by agents in this queue.
Longest Handle Time: Single highest Handle time logged for this queue.
Avg. Wait Time: Average time that Callers spent waiting in queue.
Longest Wait Time: Single longest Wait Time value.
Avg. Hold Time: Average amount of time that a Caller spent on hold.
Longest Hold Time: Single longest Hold time.
Repeat Contact: Number of Callers that called back into this same queue.
Chat queues breakdown
The Chat columns are the same as the Call columns however there are no "Avg/Longest Hold Times" as these two columns have been replaced with "Average/Longest Response Time."
Average Response Time: shows the average amount of time that it takes for an agent to respond.
Longest Response Time: shows the single longest Response time experienced.
Calls: connected, queued, completed
Overview
The Calls tab allows for a real-time view of queued, connected, and completed calls. Admins and Managers can view detailed information, listen in on live calls, and view real-time call stats.
Users with the Manager role will have restricted access to only agents on their assigned teams.
Connected calls
This dashboard displays all interactions in progress.
Click Calls > Connected to show calls in progress.
Search for agents or queues connected calls by typing in agent name, queue name, or call ID.
Click Customize Columns to reorganizing/excluding columns from the page.
Data Columns: Lists an overview of connected call information.
Column Title |
Description |
Start Time |
The time the interaction started. |
Barge |
Indicates whether a barge is in progress. |
Assigned Agent |
The Agent assigned to the interaction. |
Actions |
Allows users with appropriate roles to:
|
Call Id |
The unique identifier of an interaction. |
Current Handle Time |
Length of time the consumer has been on the call. |
Wait |
Length of time spent in queue before an agent was assigned. |
Type |
Interaction Type |
Queue |
For inbound sessions, show the queue the call came in through. Displays the queue name where the interaction waited. |
Verified |
Device owner verified via SmartActions. |
Transferred |
If the customer has been transferred during the call session. |
Actions
Allows for monitoring a live call or viewing call details.
See Call Details: Shows data columns (#4) in quick view mode as well as history of any transfers this session has had.
Monitor: Allows for listening to call in real-time. The caller and Agent will not know the call is being monitored.
Barge: Join the call. The Agent and the caller will hear you on the call.
End: Allows for ending the call. This can also be used when a call is stuck.
Queued calls
This Monitoring Page shows the scheduled calls / queued calls.
1. Go to Calls > Queued
The following options are available:
Search: Search for queued calls by agent or queue name.
Customize Columns: Reorganize order of data columns.
The Following Data Columns will appear.
Data Columns: Lists an overview of queued call information.
Queue-in/Schedule: Time call came into the queue or is scheduled for.
Assigned Agent: The agent who picked up the call or has been assigned a scheduled call. For non-scheduled calls, this will show momentarily before the call moves to Calls > Connected.
Actions: View call details and End a call.
CALL ID: the call id issued to the call.
Wait: Duration of in-queue time.
Type: The type of call. See Interaction Call Types in the Data. Dictionary.
Queue: The Queue menu selected by a caller.
Completed calls
Calls > Completed: Shows history of prior calls.
Search: Search for call history by agent, queue name, or call ID.
Customize Columns: Reorganize the order of data columns.
Data Columns: Lists an overview of call history information.
Start time: Time call began.
Assigned Agent: Agent last assigned to call, so if the call was transferred, the last agent to talk to the caller will be listed here.
Actions: View call details.
CALL ID: CCAI Platform ID number of call.
CSAT: Customer rating from Mobile or Web SDK.
Handle Time: Call time + hold time.
Wait: Length of time spent in queue before reaching an agent.
Type: Call type (Mobile, IVR, IVR Callback, Outgoing, Incoming, Scheduled, Voicemail).
Queue: Queue menu selected by a customer.
Queue Priority: The queue priority routing order. Possible values range from 1-8.
Answered By: that it was originally attended by : Human Agent or Virtual Agent.
Recording Permission: Identifies whether a consumer opts in or out of the call recording or whether they were asked for consent. Values: Granted, Denied, or Not Asked.
Granted: The consumer opted into having the call recorded.
Denied: The consumer opted out of having the call recorded.
Not Asked: The consumer was not asked if they consented to being recorded.
Status: Status of call (finished, abandoned, failed).
Language: The language selected by the consumer.
Verified: Device owner verified via SmartAction.
Transferred: Shows if a customer was transferred to other agent/menu.
Queue-In Time: the time the consumer entered the queue, after menu selection.
End Time: the time call ended.
Support Phone Number: the specific support number the caller dialed.
Payment Statuses: Shows if payment was successful or failed (Credit Card Over IVR Setup).
Deflection: Shows if the customer was deflected and to which channel.
Data Columns: Lists an overview of queued call information.
Queue-in/Schedule: Time call came into the queue or is scheduled for.
Assigned Agent: The agent who picked up the call or has been assigned a scheduled call. For non-scheduled calls, this will show momentarily before the call moves to Calls > Connected.
Actions: View call details.
CALL ID: CCAI Platform ID number of call.
Wait: Duration of in-queue time.
Type: Call type (Mobile, IVR, IVR Callback, Outgoing, Incoming, Scheduled).
Queue: Queue menu selected by a caller.
Chats: connected, queued, and completed
Overview
The Chats menu covers all the real-time views for your chat operation. The 3 views are Queued, Connected, and Completed, separating the chats based on waiting in-queue, connected to an agent, or finished. Each page has generally the same layout and functionality with slight variations depending on the chat status. The most notable variation is the ability to view live chats from the Chats > Connected page as described in View Connected Chats.
All Chat pages show chats for the current day based on the timezone of your computer.
Chat monitoring pages are also subject to Roles & Permissions settings.
Data columns
Each of the 3 pages shows data columns that are relevant for the selected chat status. Some of the below data columns may not be on each page.
You can reorganize the order of data columns by clicking on Customize
Columns (
Queue In Time:(Queued chats only) Time chat entered the queue
Start time: Time the chat was connected to the end-user
Assigned Agent: Name of the last agent assigned to the chat. If the chat was transferred, this shows only the last agent assigned.
Actions: View finished chat details.
CHAT ID: CCAI Platform ID number for a chat. With no CRM configured, the CHAT ID links point to external storage. With a CRM configured, the links point to the CRM.
CSAT: Satisfaction rating left by the customer via Mobile SDK or Web SDK.
Handle Time: Total time from connecting to the agent to the end of the chat.
Wait: Length of time spent in queue before connecting to an agent.
Queue: Queue menu selected by the customer or placed in via a DAP.
Status: Status of chat. Many statuses are set by the Chat Expiration or Chat Timeout, which can be set in Settings > Chats
Finished: completed chat, ended by consumer or Agent
Timeout Agent No Message: chat timed out due to the assigned agent not sending a message
Timeout End User No Message: Timed out due to the consumer not sending a message.
Timeout Agent Stopped: Timed out due to a lack of messages from Agent.
End User Stopped: Timed out due to a lack of messages from the consumer.
Abandoned: Chat was abandoned before connecting to an Agent.
Deflected: Chat was deflected based on your Automatic Redirection settings.
Failed: Failed for various reasons.
Expired: Chat expiration threshold was met. Expiration is set in Settings > Chat.
Language: The language selected by the consumer when multiple languages are used.
Verified: When using the Mobile SDK, the device owner verified through their passcode using SmartActions.
Transferred: Shows if a consumer was transferred to other agent or queue.
Queue-In Time: Time consumer entered the queue.
End Time (Completed chats only): Time chat ended.
Connected chats
Active chats that are connected to an agent.
From the CCAI Platform portal, go to Chats > Connected.
To locate specific chats, use the search field for finished chats by agent, queue name, or chat ID.
Click on the Actions icon to view the connected chat or to see details about the chat.
View Live Chat: Shows the connected chat in real-time. See View Connected Chats.
See chat details: Shows the following details about the call.
Queued chats
Chats that are in the queue waiting to be connected to an agent. When using the Dismiss Inactive feature, Chats that are restarted by the consumer sending a response are placed back in the queue and will show in Chats > Queued as well.
Go to Chats > Queued: Shows chats waiting in queue to talk to an agent.
To locate specific chats, use the search field for finished chats by agent, queue name, or chat ID.
Reorganize order of data columns by clicking on Customize Columns.
Click on the Actions arrow to view details about the chat.
Completed chats
Chats that have ended or are Dismissed when using Dismiss Inactive Chats. The status for dismissed chats on the Completed Chats page is Dismissed - Inactive End user.
Go to Chats > Completed.
To locate specific chats, use the search field for finished chats by agent, queue name, or chat ID.
Click on the Actions arrow to view details about the chat.
View connected chats
Overview
Admins and Managers have the ability to monitor live chats as they are happening. The consumer and the Agent do not know that the chat is being viewed.
If you are a manager viewing a chat, end the viewing session before a chat is transferred to you.
View connected chats in real-time
Go to Chats > Ongoing.
Click Actions > View Live Chat to begin an incognito view of the live chat.
Agent name, consumer name, and queue name will all be visible.
Click View Case/Ticket to open the record for this chat in your CRM.
Shows that a message is currently being typed.
Click Go to beginning of conversation to scroll the chat to the top.
View transcripts for completed chats
Chat transcripts are available directly within the Contact Center AI Platform portal on the Chats > Completed monitoring dashboard. The transcripts displayed are from completed chats, and are stored and retrieved from your configured external storage.
Accessing chat transcripts
To access chat transcripts, follow these steps:
In the CCAI Platform portal, click Chats > Connected. If you don't see the Chats menu, click Menu.
Locate the CHAT ID for the completed chat you would like to view.
From the Action column, click More.
Click Chat Details. The chat transcript appears.
Messages in the transcripts appear from oldest to newest. If there are any media files in the chat history, they are also be shown.
Troubleshooting
A transcript might not be available in the following situations:
The transcript is not stored in external storage.
The chat ID is not found in external storage.
Contact Center AI Platform failed to get the transcript from external storage. The system retries getting the transcript.
Real-Time email notifications for call and agent metrics
Overview
To help support your Real-Time Management operation, you can actively track metrics and send you and your team email notifications. Multiple notifications rules can run at any given time and alert you without needing to actively watch dashboard metrics.
Feature specifics
Notifications cover agent status durations and call queue data
Chat queues are currently not supported
Notification time frame: when a given event occurs once, or more, within the specified time frame, a single notification for that event is sent when it first occurs. Example below:
If a notification is set to trigger when agent John Doe is in Break status for more than 30 min within a 4-hour time frame, as soon as John Doe's break time exceeds 30 minutes a notification is sent.
If the agent exceeds 30 minutes in Break status again within 4 hours no additional notification is sent.
If the agent takes another break longer than 30 min, 5 hours after the first one, a new notification would be sent.
Example notification rules
Exceeding 15 minutes in Break status for an agent or team of agents in an 8-hour time frame
A queue exceeds an average wait time of 5 minutes
The average CSAT for your operation is 4 or lower in a 4-hour timeframe
Create new notification rules
Click on the bell icon, then click on View all Notification Rules.
Click Add New Notification Rule.
Choose if you want the rule to be for all (any) agents, teams, or queues in your environment, or a specific agent, queue, or team.
Select the Metric. Options vary based on the target metric to watch:
Agent
Average CSAT
Available Time
Unavailable Time
Break Time
Meal Time
Special Task Time
Team
Average CSAT
Average Call Duration
Queue
Average CSAT
Average Call Duration
Average Wait Time
Choose the Operator (>, <, =<, or =>), and Value (time frame or CSAT stars) to monitor.
Select or enter which users should receive an email if the set threshold is reached in the given time frame.
Myself: sends an email to the email associated with the currently logged in account
Specific: Enter the specific Manager/Admin names, or team names
All Managers and Admins: All users with the manager and Admin roles
Click Apply Rules to save.
Edit existing notification rules
Click on the bell icon in the top bar, then click on View all Notification Rules.
Locate the rule you would like to edit and click on the edit (pencil) icon.
Make updates to the rule settings.
Click Apply Rules to save.
Delete existing rules
Click on the bell icon, then click on View all Notification Rules.
Locate the rule you would like to delete and click on the X at the end of the row.
Confirm by clicking OK on the confirmation pop-up.