This document describes how you deploy an export mechanism to stream logs from Google Cloud resources to Splunk. It assumes that you've already read the corresponding reference architecture for this use case.
These instructions are intended for operations and security administrators who want to stream logs from Google Cloud to Splunk. You must be familiar with Splunk and the Splunk HTTP Event Collector (HEC) when using these instructions for IT operations or security use cases. Although not required, familiarity with Dataflow pipelines, Pub/Sub, Cloud Logging, Identity and Access Management, and Cloud Storage is useful for this deployment.
To automate the deployment steps in this reference architecture using
infrastructure as code (IaC), see the
terraform-splunk-log-export
GitHub repository.
Architecture
The following diagram shows the reference architecture and demonstrates how log data flows from Google Cloud to Splunk.
As shown in the diagram, Cloud Logging collects the logs into an organization-level log sink and sends the logs to Pub/Sub. The Pub/Sub service creates a single topic and subscription for the logs and forwards the logs to the main Dataflow pipeline. The main Dataflow pipeline is a Pub/Sub to Splunk streaming pipeline which pulls logs from the Pub/Sub subscription and delivers them to Splunk. Parallel to the primary Dataflow pipeline, the secondary Dataflow pipeline is a Pub/Sub to Pub/Sub streaming pipeline to replay messages if a delivery fails. At the end of the process, Splunk Enterprise or Splunk Cloud Platform acts as an HEC endpoint and receives the logs for further analysis. For more details, see the Architecture section of the reference architecture.
To deploy this reference architecture, you perform the following tasks:
- Perform set up tasks.
- Create an aggregated log sink in a dedicated project.
- Create a dead-letter topic.
- Set up a Splunk HEC endpoint.
- Configure the Dataflow pipeline capacity.
- Export logs to Splunk.
- Transform logs or events in-flight using user-defined functions (UDF) within the Splunk Dataflow pipeline.
- Handle delivery failures to avoid data loss from potential misconfiguration or transient network issues.
Before you begin
Complete the following steps to set up an environment for your Google Cloud to Splunk reference architecture:
- Bring up a project, enable billing, and activate the APIs.
- Grant IAM roles.
- Set up your environment.
- Set up secure networking.
Bring up a project, enable billing, and activate the APIs
-
In the Google Cloud console, on the project selector page, select or create a Google Cloud project.
-
Make sure that billing is enabled for your Google Cloud project.
-
Enable the Cloud Monitoring API, Secret Manager, Compute Engine, Pub/Sub, and Dataflow APIs.
Grant IAM roles
In the Google Cloud console, ensure that you have the following Identity and Access Management (IAM) permissions for organization and project resources. For more information, see Granting, changing, and revoking access to resources.
| Permissions | Predefined roles | Resource |
|---|---|---|
|
|
Organization |
|
|
Project |
|
|
Project |
If the predefined IAM roles don't include enough permissions for you to perform your duties, create a custom role. A custom role gives you the access that you need, while also helping you to follow the principle of least privilege.
Set up your environment
In the Google Cloud console, activate Cloud Shell.
Set the project for your active Cloud Shell session:
gcloud config set project PROJECT_ID
Replace
PROJECT_IDwith your project ID.
Set up secure networking
In this step, you set up secure networking before processing and exporting logs to Splunk Enterprise.
Create a VPC network and a subnet:
gcloud compute networks create NETWORK_NAME --subnet-mode=custom
gcloud compute networks subnets create SUBNET_NAME \
--network=NETWORK_NAME \
--region=REGION \
--range=192.168.1.0/24
Replace the following:
NETWORK_NAME: the name for your networkSUBNET_NAME: the name for your subnetREGION: the region that you want to use for this network
Create a firewall rule for Dataflow worker virtual machines (VMs) to communicate with one another:
gcloud compute firewall-rules create allow-internal-dataflow \
--network=NETWORK_NAME \
--action=allow \
--direction=ingress \
--target-tags=dataflow \
--source-tags=dataflow \
--priority=0 \
--rules=tcp:12345-12346
This rule allows internal traffic between Dataflow VMs which use TCP ports 12345-12346. Also, the Dataflow service sets the
dataflowtag.Create a Cloud NAT gateway:
gcloud compute routers create nat-router \
--network=NETWORK_NAME \
--region=REGION

gcloud compute routers nats create nat-config \
--router=nat-router \
--nat-custom-subnet-ip-ranges=SUBNET_NAME \
--auto-allocate-nat-external-ips \
--region=REGION
Enable Private Google Access on the subnet:
gcloud compute networks subnets update SUBNET_NAME \
--enable-private-ip-google-access \
--region=REGION
Create a log sink
In this section, you create the organization-wide log sink and its Pub/Sub destination, along with the necessary permissions.
In Cloud Shell, create a Pub/Sub topic and associated subscription as your new log sink destination:
gcloud pubsub topics create INPUT_TOPIC_NAME
gcloud pubsub subscriptions create \
--topic INPUT_TOPIC_NAME INPUT_SUBSCRIPTION_NAME
Replace the following:
INPUT_TOPIC_NAME: the name for the Pub/Sub topic to be used as the log sink destinationINPUT_SUBSCRIPTION_NAME: the name for the Pub/Sub subscription to the log sink destination
Create the organization log sink:
gcloud logging sinks create ORGANIZATION_SINK_NAME \
pubsub.googleapis.com/projects/PROJECT_ID/topics/INPUT_TOPIC_NAME \
--organization=ORGANIZATION_ID \
--include-children \
--log-filter='NOT logName:projects/PROJECT_ID/logs/dataflow.googleapis.com'
Replace the following:
ORGANIZATION_SINK_NAME: the name of your sink in the organizationORGANIZATION_ID: your organization ID
The command consists of the following flags:
- The
--organizationflag specifies that this is an organization-level log sink. - The
--include-childrenflag is required and ensures that the organization-level log sink includes all logs across all subfolders and projects. - The
--log-filterflag specifies the logs to be routed. In this example, you exclude Dataflow operations logs specifically for the projectPROJECT_ID, because the log export Dataflow pipeline generates more logs itself as it processes logs. The filter prevents the pipeline from exporting its own logs, avoiding a potentially exponential cycle. The output includes a service account in the form ofo#####-####@gcp-sa-logging.iam.gserviceaccount.com.
Grant the Pub/Sub Publisher IAM role to the log sink service account on the Pub/Sub topic
INPUT_TOPIC_NAME. This role allows the log sink service account to publish messages on the topic.gcloud pubsub topics add-iam-policy-binding INPUT_TOPIC_NAME \ --member=serviceAccount:LOG_SINK_SERVICE_ACCOUNT@PROJECT_ID.iam.gserviceaccount.com \ --role=roles/pubsub.publisher
Replace
LOG_SINK_SERVICE_ACCOUNTwith the name of the service account for your log sink.
Create a dead-letter topic
To prevent potential data loss that results when a message fails to be delivered, you should create a Pub/Sub dead-letter topic and corresponding subscription. The failed message is stored in the dead-letter topic until an operator or site reliability engineer can investigate and correct the failure. For more information, see Replay failed messages section of the reference architecture.
In Cloud Shell, create a Pub/Sub dead-letter topic and subscription to prevent data loss by storing any undeliverable messages:
gcloud pubsub topics create DEAD_LETTER_TOPIC_NAME
gcloud pubsub subscriptions create --topic DEAD_LETTER_TOPIC_NAME DEAD_LETTER_SUBSCRIPTION_NAME
Replace the following:
DEAD_LETTER_TOPIC_NAME: the name for the Pub/Sub topic that will be the dead-letter topicDEAD_LETTER_SUBSCRIPTION_NAME: the name for the Pub/Sub subscription for the dead-letter topic
Set up a Splunk HEC endpoint
In the following procedures, you set up a Splunk HEC endpoint and store the newly created HEC token as a secret in Secret Manager. When you deploy the Splunk Dataflow pipeline, you need to supply both the endpoint URL and the token.
Configure the Splunk HEC
- If you don't already have a Splunk HEC endpoint, see the Splunk documentation to learn how to configure a Splunk HEC. Splunk HEC runs on the Splunk Cloud Platform service or on your own Splunk Enterprise instance. Keep Splunk HEC Indexer Acknowledgement option disabled, since it is not supported by Splunk Dataflow.
- In Splunk, after you create a Splunk HEC token, copy the token value.
- In Cloud Shell, save the Splunk HEC token value in a temporary file
named
splunk-hec-token-plaintext.txt.
Store the Splunk HEC token in Secret Manager
In this step, you create a secret and a single underlying secret version in which to store the Splunk HEC token value.
In Cloud Shell, create a secret to contain your Splunk HEC token:
gcloud secrets create hec-token \
 --replication-policy="automatic"
For more information on the replication policies for secrets, see Choose a replication policy.
Add the token as a secret version using the contents of the file
splunk-hec-token-plaintext.txt:gcloud secrets versions add hec-token \ --data-file="./splunk-hec-token-plaintext.txt"
Delete the
splunk-hec-token-plaintext.txtfile, as it is no longer needed.
Configure the Dataflow pipeline capacity
The following table summarizes the recommended general best practices for configuring the Dataflow pipeline capacity settings:
| Setting | General best practice |
|---|---|
|
Set to baseline machine size |
|
Set to the maximum number of workers needed to handle the expected peak EPS per your calculations |
|
Set to 2 x vCPUs/worker x the maximum number of workers to maximize the number of parallel Splunk HEC connections |
|
Set to 10-50 events/request for logs, provided that the max buffering delay of two seconds is acceptable |
Remember to use your own unique values and calculations when you deploy this reference architecture in your environment.
Set the values for machine type and machine count. To calculate values appropriate for your cloud environment, see Machine type and Machine count sections of the reference architecture.
DATAFLOW_MACHINE_TYPE
DATAFLOW_MACHINE_COUNT
Set the values for Dataflow parallelism and batch count. To calculate values appropriate for your cloud environment, see the Parallelism and Batch count sections of the reference architecture.
JOB_PARALLELISM
JOB_BATCH_COUNT
For more information on how to calculate Dataflow pipeline capacity parameters, see the Performance and cost optimization design considerations section of the reference architecture.
Export logs by using the Dataflow pipeline
In this section, you deploy the Dataflow pipeline with the following steps:
- Create a Cloud Storage bucket and Dataflow worker service account.
- Grant roles and access to the Dataflow worker service account.
- Deploy the Dataflow pipeline.
- View logs in Splunk.
The pipeline delivers Google Cloud log messages to the Splunk HEC.
Create a Cloud Storage bucket and Dataflow worker service account
In Cloud Shell, create a new Cloud Storage bucket with a uniform bucket-level access setting:
gcloud storage buckets create gs://PROJECT_ID-dataflow/ --uniform-bucket-level-access
The Cloud Storage bucket that you just created is where the Dataflow job stages temporary files.
In Cloud Shell, create a service account for your Dataflow workers:
gcloud iam service-accounts create WORKER_SERVICE_ACCOUNT \
   --description="Worker service account to run Splunk Dataflow jobs" \
   --display-name="Splunk Dataflow Worker SA"
Replace
WORKER_SERVICE_ACCOUNTwith the name that you want to use for the Dataflow worker service account.
Grant roles and access to the Dataflow worker service account
In this section, grant the required roles to the Dataflow worker service account as shown in the following table.
| Role | Path | Purpose |
|---|---|---|
| Dataflow Admin |
|
Enable the service account to act as a Dataflow admin. |
| Dataflow Worker |
|
Enable the service account to act as a Dataflow worker. |
| Storage Object Admin |
|
Enable the service account to access the Cloud Storage bucket that is used by Dataflow for staging files. |
| Pub/Sub Publisher |
|
Enable the service account to publish failed messages to the Pub/Sub dead-letter topic. |
| Pub/Sub Subscriber |
|
Enable the service account to access the input subscription. |
| Pub/Sub Viewer |
|
Enable the service account to view the subscription. |
| Secret Manager Secret Accessor |
|
Enable the service account to access the secret that contains the Splunk HEC token. |
In Cloud Shell, grant the Dataflow worker service account the Dataflow Admin and Dataflow Worker roles that this account needs to execute Dataflow job operations and administration tasks:
gcloud projects add-iam-policy-binding PROJECT_ID \
   --member="serviceAccount:WORKER_SERVICE_ACCOUNT@PROJECT_ID.iam.gserviceaccount.com" \
   --role="roles/dataflow.admin"
gcloud projects add-iam-policy-binding PROJECT_ID \
   --member="serviceAccount:WORKER_SERVICE_ACCOUNT@PROJECT_ID.iam.gserviceaccount.com" \
   --role="roles/dataflow.worker"
Grant the Dataflow worker service account access to view and consume messages from the Pub/Sub input subscription:
gcloud pubsub subscriptions add-iam-policy-binding INPUT_SUBSCRIPTION_NAME \
 --member="serviceAccount:WORKER_SERVICE_ACCOUNT@PROJECT_ID.iam.gserviceaccount.com" \
 --role="roles/pubsub.subscriber"
gcloud pubsub subscriptions add-iam-policy-binding INPUT_SUBSCRIPTION_NAME \
 --member="serviceAccount:WORKER_SERVICE_ACCOUNT@PROJECT_ID.iam.gserviceaccount.com" \
 --role="roles/pubsub.viewer"
Grant the Dataflow worker service account access to publish any failed messages to the Pub/Sub unprocessed topic:
gcloud pubsub topics add-iam-policy-binding DEAD_LETTER_TOPIC_NAME \
 --member="serviceAccount:WORKER_SERVICE_ACCOUNT@PROJECT_ID.iam.gserviceaccount.com" \
 --role="roles/pubsub.publisher"
Grant the Dataflow worker service account access to the Splunk HEC token secret in Secret Manager:
gcloud secrets add-iam-policy-binding hec-token \
--member="serviceAccount:WORKER_SERVICE_ACCOUNT@PROJECT_ID.iam.gserviceaccount.com" \
--role="roles/secretmanager.secretAccessor"
Grant the Dataflow worker service account read and write access to the Cloud Storage bucket to be used by the Dataflow job for staging files:
gcloud storage buckets add-iam-policy-binding gs://PROJECT_ID-dataflow/ \
--member="serviceAccount:WORKER_SERVICE_ACCOUNT@PROJECT_ID.iam.gserviceaccount.com"
--role=”roles/storage.objectAdmin”
Deploy the Dataflow pipeline
In Cloud Shell, set the following environment variable for your Splunk HEC URL:
export SPLUNK_HEC_URL=SPLUNK_HEC_URL
Replace the
SPLUNK_HEC_URLvariable using the formprotocol://host[:port], where:protocolis eitherhttporhttps.hostis the fully qualified domain name (FQDN) or IP address of either your Splunk HEC instance, or, if you have multiple HEC instances, the associated HTTP(S) (or DNS-based) load balancer.portis the HEC port number. It is optional, and depends on your Splunk HEC endpoint configuration.
An example of a valid Splunk HEC URL input is
https://splunk-hec.example.com:8088. If you are sending data to HEC on Splunk Cloud Platform, see Send data to HEC on Splunk Cloud to determine the abovehostandportportions of your specific Splunk HEC URL.The Splunk HEC URL must not include the HEC endpoint path, for example,
/services/collector. The Pub/Sub to Splunk Dataflow template currently only supports the/services/collectorendpoint for JSON-formatted events, and it automatically appends that path to your Splunk HEC URL input. To learn more about the HEC endpoint, see the Splunk documentation for services/collector endpoint.Deploy the Dataflow pipeline using the Pub/Sub to Splunk Dataflow template:
gcloud beta dataflow jobs run JOB_NAME \
--gcs-location=gs://dataflow-templates/latest/Cloud_PubSub_to_Splunk \
--staging-location=gs://PROJECT_ID-dataflow/temp/ \
--worker-machine-type=DATAFLOW_MACHINE_TYPE \
--max-workers=DATAFLOW_MACHINE_COUNT \
--region=REGION \
--network=NETWORK_NAME \
--subnetwork=regions/REGION/subnetworks/SUBNET_NAME \
--disable-public-ips \
--parameters \
inputSubscription=projects/PROJECT_ID/subscriptions/INPUT_SUBSCRIPTION_NAME,\
outputDeadletterTopic=projects/PROJECT_ID/topics/DEAD_LETTER_TOPIC_NAME,\
url=SPLUNK_HEC_URL,\
tokenSource=SECRET_MANAGER, \
tokenSecretId=projects/PROJECT_ID/secrets/hec-token/versions/1, \
batchCount=JOB_BATCH_COUNT,\
parallelism=JOB_PARALLELISM,\
javascriptTextTransformGcsPath=gs://splk-public/js/dataflow_udf_messages_replay.js,\
javascriptTextTransformFunctionName=process
Replace
JOB_NAMEwith the name formatpubsub-to-splunk-date+"%Y%m%d-%H%M%S"The optional parameters
javascriptTextTransformGcsPathandjavascriptTextTransformFunctionNamespecify a publicly available sample UDF:gs://splk-public/js/dataflow_udf_messages_replay.js. The sample UDF includes code examples for event transformation and decoding logic that you use to replay failed deliveries. For more information about UDF, see Transform events in-flight with UDF.After the pipeline job completes, find the new job ID in the output, copy the job ID, and save it. You enter this job ID in a later step.
View logs in Splunk
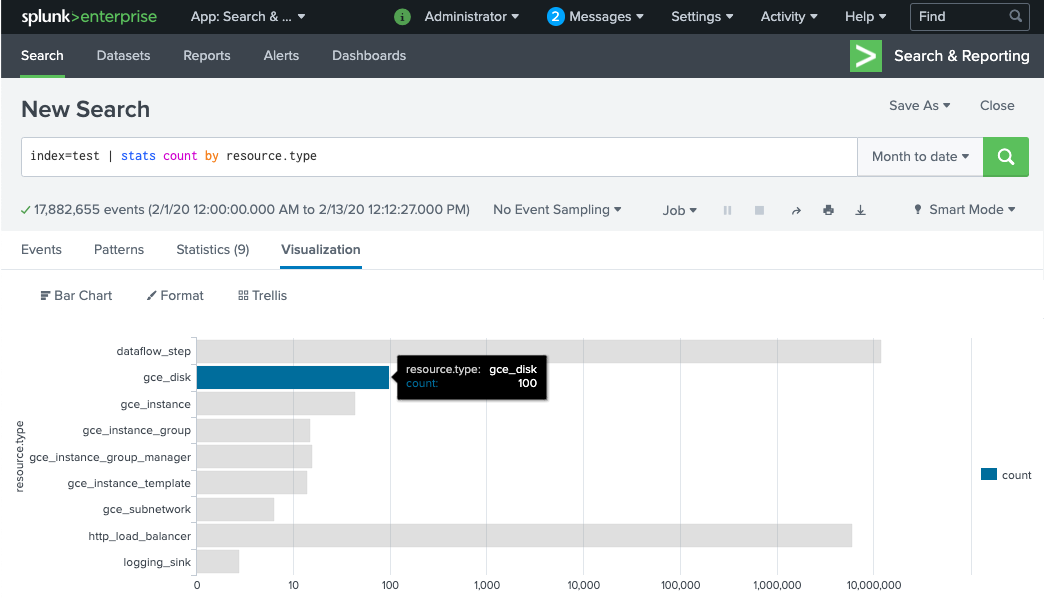
It takes a few minutes for the Dataflow pipeline workers to be provisioned and ready to deliver logs to Splunk HEC. You can confirm that the logs are properly received and indexed in the Splunk Enterprise or Splunk Cloud Platform search interface. To see the number of logs per type of monitored resource:
In Splunk, open Splunk Search & Reporting.
Run the search
index=[MY_INDEX] | stats count by resource.typewhere theMY_INDEXindex is configured for your Splunk HEC token:
If you don't see any events, see Handle delivery failures.
Transform events in-flight with UDF
The Pub/Sub to Splunk Dataflow template supports a JavaScript UDF for custom event transformation, such as adding new fields or setting Splunk HEC metadata on an event basis. The pipeline you deployed uses this sample UDF.
In this section, you first edit the sample UDF function to add a new event field. This new field specifies the value of the originating Pub/Sub subscription as additional contextual information. You then update the Dataflow pipeline with the modified UDF.
Modify the sample UDF
In Cloud Shell, download the JavaScript file that contains the sample UDF function:
wget https://storage.googleapis.com/splk-public/js/dataflow_udf_messages_replay.js
In the text editor of your choice, open the JavaScript file, locate the field
event.inputSubscription, uncomment that line and replacesplunk-dataflow-pipelinewithINPUT_SUBSCRIPTION_NAME:event.inputSubscription = "INPUT_SUBSCRIPTION_NAME";
Save the file.
Upload the file to the Cloud Storage bucket:
gcloud storage cp ./dataflow_udf_messages_replay.js gs://PROJECT_ID-dataflow/js/
Update the Dataflow pipeline with the new UDF
In Cloud Shell, stop the pipeline by using the Drain option to ensure that the logs which were already pulled from Pub/Sub are not lost:
gcloud dataflow jobs drain JOB_ID --region=REGION
Run the Dataflow pipeline job with the updated UDF.
gcloud beta dataflow jobs run JOB_NAME \
--gcs-location=gs://dataflow-templates/latest/Cloud_PubSub_to_Splunk \
--worker-machine-type=DATAFLOW_MACHINE_TYPE \
--max-workers=DATAFLOW_MACHINE_COUNT \
--region=REGION \
--network=NETWORK_NAME \
--subnetwork=regions/REGION/subnetworks/SUBNET_NAME \
--disable-public-ips \
--parameters \
inputSubscription=projects/PROJECT_ID/subscriptions/INPUT_SUBSCRIPTION_NAME,\
outputDeadletterTopic=projects/PROJECT_ID/topics/DEAD_LETTER_TOPIC_NAME,\
url=SPLUNK_HEC_URL,\
tokenSource=SECRET_MANAGER, \
tokenSecretId=projects/PROJECT_ID/secrets/hec-token/versions/1, \
batchCount=JOB_BATCH_COUNT,\
parallelism=JOB_PARALLELISM,\
javascriptTextTransformGcsPath=gs://PROJECT_ID-dataflow/js/dataflow_udf_messages_replay.js,\
javascriptTextTransformFunctionName=process
Replace
JOB_NAMEwith the name formatpubsub-to-splunk-date+"%Y%m%d-%H%M%S"
Handle delivery failures
Delivery failures can happen due to errors in processing events or connecting to the Splunk HEC. In this section, you introduce delivery failure to demonstrate the error handling workflow. You also learn how to view and trigger the re-delivery of the failed messages to Splunk.
Trigger delivery failures
To introduce a delivery failure manually in Splunk, do one of the following:
- If you run a single instance, stop the Splunk server to cause connection errors.
- Disable the relevant HEC token from your Splunk input configuration.
Troubleshoot failed messages
To investigate a failed message, you can use the Google Cloud console:
In the Google Cloud console, go to the Pub/Sub Subscriptions page.
Click the unprocessed subscription that you created. If you used the previous example, the subscription name is:
projects/PROJECT_ID/subscriptions/DEAD_LETTER_SUBSCRIPTION_NAME.To open the messages viewer, click View Messages.
To view messages, click Pull, making sure to leave Enable ack messages cleared.
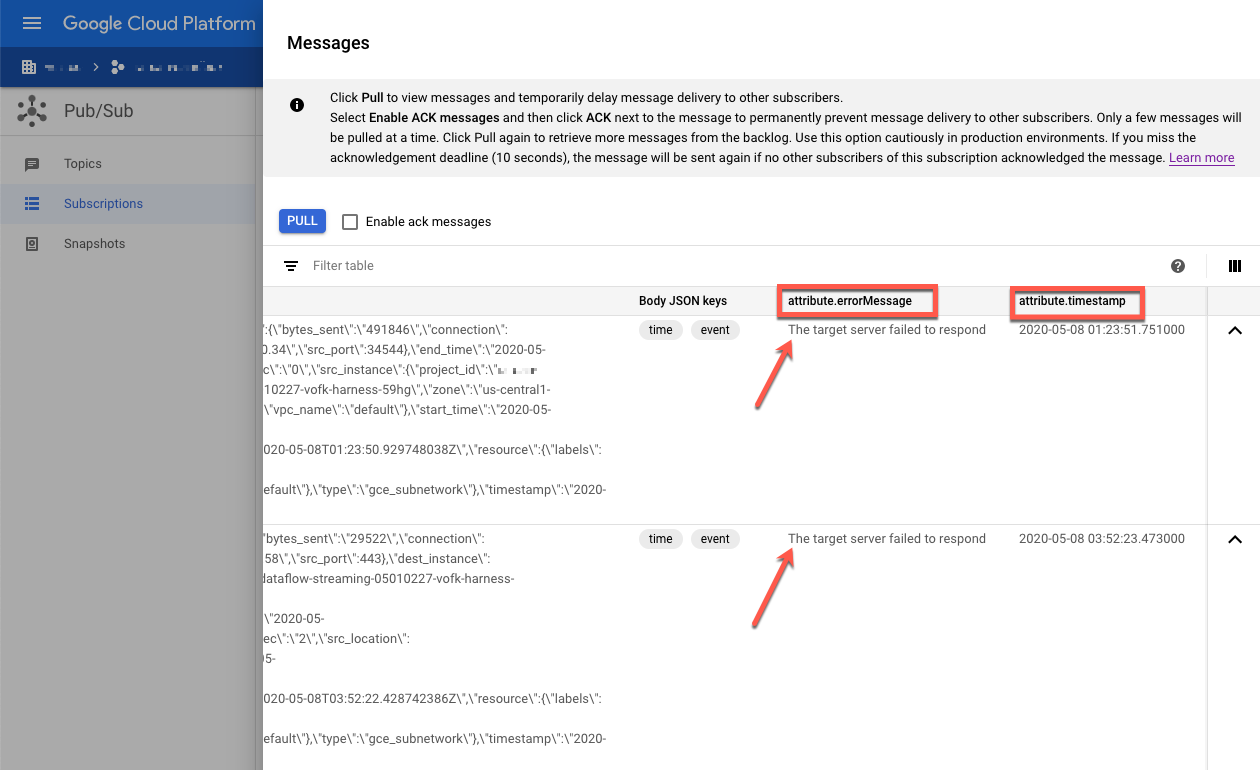
Inspect the failed messages. Pay attention to the following:
- The Splunk event payload under the
Message bodycolumn. - The error message under the
attribute.errorMessagecolumn. - The error timestamp under the
attribute.timestampcolumn.
- The Splunk event payload under the
The following screenshot shows an example of a failure message that you receive
if the Splunk HEC endpoint is temporarily down or unreachable. Notice that the
text of the errorMessage attribute reads The target server failed to respond.
The message also shows the timestamp that is associated with each failure. You
can use this timestamp to troubleshoot the root cause of the failure.

Replay failed messages
In this section, you need to restart the Splunk server or enable the Splunk HEC endpoint to fix the delivery error. You can then replay the unprocessed messages.
In Splunk, use one of the following methods to restore the connection to Google Cloud:
- If you stopped the Splunk server, restart the server.
- If you disabled the Splunk HEC endpoint in the Trigger delivery failures section, check that the Splunk HEC endpoint is now operating.
In Cloud Shell, take a snapshot of the unprocessed subscription before re-processing the messages in this subscription. The snapshot prevents the loss of messages if there's an unexpected configuration error.
gcloud pubsub snapshots create SNAPSHOT_NAME \
--subscription=DEAD_LETTER_SUBSCRIPTION_NAME
Replace
SNAPSHOT_NAMEwith a name that helps you identify the snapshot, such asdead-letter-snapshot-date+"%Y%m%d-%H%M%S.Use the Pub/Sub to Splunk Dataflow template to create a Pub/Sub to Pub/Sub pipeline. The pipeline uses another Dataflow job to transfer the messages from the unprocessed subscription back to the input topic.
DATAFLOW_INPUT_TOPIC="INPUT_TOPIC_NAME"
DATAFLOW_DEADLETTER_SUB="DEAD_LETTER_SUBSCRIPTION_NAME"
JOB_NAME=splunk-dataflow-replay-date +"%Y%m%d-%H%M%S"
gcloud dataflow jobs run JOB_NAME \
--gcs-location= gs://dataflow-templates/latest/Cloud_PubSub_to_Cloud_PubSub \
--worker-machine-type=n2-standard-2 \
--max-workers=1 \
--region=REGION \
--parameters \
inputSubscription=projects/PROJECT_ID/subscriptions/DEAD_LETTER_SUBSCRIPTION_NAME,\
outputTopic=projects/PROJECT_ID/topics/INPUT_TOPIC_NAME
Copy the Dataflow job ID from the command output and save it for later. You'll enter this job ID as
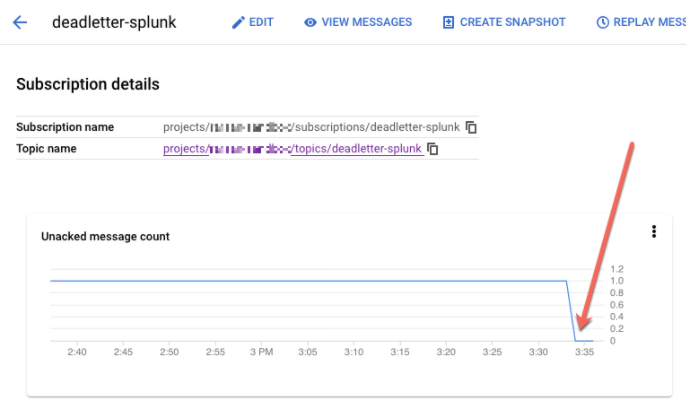
REPLAY_JOB_IDwhen you drain your Dataflow job.In the Google Cloud console, go to the Pub/Sub Subscriptions page.
Select the unprocessed subscription. Confirm that the Unacked message count graph is down to 0, as shown in the following screenshot.

In Cloud Shell, drain the Dataflow job that you created:
gcloud dataflow jobs drain REPLAY_JOB_ID --region=REGION
Replace
REPLAY_JOB_IDwith the Dataflow job ID you saved earlier.
When messages are transferred back to the original input topic, the main Dataflow pipeline automatically picks up the failed messages and re-delivers them to Splunk.
Confirm messages in Splunk
To confirm that the messages have been re-delivered, in Splunk, open Splunk Search & Reporting.
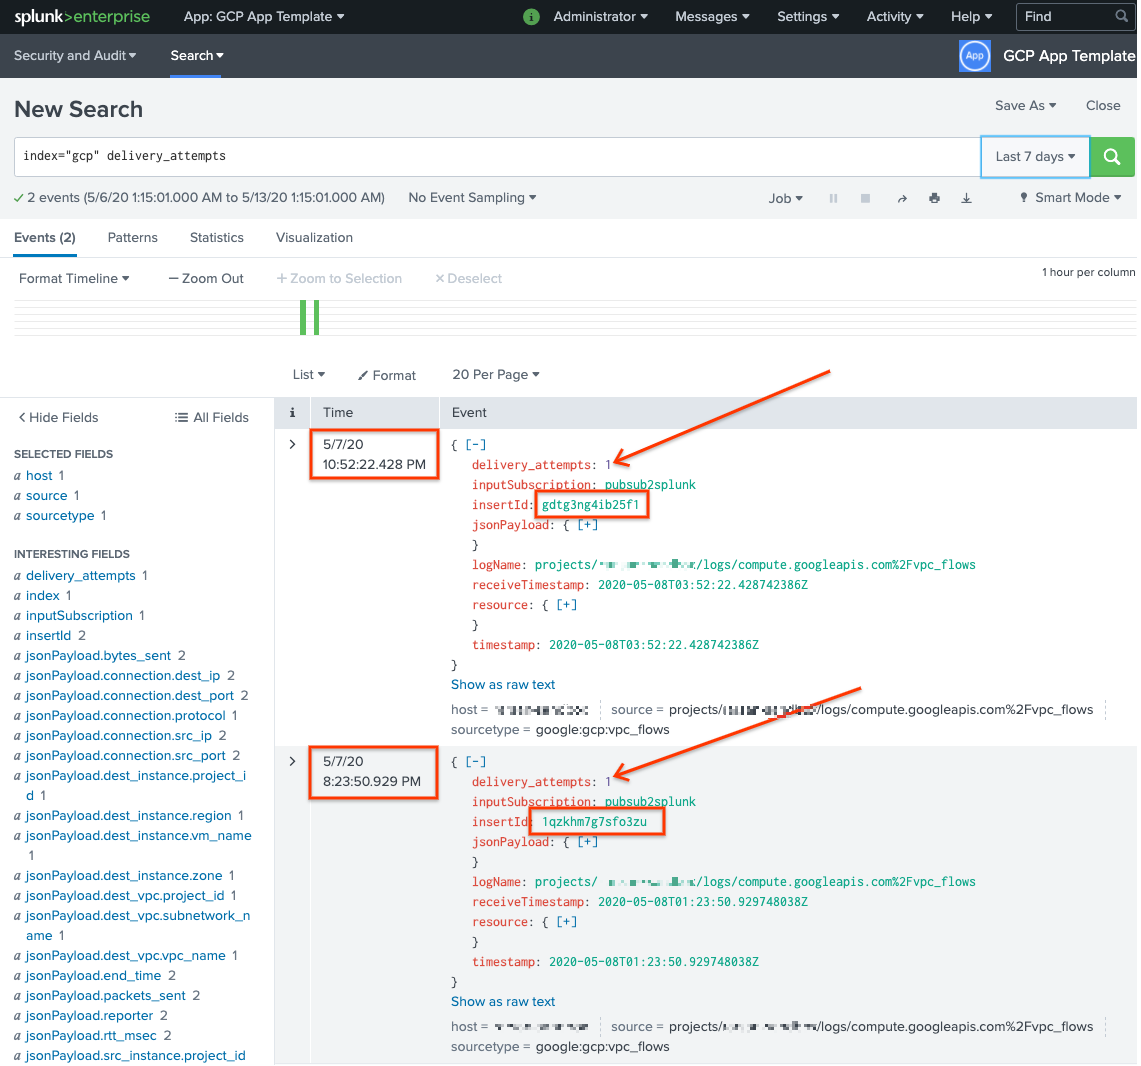
Run a search for
delivery_attempts > 1. This is a special field that the sample UDF adds to each event to track the number of delivery attempts. Make sure to expand the search time range to include events that may have occurred in the past, because the event timestamp is the original time of creation, not the time of indexing.
In the following screenshot, the two messages that originally failed are now successfully delivered and indexed in Splunk with the correct timestamp.

Notice that the insertId field value is the same as the value that appears in
the failed messages when you view the unprocessed subscription.
The insertId field is a unique identifier that Cloud Logging assigns to the
original log entry.. The insertId also appears in the Pub/Sub
message body.
Clean up
To avoid incurring charges to your Google Cloud account for the resources used in this reference architecture, either delete the project that contains the resources, or keep the project and delete the individual resources.
Delete the organization-level sink
- Use the following command to delete the organization-level log sink:
gcloud logging sinks delete ORGANIZATION_SINK_NAME --organization=ORGANIZATION_ID
Delete the project
With the log sink deleted, you can proceed with deleting resources created to receive and export logs. The easiest way is to delete the project you created for the reference architecture.
- In the Google Cloud console, go to the Manage resources page.
- In the project list, select the project that you want to delete, and then click Delete.
- In the dialog, type the project ID, and then click Shut down to delete the project.
What's next
- For a full list of Pub/Sub to Splunk Dataflow template parameters, see the Pub/Sub to Splunk Dataflow documentation.
- For the corresponding Terraform templates to help you deploy this reference
architecture, see the
terraform-splunk-log-exportGitHub repository. It includes a pre-built Cloud Monitoring dashboard for monitoring your Splunk Dataflow pipeline. - For more details on Splunk Dataflow custom metrics and logging to help you monitor and troubleshoot your Splunk Dataflow pipelines, refer to this blog New observability features for your Splunk Dataflow streaming pipelines.
- For more reference architectures, diagrams, and best practices, explore the Cloud Architecture Center.

