Membuat dasbor, diagram, dan pemberitahuan
Dokumen ini menjelaskan cara membuat diagram dan pemberitahuan untuk memantau resource BigQuery dengan menggunakan Cloud Monitoring.
Sebelum memulai
Sebelum menggunakan Cloud Monitoring, pastikan Anda memiliki hal berikut:
- Akun Penagihan Cloud.
- Project BigQuery dengan penagihan diaktifkan.
Salah satu cara untuk memastikan Anda memiliki keduanya adalah dengan menyelesaikan Panduan memulai menggunakan Google Cloud konsol.
Melihat dan membuat dasbor, diagram, dan pemberitahuan
Melihat dasbor Cloud Monitoring
Untuk menggunakan Cloud Monitoring guna memantau project BigQuery Anda:
Di konsol Google Cloud , buka halaman Monitoring.
Pilih nama project Anda jika belum dipilih di bagian atas halaman.
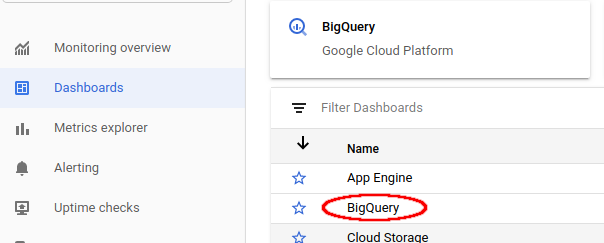
Untuk melihat resource BigQuery, pilih Dashboards > BigQuery. Di halaman ini, Anda akan melihat daftar tabel, peristiwa, dan pelaporan insiden yang dapat dikonfigurasi oleh pengguna serta diagram metrik project atau metrik set data.

Memvisualisasikan slot yang tersedia dan slot yang dialokasikan
Untuk memvisualisasikan slot yang tersedia dan slot yang dialokasikan untuk project Anda, buka dasbor untuk BigQuery yang dijelaskan dalam Melihat dasbor Cloud Monitoring:
Di konsol Google Cloud , buka halaman Monitoring.
Pilih Dashboards > BigQuery.
Di dasbor Cloud Monitoring untuk BigQuery, scroll ke diagram bernama Slot Utilization.
Diagram Slot Utilization muncul di dasbor default Cloud Monitoring utama dan dasbor Cloud Monitoring untuk BigQuery.
Membuat dasbor dan diagram
Menampilkan metrik yang dikumpulkan oleh Cloud Monitoring di diagram dan dasbor Anda sendiri:
Di konsol Google Cloud , buka halaman Monitoring.
Pilih Dashboards > Create Dashboard.
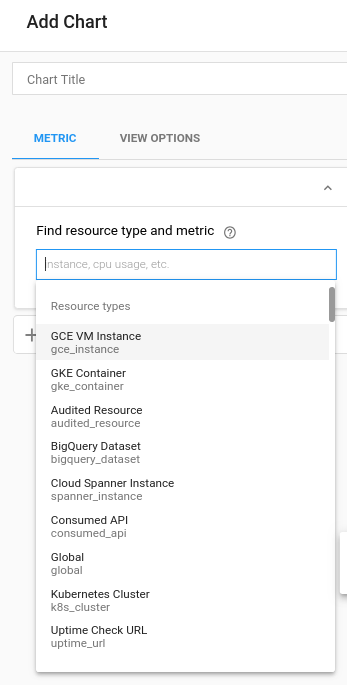
Klik Add Chart. Anda melihat halaman Tambahkan Diagram:

Di kolom panel Temukan jenis resource dan metrik:
- Untuk menu drop-down Resource type, pilih Global. Anda mungkin perlu memperluas daftar Resource type agar opsi Global dapat terlihat.
- Untuk menu drop-down Metric, pilih Query execution time.
Kolom panel Aggregation mengontrol cara data waktu eksekusi ditampilkan. Anda dapat mengubah setelan default untuk kolom ini.
Klik Simpan.
Melihat batas dan penggunaan kuota
Di Cloud Monitoring, Anda dapat melihat metrik untuk penggunaan dan batas kuota:
Di konsol Google Cloud , buka halaman Monitoring.
Di panel navigasi, pilih
 Metrics explorer.
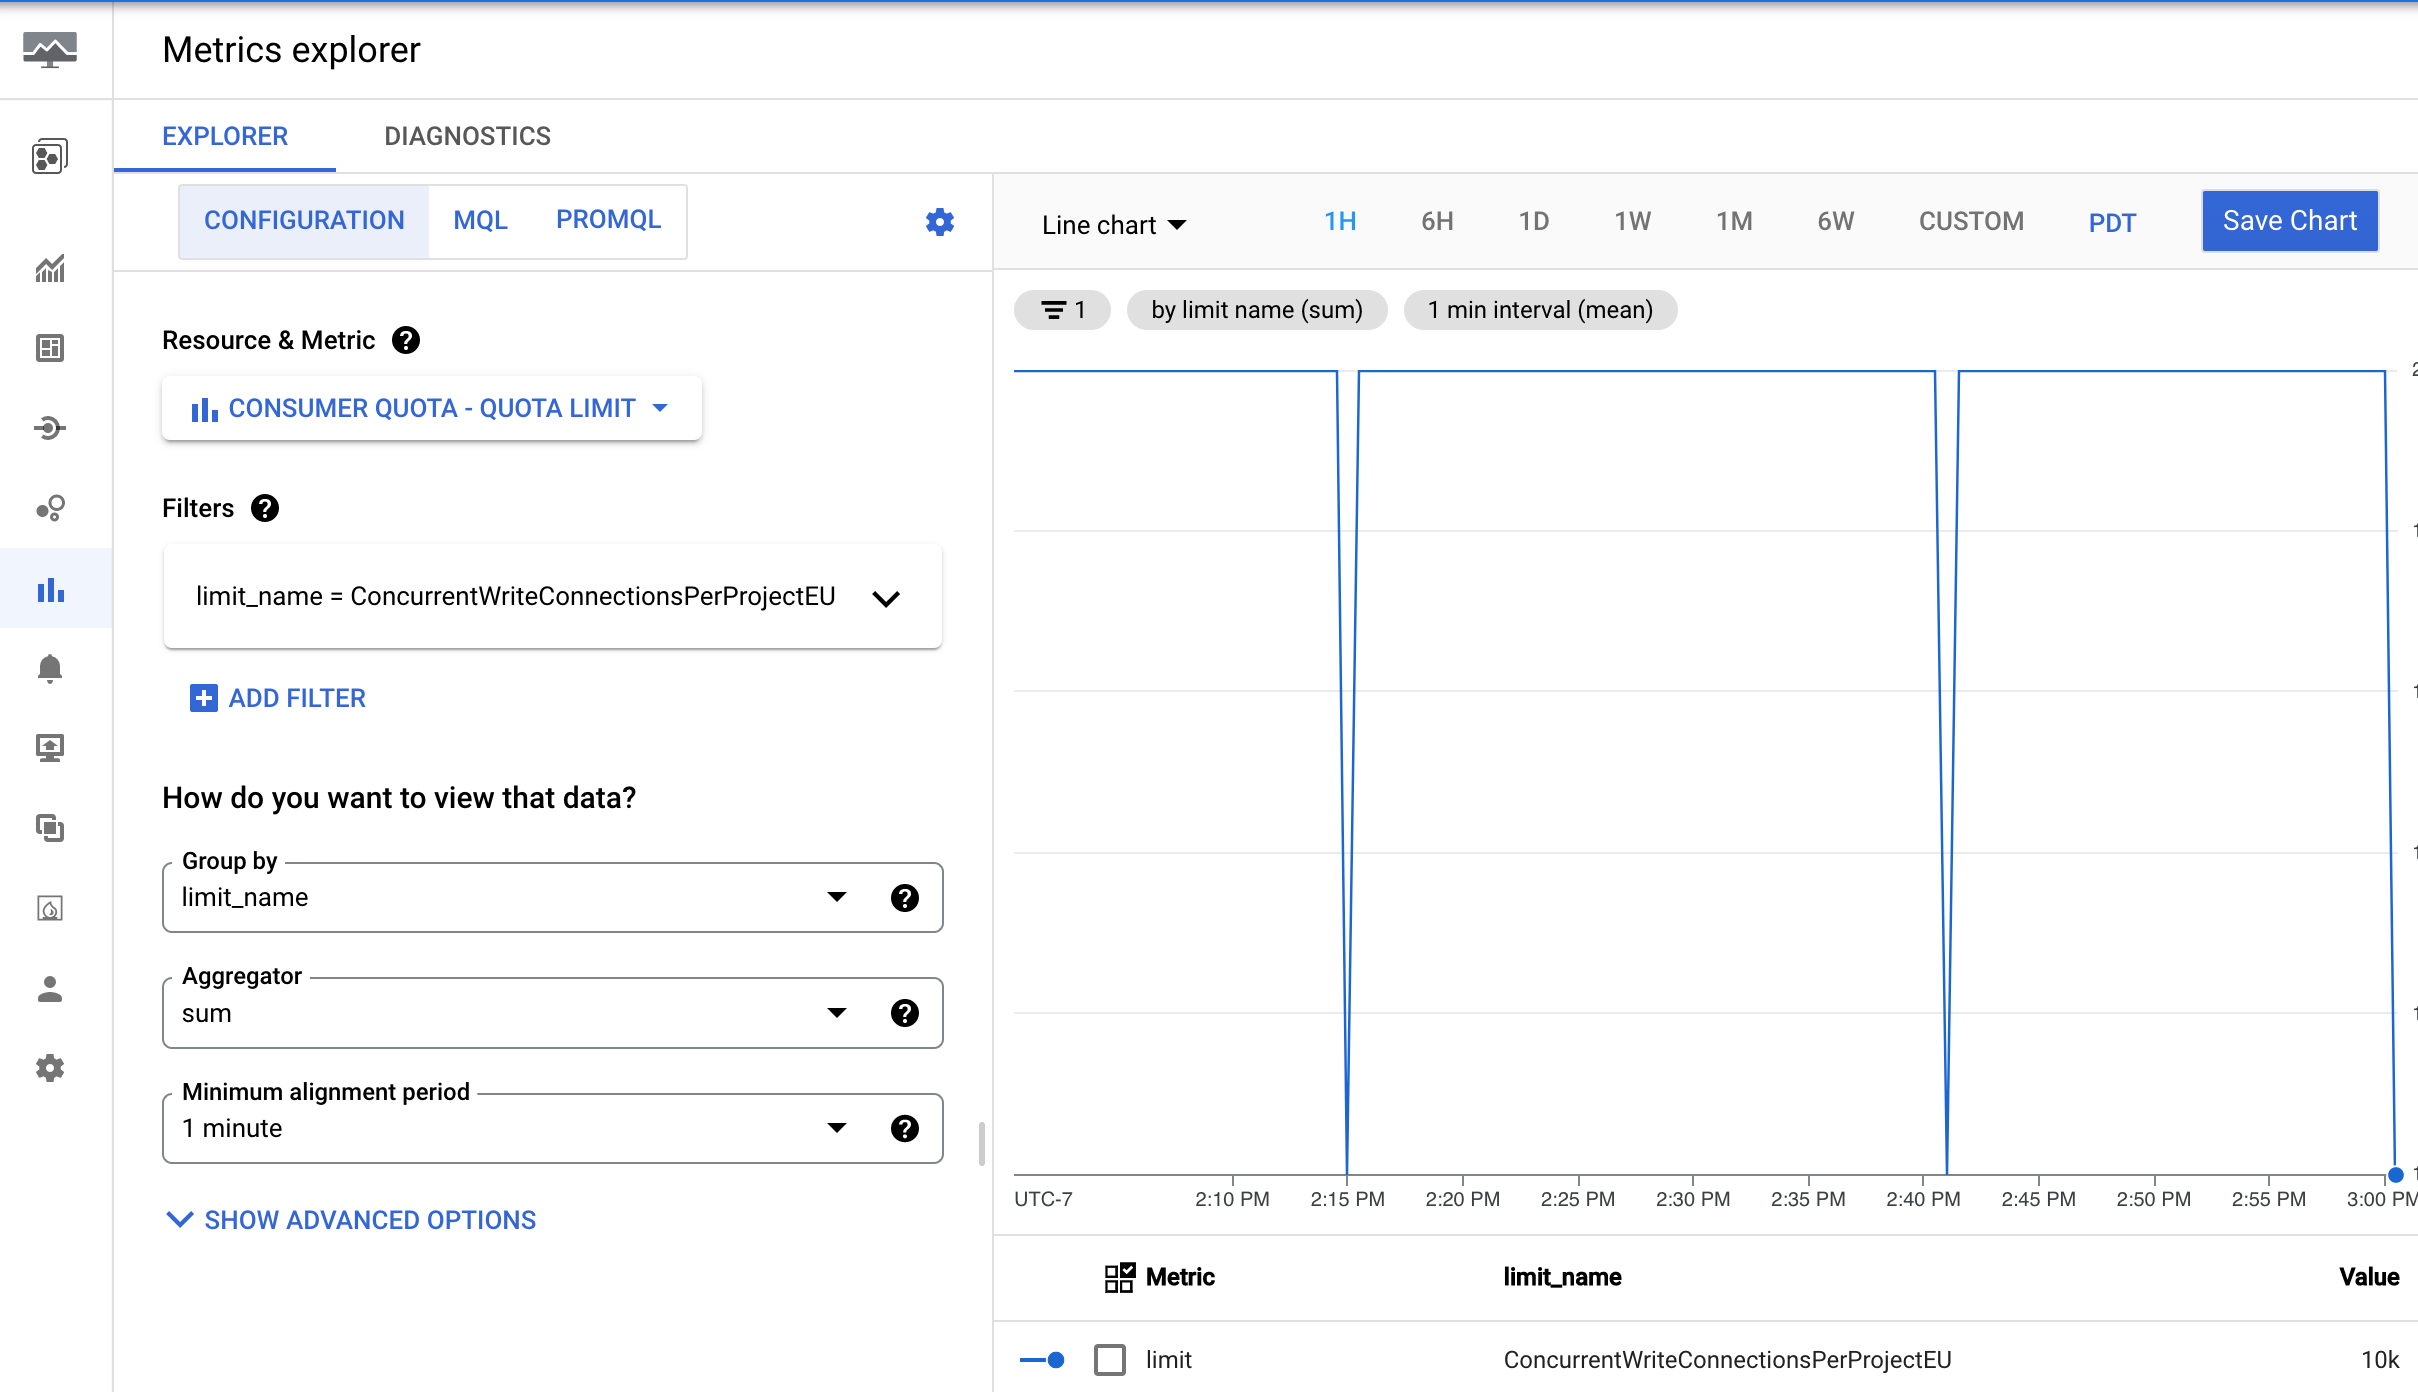
Di toolbar, pilih Explorer > Configuration.
Di bagian Resource & Metric, klik Select a metric.
Pilih Consumer Quota > Quota > Quota limit, lalu klik Apply.
Klik Add filter, lalu di menu Label, pilih limit_name.
Di menu Value, pilih kuota yang ingin Anda lihat metriknya.

Buat pemberitahuan
Untuk membuat kebijakan pemberitahuan yang terpicu saat persentil ke-99 waktu eksekusi kueri BigQuery melebihi batas yang ditentukan pengguna, gunakan setelan berikut.
| Kolom New condition |
Nilai |
|---|---|
| Resource and Metric | Di menu Resources, pilih BigQuery Project. Di menu Metric categories, pilih Query. Di menu Metrics, pilih Query execution times. |
| Filter | |
| Di seluruh deret waktu Mengelompokkan deret waktu menurut |
priority |
| Di seluruh deret waktu Agregasi deret waktu |
99th percentile |
| Rolling window | 5 m |
| Rolling window function | sum |
| Kolom Configure alert trigger |
Nilai |
|---|---|
| Condition type | Threshold |
| Alert trigger | Any time series violates |
| Threshold position | Above threshold |
| Threshold value | Anda menentukan nilai ini; namun, batas waktu yang disarankan adalah 60 detik. |
| Retest window | most recent value |
Untuk membuat kebijakan pemberitahuan yang terpicu saat total byte yang dipindai yang ditagih untuk project BigQuery melebihi batas yang ditentukan pengguna, gunakan konfigurasi kebijakan pemberitahuan berikut.
|
Kolom New condition |
Nilai |
|---|---|
| Resource and Metric |
Di menu Resources, pilih BigQuery Project. Di menu Metric categories, pilih Query. Di menu Metrics, pilih Statement scanned bytes billed. |
| Filter | (Tidak perlu filter untuk pemberitahuan di seluruh project) |
|
Di seluruh deret waktu Mengelompokkan deret waktu menurut |
(Biarkan kosong untuk menggabungkan semua deret) |
|
Di seluruh deret waktu Agregasi deret waktu |
sum |
| Rolling window |
5 m |
| Rolling window function |
sum
|
|
Kolom Configure alert trigger |
Nilai |
|---|---|
| Condition type |
Threshold
|
| Alert trigger |
Any time series violates
|
| Threshold position |
Above threshold
|
| Threshold value |
Anda menentukan nilai ini. Misalnya, untuk memicu pemberitahuan saat penggunaan melebihi
1 TiB, masukkan 1000000000000.
|
Meskipun kebijakan pemberitahuan memantau total byte yang dipindai, Anda dapat menetapkan nilai minimum berdasarkan anggaran tertentu. Untuk menerapkan kebijakan pemberitahuan berbasis anggaran ini, Anda harus mengonversi ambang batas biaya yang diinginkan menjadi jumlah byte yang setara terlebih dahulu. Formula ini mengandalkan harga komputasi on-demand BigQuery. Untuk mengetahui informasi selengkapnya, lihat Harga komputasi on demand.
Anda dapat menggunakan formula berikut untuk mengonversi nilai minimum biaya menjadi byte:
Threshold in Bytes = (Target Amount / (price per TiB)) * 1,000,000,000,000Contoh: Memicu pemberitahuan saat penggunaan melebihi $100
Misalnya, Anda ingin mendapatkan pemberitahuan saat biaya kueri project Anda melebihi $100.
- Hitung volume data yang setara dalam TiB:
$100 / (price per TiB) = Equivalent Data Volume in TiB - Mengonversi volume data ke byte:
(Equivalent Data Volume in TiB) * 1,000,000,000,000 = Threshold Value in Bytes - Tetapkan Nilai Threshold:
Di bagian Configure alert trigger pada kebijakan Anda, masukkan "Threshold Value in Bytes" sebagai Threshold value.
Sekarang, kebijakan pemberitahuan Anda akan dipicu saat total byte yang dipindai yang ditagih dalam periode berjalan sesuai dengan biaya kueri on-demand sekitar $100.
Metrik yang tersedia untuk visualisasi
Metrik berikut tersedia, waktu tertunda hingga beberapa jam.
| Jenis resource | Nama | Unit | Deskripsi |
|---|---|---|---|
| BigQuery | Scanned bytes |
Byte per menit | Jumlah byte yang dipindai. |
| BigQuery | Scanned bytes billed |
Byte per menit | Jumlah byte yang dikirim untuk penagihan saat menggunakan model analisis on demand. Byte yang dipindai dan byte yang dipindai yang ditagih dapat berbeda karena biaya dibulatkan, dengan jumlah minimum data yang diproses per kueri. |
| BigQuery | BI Engine Query Fallback Count (Preview) |
Kueri | Jumlah kueri yang tidak menggunakan BI Engine sebagai tarif. Anda dapat menetapkan opsi Group By ke reason untuk memisahkan jumlah menjadi alasan penggantian yang berbeda, termasuk:
|
| BigQuery | Query count |
Kueri | Kueri yang sedang berlangsung. |
| BigQuery | Query execution count (Preview) |
Kueri | Jumlah kueri yang dieksekusi. |
| BigQuery |
Query execution times
|
Detik | Waktu eksekusi kueri yang tidak di-cache. |
| BigQuery | Slots used by project |
Slot | Jumlah slot BigQuery yang dialokasikan untuk tugas kueri dalam project.
Slot dialokasikan per akun penagihan dan beberapa project dapat memiliki pemesanan slot yang sama. |
| BigQuery | Slots used by project and job type |
Slot | Jumlah slot yang dialokasikan untuk project setiap saat, dipisahkan menurut
jenis tugas.
Ini juga dapat dianggap sebagai jumlah slot yang digunakan oleh
project tersebut. Tugas pemuatan dan ekspor adalah operasi gratis, dan berjalan di kumpulan resource publik.
Slot dialokasikan per akun penagihan dan beberapa project dapat memiliki pemesanan slot yang sama. |
| BigQuery | Slots used by project, reservation, and job type |
Slot | Jumlah slot BigQuery yang dialokasikan untuk project. Alokasi slot dapat dikelompokkan berdasarkan pemesanan dan jenis tugas. |
| BigQuery | Total slots |
Slot | Jumlah total slot yang tersedia untuk project.
Jika project berbagi pemesanan slot dengan project lain, slot yang digunakan oleh project lain tidak akan digambarkan. |
| BigQuery | Slots used across projects in reservations |
Slot | Jumlah slot BigQuery yang dialokasikan di berbagai project dalam pemesanan. Perhatikan bahwa data metrik hanya dilaporkan saat setidaknya satu project telah ditetapkan ke pemesanan dan menggunakan slot. Sebagai alternatif, pertimbangkan untuk mengkueri informasi pemesanan dari INFORMATION_SCHEMA.
|
| BigQuery | Slots used by project in reservation |
Slot | Jumlah slot BigQuery yang dialokasikan untuk project di pemesanan. |
| Tugas berkelanjutan BigQuery | Estimated backlog logical bytes |
Byte | Jumlah byte dalam backlog untuk setiap tahap tugas berkelanjutan. |
| Tugas berkelanjutan BigQuery | Estimated backlog records |
Catatan | Estimasi jumlah catatan backlog untuk setiap tahap tugas berkelanjutan. |
| Tugas berkelanjutan BigQuery | Estimated bytes processed |
Byte | Estimasi jumlah byte yang diproses untuk setiap tahap tugas berkelanjutan. |
| Tugas berkelanjutan BigQuery | Output watermark |
Stempel waktu | Stempel waktu terbaru, dalam mikrodetik sejak epoch, hingga semua data telah diproses oleh tahap tugas berkelanjutan ini. |
| Tugas berkelanjutan BigQuery | Records read |
Catatan | Jumlah catatan input yang dibaca untuk setiap tahap tugas berkelanjutan. |
| Tugas berkelanjutan BigQuery | Records written |
Catatan | Jumlah catatan output yang ditulis untuk setiap tahap tugas berkelanjutan. |
| Tugas berkelanjutan BigQuery | Slots used |
Slot milidetik | Total slot milidetik yang digunakan oleh tugas berkelanjutan. |
| Set data BigQuery | Stored bytes |
Byte | Byte tersimpan dalam set data - Untuk 100 tabel terbesar dalam set data, byte yang disimpan akan ditampilkan untuk setiap tabel individu (berdasarkan nama). Setiap tabel tambahan dalam set data (di luar 100 tabel terbesar) dilaporkan sebagai jumlah tunggal, dan nama tabel untuk ringkasan adalah string kosong. |
| Set data BigQuery | Table count |
Tabel | Jumlah tabel dalam set data. |
| Set data BigQuery | Uploaded bytes |
Byte per menit | Jumlah byte yang diupload ke tabel mana pun dalam set data. |
| Set data BigQuery | Baris yang diupload | Baris per menit | Jumlah catatan yang diupload ke tabel mana pun dalam set data. |
Untuk mengetahui daftar lengkap metrik Google Cloud yang tersedia, lihat metrikGoogle Cloud .
Masalah umum
Jika tidak ada kueri yang berjalan, data tidak akan ditampilkan untuk slot yang dialokasikan, slot yang tersedia, atau variabel terkait kueri. Perkecil untuk melihat data.
Jika kueri berjalan di AS dan Uni Eropa, slot yang dialokasikan dan slot yang tersedia mungkin salah.
Slot yang dialokasikan dilaporkan sebagai nilai rata-rata dalam jangka waktu (lebar jangka waktu bergantung pada tingkat zoom diagram). Memperbesar dan memperkecil dapat mengubah nilai slot yang dialokasikan. Memperbesar ke jangka waktu 1 jam atau kurang akan menampilkan nilai sebenarnya dari slot yang dialokasikan. Pada rentang ini kapan pun terlihat pada diagram,
avg(slots allocated) = slots allocated.Data dalam diagram Cloud Monitoring hanya berkaitan dengan project yang dipilih.
Metrik adalah nilai seketika, yang diambil sampelnya pada waktu tertentu, dan mungkin melewatkan titik data di antara interval sampel. Misalnya, metrik jumlah tugas diambil sampelnya setiap menit. Nilainya adalah jumlah tugas pada waktu tertentu, bukan jumlah maksimum tugas selama satu menit.

