Set up alerts with scheduled queries
This document describes how to set up an alert using a BigQuery scheduled query. This approach supports custom use cases defined by query logic.
Before you begin
Before you use Cloud Monitoring, ensure that you have the following:
- A Cloud Billing account.
- A BigQuery project with billing enabled.
One way to ensure that you have both is to complete the Quickstart using the Google Cloud console.
Create a SQL query
Create and run a SQL query in BigQuery that generates the output for your alert. The query captures the logic that you want to monitor. For more information, see Run a query.
Set up a scheduled query
You can schedule queries to run on a recurring basis, from every 15 minutes to every several months. You can write any query over your log buckets. For more information, see Scheduling queries.
Understand the row count metric
Scheduled queries automatically create a metric in Cloud Monitoring. This metric records the number of rows that the SQL query returned during its last evaluation. You can create an alert policy that monitors this row count metric in Monitoring.
The following metric is a gauge that contains the most recent row count of a scheduled query:
bigquerydatatransfer.googleapis.com/transfer_config/last_execution_job_rows
All scheduled queries write their row count to this metric, using different labels. You need the config_id label when you define an alert policy. To find the config_id label, follow these steps:
In Google Cloud console, go to the Scheduled queries page:
Click the scheduled query for which you want to create an alert.
Go to the Details tab.
Check the last string in Resource name, as shown in the following screenshot:
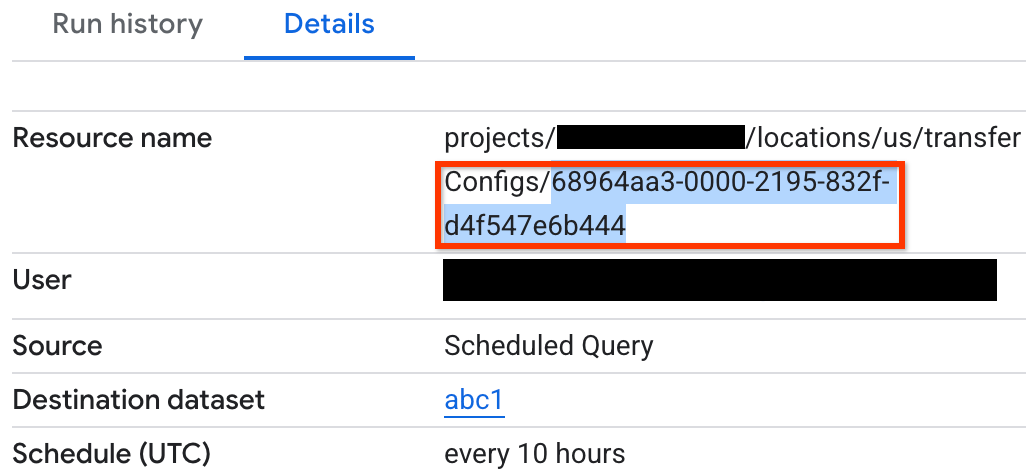
If a problem occurs with the scheduled query, an error message appears in the Run history tab of your scheduled query.
Monitor scheduled queries
Monitor scheduled queries to ensure successful executions:
- Look for errors in the Run history tab of the scheduled query.
- Check the final status of each scheduled execution that is stored in the
completion_statefield of thebigquerydatatransfer.googleapis.com/transfer_config/completed_runsmetric. - Look for errors in the BigQuery Data Transfer Service logs.
Create an alert policy
Use a metric-threshold alert to detect when the number of rows returned by the scheduled query differs from a threshold.
To set up an alert on the number of rows a scheduled query returns, follow these steps:
-
In the Google Cloud console, go to the notifications Alerting page:
If you use the search bar to find this page, then select the result whose subheading is Monitoring.
Click Create policy.
Select the row count metric for the scheduled query. In the Select a metric menu, click BigQuery DTS Config > Transfer_config > Last executed job row count.
In Add filters, click Add a filter.
In the Filter menu, select config_id.
In the Value menu, select the
config_idof the scheduled query for which you want to create an alert: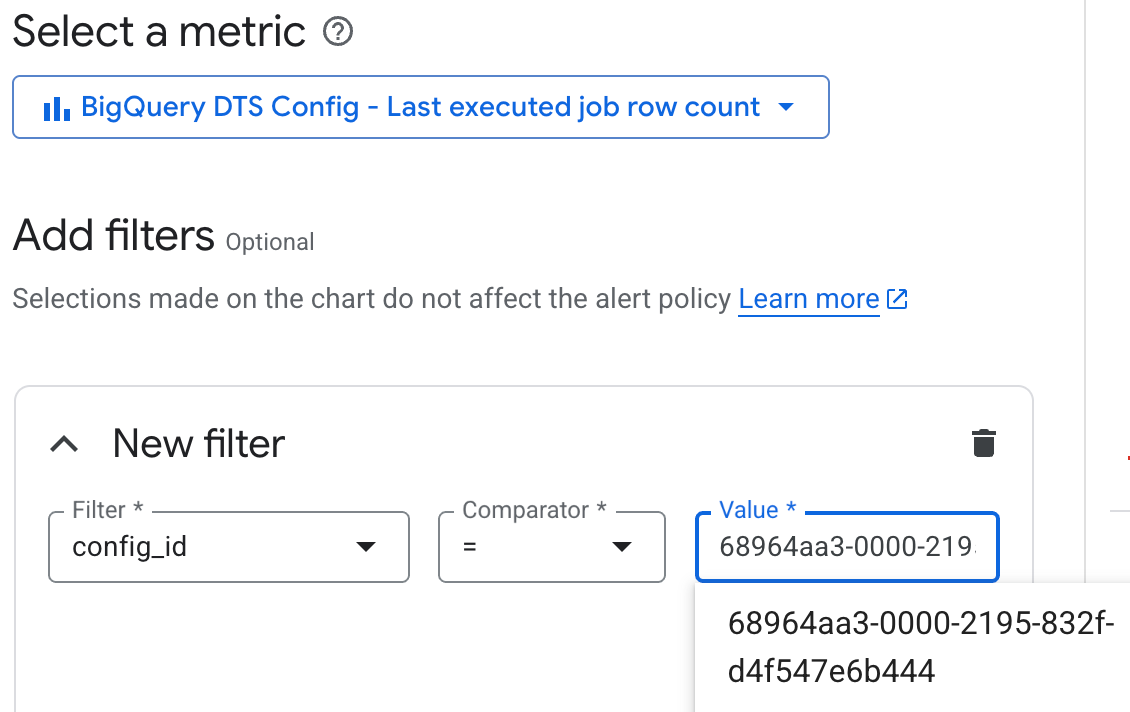
If you don't set a filter, your alert tests the output of every scheduled query. To find the
config_idof your scheduled query, see Understand the row count metric.Keep the default Transform data settings and click Next.
For Condition types, select Threshold.
Select the condition that you want. For example, to trigger when the query returns any rows, set the following condition:
- For Alert trigger, select Any time series violates.
- For Threshold position, select Above threshold.
- In Threshold value, enter
0.
Keep the default Advanced Options and click Next.
Optional: To configure notifications for your alert, click the Use notification channel toggle, and then set channels and subject line for your notifications. You can also set notifications for incident closure.
If you don't want notifications, deselect the Use notification channel toggle.
Optional: If you have many alert policies, you can annotate labels on them to indicate that they are derived from scheduled queries.
Optional: In the Documentation field, you can add links that help to interpret the alert. For example, you can add a link to the Logs Explorer page with a similar query, so that you can explore the data that raised the alert. You can also link to the specific schedule query's details page.
In Name the alert policy, enter a name for your alert.
Click Create Policy.
Limitations
Alert policies for scheduled queries are subject to the following limitations:
- Scheduled query execution frequency and ingestion delay impact the total time from log emission to alert. For example, if your query runs every 30 minutes and you add a 15-minute lag for ingestion delay, your alert fires approximately 15 minutes after an offending log entry is emitted. In some cases, it might take up to 45 minutes.
- The configuration between a scheduled query and an alert policy isn't linked or synchronized. Editing the configuration in one place might break the relationship that enables the alert function.
What's next
- Learn how to create and run scheduled queries.