This tutorial teaches you how to use the
AI.FORECAST function
with BigQuery ML's built-in
TimesFM univariate model to forecast the future value
for a given column, based on the historical value of that column.
This tutorial uses data from the public
bigquery-public-data.san_francisco_bikeshare.bikeshare_trips
table.
Objectives
This tutorial guides you through using the AI.FORECAST function with the built-in TimesFM model to forecast bike share trips. The first two sections cover how to forecast and visualize results for a single time series. The third section covers how to forecast for multiple time series.
Costs
This tutorial uses billable components of Google Cloud, including the following:
- BigQuery
- BigQuery ML
For more information about BigQuery costs, see the BigQuery pricing page.
For more information about BigQuery ML costs, see BigQuery ML pricing.
Before you begin
- Sign in to your Google Cloud account. If you're new to Google Cloud, create an account to evaluate how our products perform in real-world scenarios. New customers also get $300 in free credits to run, test, and deploy workloads.
-
In the Google Cloud console, on the project selector page, select or create a Google Cloud project.
Roles required to select or create a project
- Select a project: Selecting a project doesn't require a specific IAM role—you can select any project that you've been granted a role on.
-
Create a project: To create a project, you need the Project Creator
(
roles/resourcemanager.projectCreator), which contains theresourcemanager.projects.createpermission. Learn how to grant roles.
-
Verify that billing is enabled for your Google Cloud project.
-
In the Google Cloud console, on the project selector page, select or create a Google Cloud project.
Roles required to select or create a project
- Select a project: Selecting a project doesn't require a specific IAM role—you can select any project that you've been granted a role on.
-
Create a project: To create a project, you need the Project Creator
(
roles/resourcemanager.projectCreator), which contains theresourcemanager.projects.createpermission. Learn how to grant roles.
-
Verify that billing is enabled for your Google Cloud project.
- BigQuery is automatically enabled in new projects.
To activate BigQuery in a pre-existing project,
Enable the BigQuery API.
Roles required to enable APIs
To enable APIs, you need the Service Usage Admin IAM role (
roles/serviceusage.serviceUsageAdmin), which contains theserviceusage.services.enablepermission. Learn how to grant roles.
Forecast a single bike share trips time series
Forecast future time series values by using the AI.FORECAST
function.
The following query forecasts the number of subscriber bike share trips per
hour for the next month (approximately 720 hours), based on the previous four
months of historical data. The confidence_level argument indicates that the
query generates a prediction interval with a 95% confidence level.
Follow these steps to forecast data with the TimesFM model:
In the Google Cloud console, go to the BigQuery page.
In the query editor, paste in the following query and click Run:
SELECT *
FROM
  AI.FORECAST(
    (
      SELECT TIMESTAMP_TRUNC(start_date, HOUR) as trip_hour, COUNT(*) as num_trips
FROM `bigquery-public-data.san_francisco_bikeshare.bikeshare_trips`
WHERE subscriber_type = 'Subscriber' AND start_date >= TIMESTAMP('2018-01-01')
GROUP BY TIMESTAMP_TRUNC(start_date, HOUR)
    ),
    horizon => 720,
    confidence_level => 0.95,
    timestamp_col => 'trip_hour',
    data_col => 'num_trips');
The results look similar to the following:
+-------------------------+-------------------+------------------+---------------------------------+---------------------------------+--------------------+
| forecast_timestamp      | forecast_value    | confidence_level | prediction_interval_lower_bound | prediction_interval_upper_bound | ai_forecast_status |
+-------------------------+-------------------+------------------+---------------------------------+---------------------------------+--------------------+
| 2018-05-01 00:00:00 UTC | 26.3045959...     |            0.95  | 21.7088378...                   | 30.9003540...                   |                    |
+-------------------------+-------------------+------------------+---------------------------------+---------------------------------+--------------------+
| 2018-05-01 01:00:00 UTC | 34.0890502...     |            0.95  | 2.47682913...                   | 65.7012714...                   |                    |
+-------------------------+-------------------+------------------+---------------------------------+---------------------------------+--------------------+
| 2018-05-01 02:00:00 UTC | 24.2154693...     |            0.95  | 2.87621605...                   | 45.5547226...                   |                    |
+-------------------------+-------------------+------------------+---------------------------------+---------------------------------+--------------------+
| ...                     | ...               |  ...             | ...                             |  ...                            |                    |
+-------------------------+-------------------+------------------+---------------------------------+---------------------------------+--------------------+
Compare the forecasted data to the input data
Chart the AI.FORECAST function output alongside a subset of the function
input data to see how they compare.
Follow these steps to chart the function output:
In the Google Cloud console, go to the BigQuery page.
In the query editor, paste in the following query and click Run:
WITH historical AS (
SELECT TIMESTAMP_TRUNC(start_date, HOUR) as trip_hour, COUNT(*) as num_trips
FROM `bigquery-public-data.san_francisco_bikeshare.bikeshare_trips`
WHERE subscriber_type = 'Subscriber' AND start_date >= TIMESTAMP('2018-01-01')
GROUP BY TIMESTAMP_TRUNC(start_date, HOUR)
ORDER BY TIMESTAMP_TRUNC(start_date, HOUR)
)
SELECT *
FROM
(
(SELECT
    trip_hour as date,
    num_trips AS historical_value,
    NULL as forecast_value,
    'historical' as type,
    NULL as prediction_interval_lower_bound,
    NULL as prediction_interval_upper_bound
FROM
    historical
ORDER BY historical.trip_hour DESC
LIMIT 400)
UNION ALL
(SELECT forecast_timestamp AS date,
        NULL as historical_value,
        forecast_value as forecast_value,
        'forecast' as type,
        prediction_interval_lower_bound,
        prediction_interval_upper_bound
FROM
    AI.FORECAST(
    (
    SELECT * FROM historical
    ),
    horizon => 720,
    confidence_level => 0.99,
    timestamp_col => 'trip_hour',
    data_col => 'num_trips')))
ORDER BY date asc;
When the query is finished running, click the Visualization tab in the Query results pane. The resulting chart looks similar to the following:
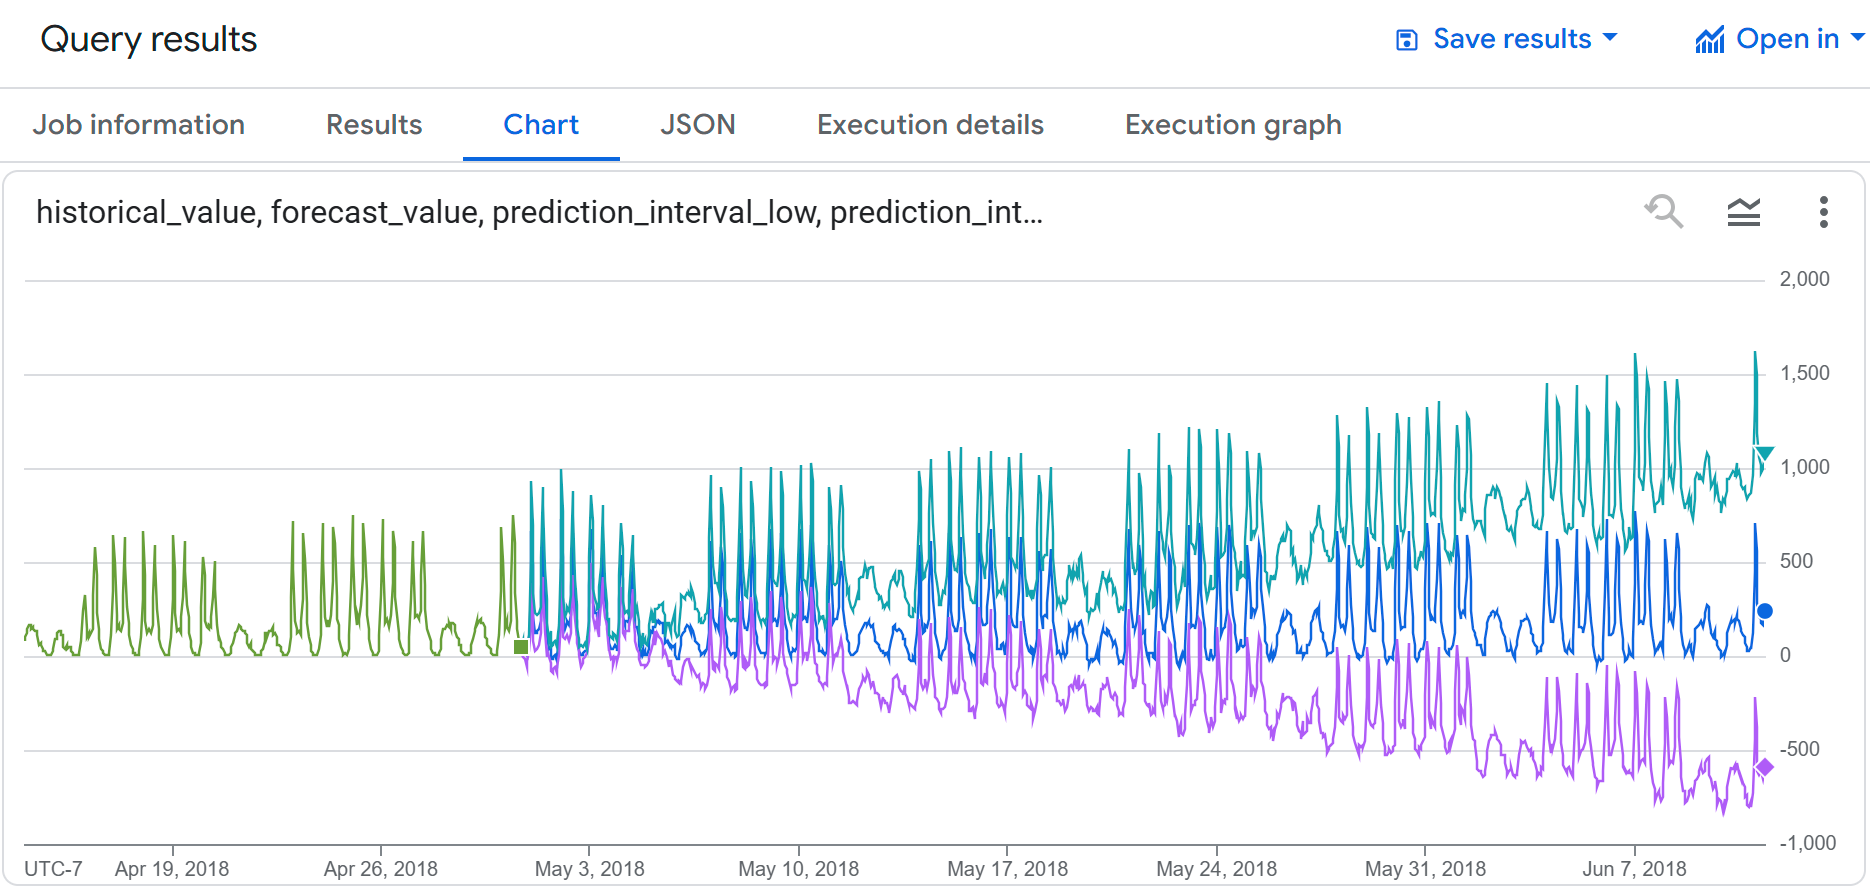
You can see that the input data and the forecasted data show similar bike share usage. You can also see that the prediction interval lower and upper bounds increase as the forecasted time points get further into the future.
Forecast multiple bike share trips time series
The following query forecasts the number of bike share trips per subscriber type
and per hour for the next month (approximately 720 hours), based on the previous four
months of historical data. The confidence_level argument indicates that the
query generates a prediction interval with a 95% confidence level.
Follow these steps to forecast data with the TimesFM model:
In the Google Cloud console, go to the BigQuery page.
In the query editor, paste in the following query and click Run:
SELECT *
FROM
  AI.FORECAST(
    (
      SELECT TIMESTAMP_TRUNC(start_date, HOUR) as trip_hour, subscriber_type, COUNT(*) as num_trips
      FROM `bigquery-public-data.san_francisco_bikeshare.bikeshare_trips`
      WHERE start_date >= TIMESTAMP('2018-01-01')
      GROUP BY TIMESTAMP_TRUNC(start_date, HOUR), subscriber_type
    ),
    horizon => 720,
    confidence_level => 0.95,
    timestamp_col => 'trip_hour',
    data_col => 'num_trips',
    id_cols => ['subscriber_type']);
The results look similar to the following:
+---------------------+--------------------------+------------------+------------------+---------------------------------+---------------------------------+--------------------+
| subscriber_type     | forecast_timestamp       | forecast_value   | confidence_level | prediction_interval_lower_bound | prediction_interval_upper_bound | ai_forecast_status |
+---------------------+--------------------------+------------------+------------------+---------------------------------+---------------------------------+--------------------+
| Subscriber          | 2018-05-01 00:00:00 UTC  | 26.3045959...    |            0.95  | 21.7088378...                   | 30.9003540...                   |                    |
+---------------------+--------------------------+------------------+------------------+---------------------------------+---------------------------------+--------------------+
| Subscriber          |  2018-05-01 01:00:00 UTC | 34.0890502...    |            0.95  | 2.47682913...                   | 65.7012714...                   |                    |
+---------------------+-------------------+------------------+-------------------------+---------------------------------+---------------------------------+--------------------+
| Subscriber          |  2018-05-01 02:00:00 UTC | 24.2154693...    |            0.95  | 2.87621605...                   | 45.5547226...                   |                    |
+---------------------+--------------------------+------------------+------------------+---------------------------------+---------------------------------+--------------------+
| ...                 | ...                      |  ...             | ...              | ...                             |  ...                            |                    |
+---------------------+--------------------------+------------------+------------------+---------------------------------+---------------------------------+--------------------+
Clean up
To avoid incurring charges to your Google Cloud account for the resources used in this tutorial, either delete the project that contains the resources, or keep the project and delete the individual resources.
Delete your project
To delete the project:
- In the Google Cloud console, go to the Manage resources page.
- In the project list, select the project that you want to delete, and then click Delete.
- In the dialog, type the project ID, and then click Shut down to delete the project.
What's next
- For an overview of BigQuery ML, see Introduction to AI and ML in BigQuery.