Use raster data to analyze temperature
This tutorial describes how to perform geospatial analysis on raster data.
Objectives
- Find publicly available Google Earth Engine data in BigQuery sharing (formerly Analytics Hub).
- Use the
ST_REGIONSTATSfunction to calculate the average temperature in each country at a point in time. - Visualize your results in BigQuery Geo Viz, which is a web tool for visualization of geospatial data in BigQuery using Google Maps APIs.
Costs
In this tutorial, you use the following billable components of Google Cloud:
Before you begin
We recommend that you create a Google Cloud project for this tutorial. Make sure that you have the required roles to complete this tutorial.
Set up a Google Cloud project
- Sign in to your Google Cloud account. If you're new to Google Cloud, create an account to evaluate how our products perform in real-world scenarios. New customers also get $300 in free credits to run, test, and deploy workloads.
-
In the Google Cloud console, on the project selector page, select or create a Google Cloud project.
Roles required to select or create a project
- Select a project: Selecting a project doesn't require a specific IAM role—you can select any project that you've been granted a role on.
-
Create a project: To create a project, you need the Project Creator
(
roles/resourcemanager.projectCreator), which contains theresourcemanager.projects.createpermission. Learn how to grant roles.
-
Verify that billing is enabled for your Google Cloud project.
-
Enable the BigQuery, BigQuery sharing, and Google Earth Engine APIs.
Roles required to enable APIs
To enable APIs, you need the Service Usage Admin IAM role (
roles/serviceusage.serviceUsageAdmin), which contains theserviceusage.services.enablepermission. Learn how to grant roles. -
In the Google Cloud console, on the project selector page, select or create a Google Cloud project.
Roles required to select or create a project
- Select a project: Selecting a project doesn't require a specific IAM role—you can select any project that you've been granted a role on.
-
Create a project: To create a project, you need the Project Creator
(
roles/resourcemanager.projectCreator), which contains theresourcemanager.projects.createpermission. Learn how to grant roles.
-
Verify that billing is enabled for your Google Cloud project.
-
Enable the BigQuery, BigQuery sharing, and Google Earth Engine APIs.
Roles required to enable APIs
To enable APIs, you need the Service Usage Admin IAM role (
roles/serviceusage.serviceUsageAdmin), which contains theserviceusage.services.enablepermission. Learn how to grant roles.
Required roles
To get the permissions that you need to perform the tasks in this tutorial, ask your administrator to grant you the following IAM roles on your project:
-
Earth Engine Resource Viewer (
roles/earthengine.viewer) -
Service Usage Consumer (
roles/serviceusage.serviceUsageConsumer) -
BigQuery Data Editor (
roles/bigquery.dataEditor)
For more information about granting roles, see Manage access to projects, folders, and organizations.
These predefined roles contain the permissions required to perform the tasks in this tutorial. To see the exact permissions that are required, expand the Required permissions section:
Required permissions
The following permissions are required to perform the tasks in this tutorial:
-
earthengine.computations.create -
serviceusage.services.use -
bigquery.datasets.create
You might also be able to get these permissions with custom roles or other predefined roles.
Subscribe to a dataset
To find the dataset used for this tutorial, follow these steps:
Go to the Sharing (Analytics Hub) page.
Click Search listings.
In the Search for listings field, enter
"ERA5-Land Daily Aggregated".Click the result. A details pane opens with information about the ERA5-Land climate reanalysis dataset, including a description, a link to band information, the availability, the pixel size, and the terms of use.
Click Subscribe.
Optional: Update the Project.
Update the Linked dataset name to
era5_climate_tutorial.Click Save. The linked dataset is added to your project and contains a single table called
climate.
Find the raster ID
Each row in the era5_climate_tutorial.climate table contains metadata for a
raster image that has climate data for a particular day. Run the following query
to extract the raster ID of the raster image for January 1, 2025:
SELECT
  assets.image.href
FROM
  `era5_climate_tutorial.climate`
WHERE
  properties.start_datetime = '2025-01-01';
The result is ee://ECMWF/ERA5_LAND/DAILY_AGGR/20250101. In the next section,
you use this for the raster_id argument to the ST_REGIONSTATS function.
Compute the average temperature
Run the following query to compute the average temperature of each country
on January 1, 2025 using the
ST_REGIONSTATS function:
WITH SimplifiedCountries AS (
  SELECT
    ST_SIMPLIFY(geometry, 10000) AS simplified_geometry,
    names.primary AS name
  FROM
    `bigquery-public-data.overture_maps.division_area`
  WHERE
    subtype = 'country'
)
SELECT
  sc.simplified_geometry AS geometry,
  sc.name,
  ST_REGIONSTATS(
    sc.simplified_geometry,
    'ee://ECMWF/ERA5_LAND/DAILY_AGGR/20250101',
    'temperature_2m'
  ).mean - 273.15 AS mean_temperature
FROM
  SimplifiedCountries AS sc
ORDER BY
  mean_temperature DESC;
This query runs on the publicly available division_area table that contains
GEOGRAPHY values representing the boundaries of various regions on Earth,
including countries. The ST_REGIONSTATS function uses the temerature_2m
band of the raster image, which contains the temperature of the air at 2 meters
above the surface of the land at the given pixel.
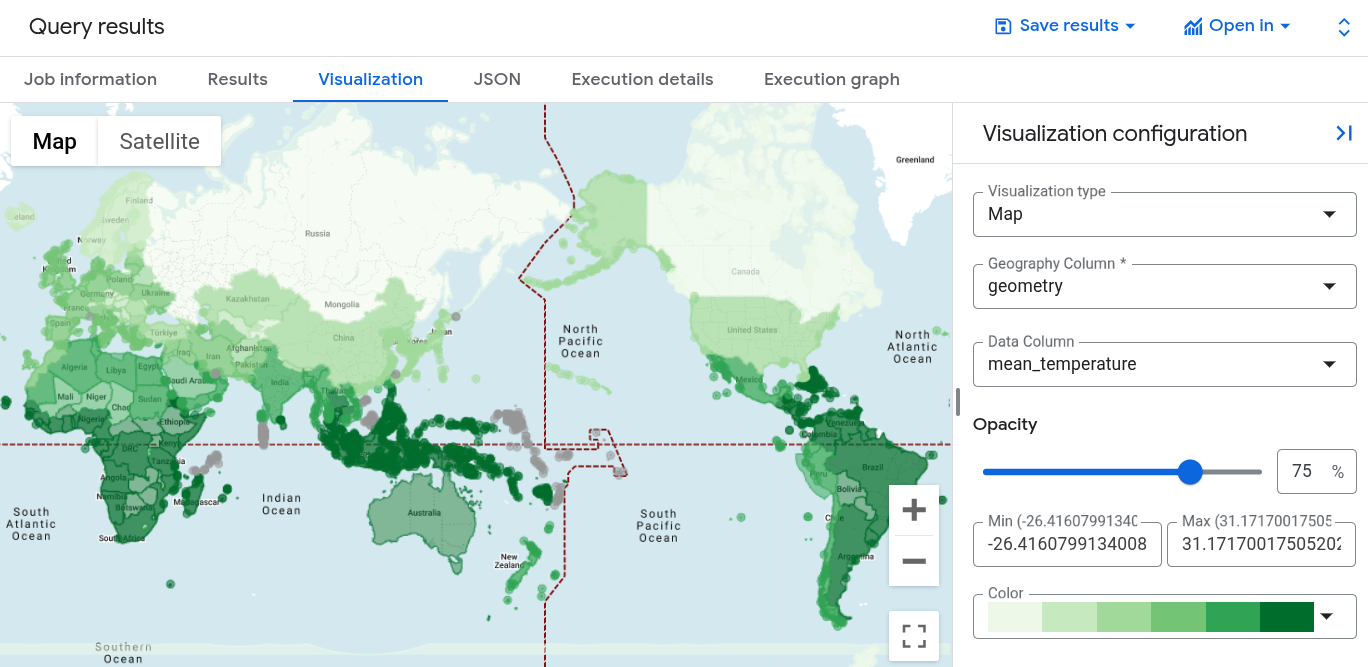
Visualize the query results in BigQuery
To visualize your results in BigQuery, follow these steps:
In the Query results pane, click the Visualization tab.
For Data column, select
mean_temperature.A world map appears, styled by a color gradient for the average temperature of each country.

Visualize the query results in Geo Viz
You can also visualize your results using BigQuery Geo Viz.
Launch Geo Viz and authenticate
Before using Geo Viz, you must authenticate and grant access to data in BigQuery.
To set up Geo Viz, do the following:
Open the Geo Viz web tool.
Alternatively, in the Query results pane, click Open in > GeoViz.
In step one, Query, click Authorize.
In the Choose an account dialog, click your Google Account.
In the access dialog, click Allow to give Geo Viz access to your BigQuery data.
Run your query in Geo Viz
After you authenticate and grant access, the next step is to run the query in Geo Viz.
To run the query, do the following:
For step one, Select data, enter your project ID in the Project ID field.
In the query window, enter the following GoogleSQL query. If you opened Geo Viz from your query results, this field is already populated with your query.
WITH SimplifiedCountries AS (
  SELECT
    ST_SIMPLIFY(geometry, 10000) AS simplified_geometry,
    names.primary AS name
  FROM
    `bigquery-public-data.overture_maps.division_area`
  WHERE
    subtype = 'country'
)
SELECT
  sc.simplified_geometry AS geometry,
  sc.name,
  ST_REGIONSTATS(
    sc.simplified_geometry,
    'ee://ECMWF/ERA5_LAND/DAILY_AGGR/20250101',
    'temperature_2m'
  ).mean - 273.15 AS mean_temperature
FROM
  SimplifiedCountries AS sc
ORDER BY
  mean_temperature DESC;
Click Run.
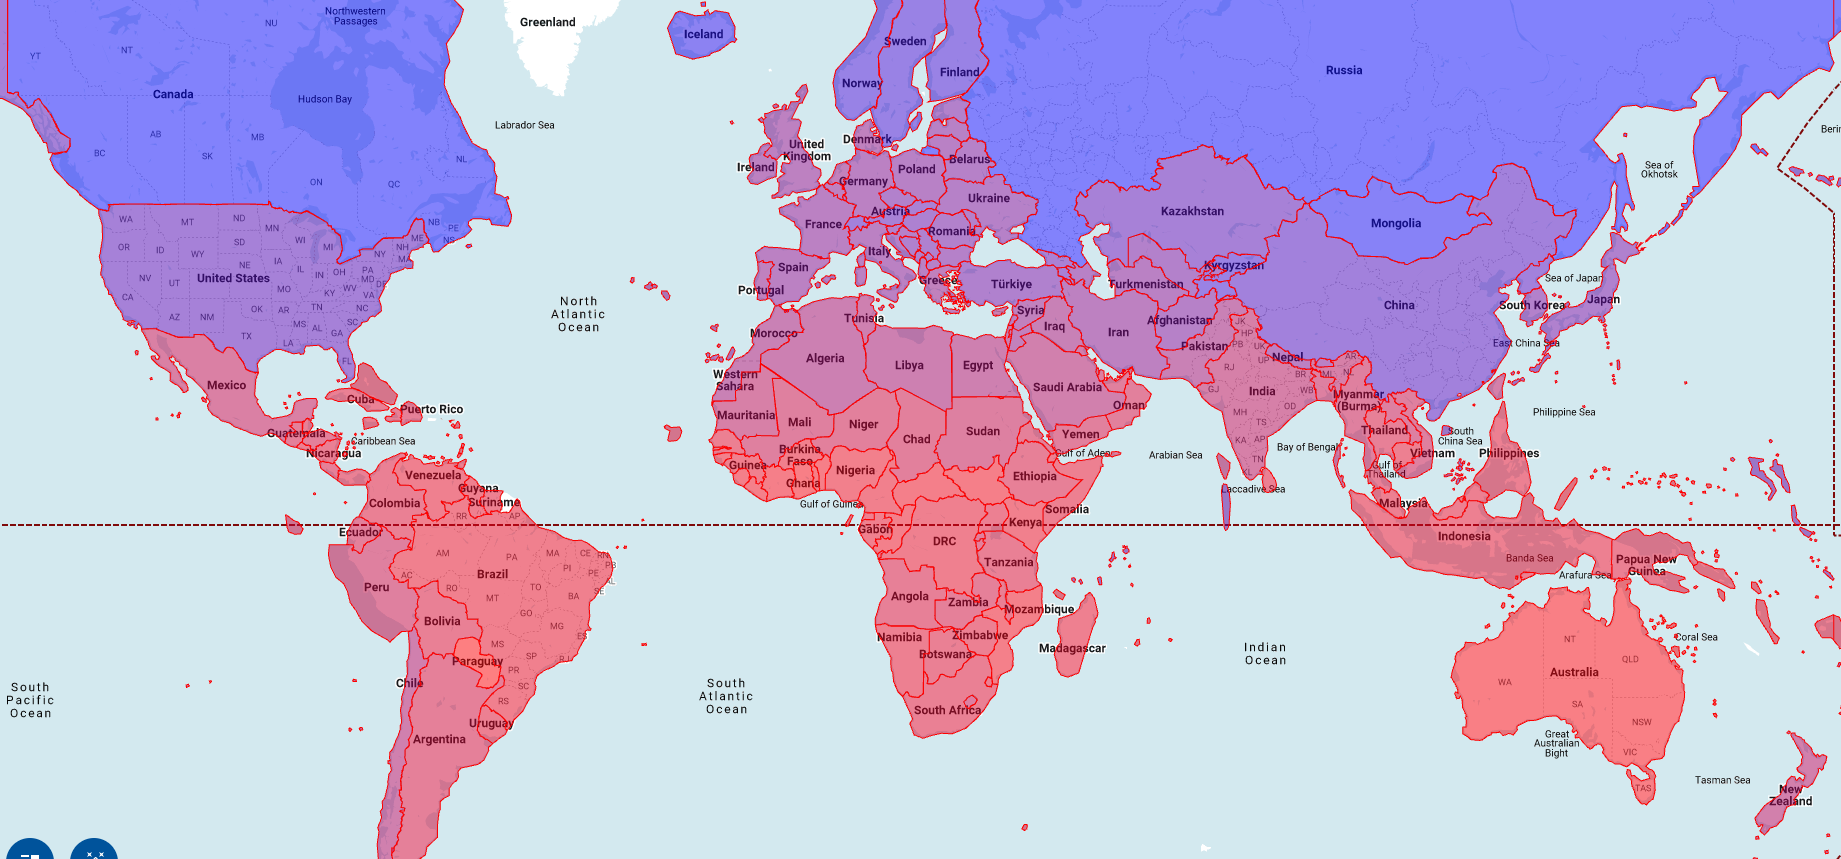
Apply styles
The Style section provides a list of visual styles for customization. For more information about each style, see Format your visualization.
To format your map, do the following:
To open the fillColor panel, click step 3, Style.
Click the Data-driven toggle to the on position.
For Function, choose linear.
For Field, choose
mean_temperature.For Domain, enter
-20in the first box and32in the second box.For Range, click the first box and enter
#0006ffin the Hex box, and then click the second box and enter#ff0000. This changes the color of each country based on its average temperature on January 1, 2025. Blue indicates a colder temperature and red indicates a warmer temperature.Click fillOpacity.
In the Value field, enter
.5.Click Apply style.
Examine your map. If you click a country, the country's name, average temperature, and simplified geometry are displayed.

Clean up
- In the Google Cloud console, go to the Manage resources page.
- In the project list, select the project that you want to delete, and then click Delete.
- In the dialog, type the project ID, and then click Shut down to delete the project.
What's next
- To learn more about how to visualize options for geospatial analytics, see Visualizing geospatial data.
- To work with raster data, see Work with raster data.
- To learn more about the geography functions you can use in geospatial analytics, see Geography functions in GoogleSQL.
