Looker Studio adalah layanan pelaporan dan visualisasi data mandiri
tanpa biaya dari Google Marketing Platform yang terhubung ke BigQuery
dan ratusan sumber data lainnya. Layanan ini mencakup dukungan untuk berbagai
jenis kolom geografis
dan peta koroplet dari
poligon GEOGRAPHY BigQuery. Dengan
visualisasi berbasis Google Maps,
Anda dapat memvisualisasikan dan berinteraksi dengan data geografis seperti yang Anda lakukan dengan
Google Maps: menggeser, memperbesar, dan membuka Street View.
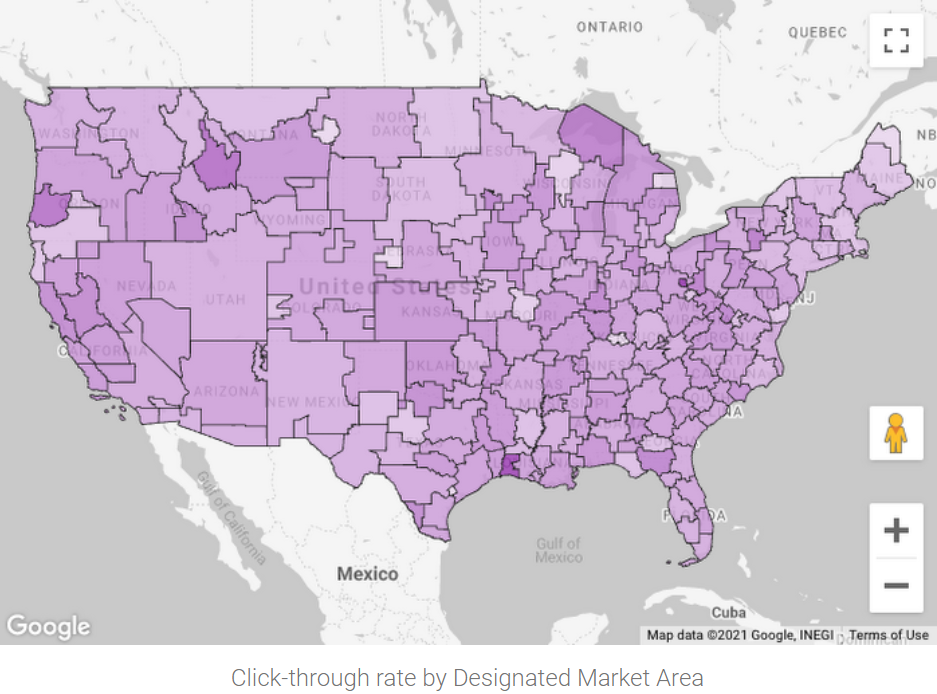
BigQuery Geo Viz adalah alat web untuk visualisasi data
geospasial di BigQuery menggunakan Google Maps API. Anda dapat menjalankan Kueri SQL
dan menampilkan hasilnya di peta interaktif. Fitur gaya visual yang fleksibel memungkinkan
Anda menganalisis dan menjelajahi data.
BigQuery Geo Viz bukanlah alat visualisasi analisis geospasial
berfitur lengkap. Geo Viz adalah cara mudah untuk memvisualisasikan hasil
kueri analisis geospasial pada peta, dengan satu kueri dalam satu waktu.
Untuk melihat contoh penggunaan Geo Viz dalam memvisualisasikan data geospasial, lihat Memulai analisis geospasial.
Geo Viz mendukung input geometri (titik, garis, dan poligon) yang
diambil sebagai kolom GEOGRAPHY. Anda dapat menggunakan fungsi
geografis BigQuery untuk mengonversi lintang dan bujur menjadi GEOGRAPHY.
Jumlah hasil yang dapat ditampilkan Geo Viz pada peta dibatasi oleh memori
browser. Anda dapat menurunkan resolusi dan mengurangi ukuran data
geospasial yang ditampilkan dari kueri menggunakan fungsi ST_Simplify.
Analisis interaktif secara real-time ditangani secara lokal oleh browser Anda
dan bergantung pada kemampuan browser.
Geo Viz hanya mendukung berbagi visualisasi dengan pengguna yang diberi otorisasi untuk menjalankan
kueri di project BigQuery yang sama.
Geo Viz tidak mendukung download visualisasi untuk pengeditan offline.
Notebook Colab
Anda juga dapat melakukan visualisasi geospasial di notebook
Colab. Untuk tutorial tentang cara membuat notebook Colab untuk memvisualisasikan data, lihat Visualisasi geospasial BigQuery di Colab.
Anda juga dapat memvisualisasikan data geospasial menggunakan Google Earth Engine. Untuk menggunakan Google Earth Engine, ekspor data BigQuery ke Cloud Storage, lalu impor ke Google Earth Engine. Anda dapat menggunakan alat Google Earth Engine
untuk memvisualisasikan data.
Untuk informasi lebih lanjut tentang cara menggunakan Google Earth Engine, lihat:
[[["Mudah dipahami","easyToUnderstand","thumb-up"],["Memecahkan masalah saya","solvedMyProblem","thumb-up"],["Lainnya","otherUp","thumb-up"]],[["Sulit dipahami","hardToUnderstand","thumb-down"],["Informasi atau kode contoh salah","incorrectInformationOrSampleCode","thumb-down"],["Informasi/contoh yang saya butuhkan tidak ada","missingTheInformationSamplesINeed","thumb-down"],["Masalah terjemahan","translationIssue","thumb-down"],["Lainnya","otherDown","thumb-down"]],["Terakhir diperbarui pada 2025-08-25 UTC."],[[["\u003cp\u003eGeospatial analytics allows for the visualization of geographic location data through various tools.\u003c/p\u003e\n"],["\u003cp\u003eLooker Studio offers a no-cost, self-serve reporting and data visualization service with features like geographic field types, choropleth maps, and Google Maps-based visualization.\u003c/p\u003e\n"],["\u003cp\u003eBigQuery Geo Viz is a lightweight web tool that enables the visualization of geospatial data from BigQuery via interactive maps but is limited in terms of real-time analysis and supported inputs.\u003c/p\u003e\n"],["\u003cp\u003eGoogle Earth Engine provides another avenue for visualizing geospatial data by exporting data to Cloud Storage and using the Earth Engine's tools.\u003c/p\u003e\n"],["\u003cp\u003eJupyter notebooks, with the GeoJSON extension, can be utilized for visualizing geospatial data in GeoJSON format.\u003c/p\u003e\n"]]],[],null,["# Visualize geospatial data\n=========================\n\nGeospatial analytics lets you visualize geographic location data by\nusing the following:\n\n- [BigQuery Studio](#bigquery_studio)\n- [Looker Studio](#data_studio)\n- [BigQuery Geo Viz](#geo_viz)\n- [Colab notebooks](#colab)\n- [Google Earth Engine](#google_earth)\n\nBigQuery Studio\n---------------\n\n|\n| **Preview**\n|\n|\n| This feature is subject to the \"Pre-GA Offerings Terms\" in the General Service Terms section\n| of the [Service Specific Terms](/terms/service-terms#1).\n|\n| Pre-GA features are available \"as is\" and might have limited support.\n|\n| For more information, see the\n| [launch stage descriptions](/products#product-launch-stages).\n| **Note:** To request support or provide feedback for this feature, email [bigquery-earthengine-preview-support@google.com](mailto:bigquery-earthengine-preview-support@google.com).\n\nBigQuery Studio offers an integrated geography data viewer. When your query\nresults contain one or more `GEOGRAPHY` type columns, you can view the results\nin an interactive map.\nTo view the map, in the **Query results** pane, click the **Visualization** tab.\n\nVisualization in BigQuery is ideal for quick inspections and\niterative query development. You can visually confirm data alignment with\nexpectations, identify outliers, and assess the correctness of your spatial\ndata. It's also useful for ad hoc analysis to explore results and derive\nimmediate conclusions from geospatial queries.\n\nTo see an example of how to use the integrated geography viewer, see\n[Get started with geospatial analytics](/bigquery/docs/geospatial-get-started).\n\n### BigQuery Studio limitations\n\n- You can only visualize one `GEOGRAPHY` column at a time.\n- Performance is subject to browser capabilities and isn't intended for rendering extremely large or complex datasets. BigQuery renders up to approximately one million vertices, 20,000 rows, or 128 MB of results.\n\nLooker Studio\n-------------\n\nLooker Studio is a no-cost, self-serve reporting and data visualization\nservice from Google Marketing Platform that connects to BigQuery\nand hundreds of other data sources. The service includes support for a variety\nof [geographic field types](https://support.google.com/looker-studio/answer/9843174)\nand [choropleth maps](https://en.wikipedia.org/wiki/Choropleth_map) of\nBigQuery `GEOGRAPHY` polygons. With\n[Google Maps-based visualization](https://support.google.com/looker-studio/answer/9713352),\nyou can visualize and interact with your geographic data just as you do with\nGoogle Maps: pan around, zoom in, and pop into Street View.\n\nFor a walkthrough of geospatial analytics in Looker Studio, see\n[Visualize BigQuery `GEOGRAPHY` polygons with Looker Studio](https://support.google.com/looker-studio/answer/10502383).\n\nBigQuery Geo Viz\n----------------\n\nBigQuery Geo Viz is a web tool for visualization of geospatial\ndata in BigQuery using Google Maps APIs. You can run a SQL query\nand display the results on an interactive map. Flexible styling features let\nyou analyze and explore your data.\n\nBigQuery Geo Viz is not a fully featured geospatial analytics\nvisualization tool. Geo Viz is a lightweight way to visualize the results of a\ngeospatial analytics query on a map, one query at a time.\n\nTo see an example of using Geo Viz to visualize geospatial data, see\n[Get started with geospatial analytics](/bigquery/docs/geospatial-get-started).\n\nTo explore Geo Viz, go to the Geo Viz web tool:\n\n[Go to Geo Viz](https://bigquerygeoviz.appspot.com/)\n\n### Geo Viz limitations\n\n- Geo Viz supports geometry inputs (points, lines, and polygons) that are retrieved as a `GEOGRAPHY` column. You can use BigQuery's geography functions to convert latitude and longitude to `GEOGRAPHY`.\n- The number of results that Geo Viz can display on a map is limited by browser memory. You can lower the resolution and reduce size of geospatial data returned from the query by using `ST_Simplify` function.\n- Real-time, interactive analysis is handled locally by your browser and is subject to your browser's capabilities.\n- Geo Viz supports sharing visualizations only with users authorized to execute queries in the same BigQuery project.\n- Geo Viz does not support downloading a visualization for offline editing.\n\nColab notebooks\n---------------\n\nYou can also perform geospatial visualizations in Colab\nnotebooks. For a tutorial on building a Colab notebook to\nvisualize data, see [BigQuery geospatial visualization in Colab](/bigquery/docs/geospatial-visualize-colab).\n\nTo view and run a prebuilt notebook, see [BigQuery geospatial visualization in Colab](https://github.com/GoogleCloudPlatform/bigquery-utils/blob/master/notebooks/bigquery_geospatial_visualization.ipynb) in GitHub.\n\nGoogle Earth Engine\n-------------------\n\nYou can also visualize geospatial data using Google Earth Engine. To use\nGoogle Earth Engine, export your BigQuery data to Cloud Storage\nand then import it into Google Earth Engine. You can use the Google Earth Engine tools\nto visualize your data.\n\nFor more information on using Google Earth Engine, see the:\n\n- [Google Earth Engine developer's guide](https://developers.google.com/earth-engine/)\n- [Google Earth Engine API tutorials](https://developers.google.com/earth-engine/tutorials)"]]