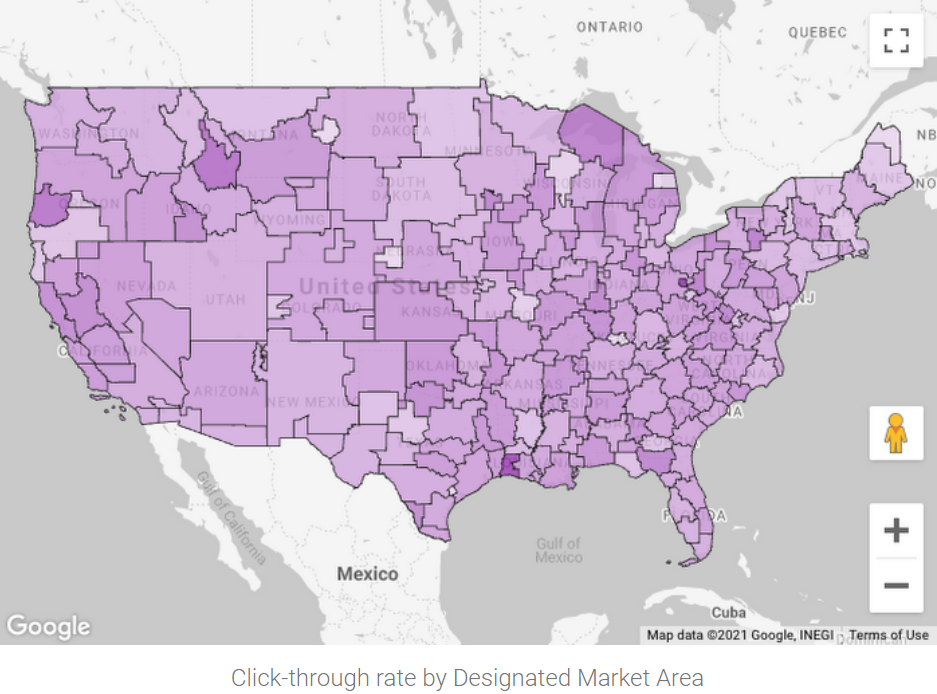
Looker Studio ist ein kostenloser Selfservice-Berichterstellungs- und Datenvisualisierungsdienst der Google Marketing Platform, der mit BigQuery und Hunderten von anderen Datenquellen verbunden ist. Der Dienst unterstützt eine Vielzahl von geografischen Feldtypen und Choroplethenkarten von BigQuery GEOGRAPHY-Polygonen. Die Google Maps-basierte Visualisierung ermöglicht Ihnen die Visualisierung und Interaktion mit Ihren geografischen Daten wie bei Google Maps: Schwenken, Heranzoomen, sogar das Aufrufen von Street View.
BigQuery Geo Viz ist ein Webtool zur Visualisierung von raumbezogenen Daten in BigQuery mithilfe von Google Maps APIs. Sie können eine SQL-Abfrage ausführen und die Ergebnisse auf einer interaktiven Karte anzeigen. Mit flexiblen Stilfunktionen können Sie Ihre Daten analysieren und untersuchen.
Das raumbezogene Visualisierungstool BigQuery Geo Viz hat keinen vollen Funktionsumfang. Geo Viz ist eine einfache Möglichkeit, die Ergebnisse einer raumbezogenen Analyse auf einer Karte zu visualisieren, und zwar jeweils eine Abfrage nach der anderen.
Geo Viz unterstützt geometrische Eingaben (Punkte, Linien und Polygone), die als GEOGRAPHY-Spalte abgerufen werden. Mit den Geografiefunktionen von BigQuery können Sie den Breiten- und Längengrad in GEOGRAPHY umwandeln.
Die Anzahl der Ergebnisse, die Geo Viz auf einer Karte anzeigen kann, ist durch den Browserspeicher begrenzt. Mit der Funktion ST_Simplify können Sie die Auflösung und die Größe raumbezogener Daten verringern, die von der Abfrage zurückgegebenen werden.
Die interaktive Echtzeit-Analyse wird lokal von Ihrem Browser durchgeführt und hängt von seinen Funktionen ab.
Geo Viz unterstützt die Freigabe von Visualisierungen nur an Nutzer, die berechtigt sind, im selben BigQuery-Projekt Abfragen auszuführen.
Geo Viz unterstützt nicht das Herunterladen einer Visualisierung für die Offline-Bearbeitung.
Google Earth Engine
Sie können auch raumbezogene Daten mit Google Earth Engine visualisieren. Exportieren Sie dazu Ihre BigQuery-Daten in Cloud Storage und importieren Sie sie anschließend in Earth Engine. Mit den Earth Engine-Tools können Sie Ihre Daten visualisieren.
Weitere Informationen (nur auf Englisch) zur Verwendung von Google Earth Engine finden Sie hier:
Mithilfe der GeoJSON-Erweiterung können Sie Visualisierungen in Jupyter-Notebooks ausführen.
Ihre raumbezogenen Daten müssen im GeoJSON-Format vorliegen, wenn Sie diese Erweiterung verwenden möchten.
[[["Leicht verständlich","easyToUnderstand","thumb-up"],["Mein Problem wurde gelöst","solvedMyProblem","thumb-up"],["Sonstiges","otherUp","thumb-up"]],[["Schwer verständlich","hardToUnderstand","thumb-down"],["Informationen oder Beispielcode falsch","incorrectInformationOrSampleCode","thumb-down"],["Benötigte Informationen/Beispiele nicht gefunden","missingTheInformationSamplesINeed","thumb-down"],["Problem mit der Übersetzung","translationIssue","thumb-down"],["Sonstiges","otherDown","thumb-down"]],["Zuletzt aktualisiert: 2025-03-06 (UTC)."],[[["\u003cp\u003eGeospatial analytics allows for the visualization of geographic location data through various tools.\u003c/p\u003e\n"],["\u003cp\u003eLooker Studio offers a no-cost, self-serve reporting and data visualization service with features like geographic field types, choropleth maps, and Google Maps-based visualization.\u003c/p\u003e\n"],["\u003cp\u003eBigQuery Geo Viz is a lightweight web tool that enables the visualization of geospatial data from BigQuery via interactive maps but is limited in terms of real-time analysis and supported inputs.\u003c/p\u003e\n"],["\u003cp\u003eGoogle Earth Engine provides another avenue for visualizing geospatial data by exporting data to Cloud Storage and using the Earth Engine's tools.\u003c/p\u003e\n"],["\u003cp\u003eJupyter notebooks, with the GeoJSON extension, can be utilized for visualizing geospatial data in GeoJSON format.\u003c/p\u003e\n"]]],[],null,["# Visualize geospatial data\n=========================\n\nGeospatial analytics lets you visualize geographic location data by\nusing the following:\n\n- [BigQuery Studio](#bigquery_studio)\n- [Looker Studio](#data_studio)\n- [BigQuery Geo Viz](#geo_viz)\n- [Colab notebooks](#colab)\n- [Google Earth Engine](#google_earth)\n\nBigQuery Studio\n---------------\n\n|\n| **Preview**\n|\n|\n| This feature is subject to the \"Pre-GA Offerings Terms\" in the General Service Terms section\n| of the [Service Specific Terms](/terms/service-terms#1).\n|\n| Pre-GA features are available \"as is\" and might have limited support.\n|\n| For more information, see the\n| [launch stage descriptions](/products#product-launch-stages).\n| **Note:** To request support or provide feedback for this feature, email [bigquery-earthengine-preview-support@google.com](mailto:bigquery-earthengine-preview-support@google.com).\n\nBigQuery Studio offers an integrated geography data viewer. When your query\nresults contain one or more `GEOGRAPHY` type columns, you can view the results\nin an interactive map.\nTo view the map, in the **Query results** pane, click the **Visualization** tab.\n\nVisualization in BigQuery is ideal for quick inspections and\niterative query development. You can visually confirm data alignment with\nexpectations, identify outliers, and assess the correctness of your spatial\ndata. It's also useful for ad hoc analysis to explore results and derive\nimmediate conclusions from geospatial queries.\n\nTo see an example of how to use the integrated geography viewer, see\n[Get started with geospatial analytics](/bigquery/docs/geospatial-get-started).\n\n### BigQuery Studio limitations\n\n- You can only visualize one `GEOGRAPHY` column at a time.\n- Performance is subject to browser capabilities and isn't intended for rendering extremely large or complex datasets. BigQuery renders up to approximately one million vertices, 20,000 rows, or 128 MB of results.\n\nLooker Studio\n-------------\n\nLooker Studio is a no-cost, self-serve reporting and data visualization\nservice from Google Marketing Platform that connects to BigQuery\nand hundreds of other data sources. The service includes support for a variety\nof [geographic field types](https://support.google.com/looker-studio/answer/9843174)\nand [choropleth maps](https://en.wikipedia.org/wiki/Choropleth_map) of\nBigQuery `GEOGRAPHY` polygons. With\n[Google Maps-based visualization](https://support.google.com/looker-studio/answer/9713352),\nyou can visualize and interact with your geographic data just as you do with\nGoogle Maps: pan around, zoom in, and pop into Street View.\n\nFor a walkthrough of geospatial analytics in Looker Studio, see\n[Visualize BigQuery `GEOGRAPHY` polygons with Looker Studio](https://support.google.com/looker-studio/answer/10502383).\n\nBigQuery Geo Viz\n----------------\n\nBigQuery Geo Viz is a web tool for visualization of geospatial\ndata in BigQuery using Google Maps APIs. You can run a SQL query\nand display the results on an interactive map. Flexible styling features let\nyou analyze and explore your data.\n\nBigQuery Geo Viz is not a fully featured geospatial analytics\nvisualization tool. Geo Viz is a lightweight way to visualize the results of a\ngeospatial analytics query on a map, one query at a time.\n\nTo see an example of using Geo Viz to visualize geospatial data, see\n[Get started with geospatial analytics](/bigquery/docs/geospatial-get-started).\n\nTo explore Geo Viz, go to the Geo Viz web tool:\n\n[Go to Geo Viz](https://bigquerygeoviz.appspot.com/)\n\n### Geo Viz limitations\n\n- Geo Viz supports geometry inputs (points, lines, and polygons) that are retrieved as a `GEOGRAPHY` column. You can use BigQuery's geography functions to convert latitude and longitude to `GEOGRAPHY`.\n- The number of results that Geo Viz can display on a map is limited by browser memory. You can lower the resolution and reduce size of geospatial data returned from the query by using `ST_Simplify` function.\n- Real-time, interactive analysis is handled locally by your browser and is subject to your browser's capabilities.\n- Geo Viz supports sharing visualizations only with users authorized to execute queries in the same BigQuery project.\n- Geo Viz does not support downloading a visualization for offline editing.\n\nColab notebooks\n---------------\n\nYou can also perform geospatial visualizations in Colab\nnotebooks. For a tutorial on building a Colab notebook to\nvisualize data, see [BigQuery geospatial visualization in Colab](/bigquery/docs/geospatial-visualize-colab).\n\nTo view and run a prebuilt notebook, see [BigQuery geospatial visualization in Colab](https://github.com/GoogleCloudPlatform/bigquery-utils/blob/master/notebooks/bigquery_geospatial_visualization.ipynb) in GitHub.\n\nGoogle Earth Engine\n-------------------\n\nYou can also visualize geospatial data using Google Earth Engine. To use\nGoogle Earth Engine, export your BigQuery data to Cloud Storage\nand then import it into Google Earth Engine. You can use the Google Earth Engine tools\nto visualize your data.\n\nFor more information on using Google Earth Engine, see the:\n\n- [Google Earth Engine developer's guide](https://developers.google.com/earth-engine/)\n- [Google Earth Engine API tutorials](https://developers.google.com/earth-engine/tutorials)"]]