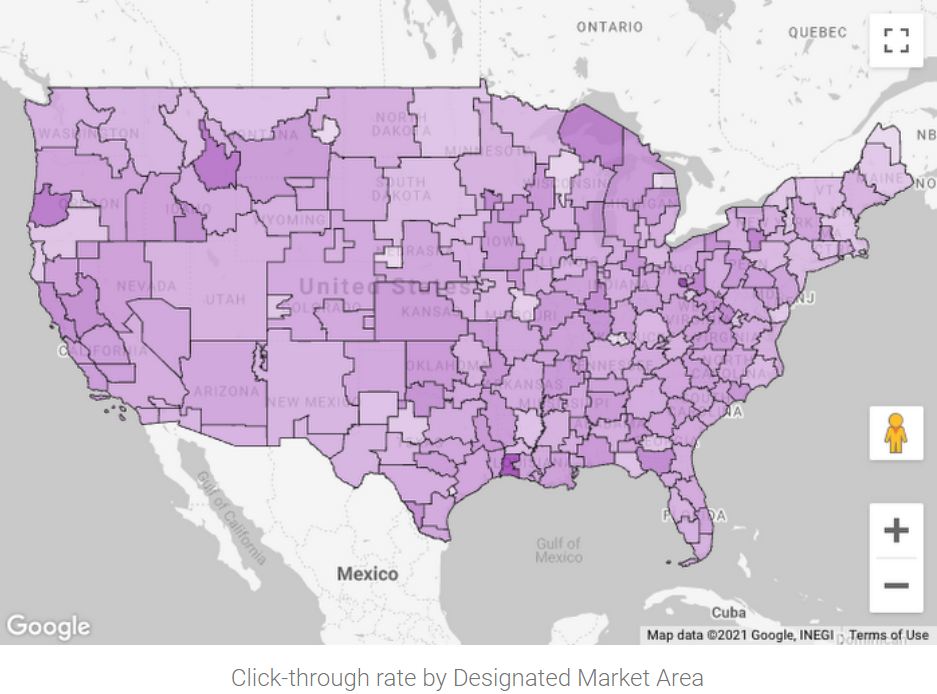
O Looker Studio é um serviço de relatórios de autoatendimento e visualização de dados
gratuito do Google Marketing Platform que se conecta ao BigQuery
e a centenas de outras fontes de dados. O serviço inclui suporte para uma grande variedade
de tipos de campos
geográficos e mapas de
coropléticos de polígonos GEOGRÁFICOS
do BigQuery. Com a visualização baseada no Google
Maps, é possível
ver e interagir com seus dados geográficos exatamente como no Google
Maps: movimentar, aumentar o zoom e até mesmo abrir o Street View.
O BigQuery Geo Viz é uma ferramenta da Web para visualização de dados geoespaciais no BigQuery usando as APIs Google Maps. É possível executar uma consulta SQL e exibir os resultados em um mapa interativo. Os recursos de estilo flexíveis permitem
analisar e explorar os dados.
O BigQuery Geo Viz não é uma ferramenta de visualização de análises geoespaciais repletas de recursos. O Geo Viz é uma maneira rápida de visualizar os resultados de uma consulta de análise geoespacial em um mapa, uma consulta por vez.
Para explorar o Geo Viz, acesse a ferramenta da Web do BigQuery Geo Viz.
Limitações do Geo Viz
O Geo Viz é compatível com entradas de geometria (pontos, linhas e polígonos) recuperadas como uma coluna GEOGRAPHY. É possível usar as funções geográficas do BigQuery para converter latitude e longitude em GEOGRAPHY.
O número de resultados que o Geo Viz pode exibir em um mapa é limitado pela memória do navegador. É possível diminuir a resolução e reduzir o tamanho dos dados geoespaciais retornados pela consulta usando a função ST_Simplify.
A análise interativa em tempo real é tratada localmente pelo navegador e está sujeita às capacidades dele.
O Geo Viz permite o compartilhamento de visualizações somente com usuários autorizados a executar consultas no mesmo projeto do BigQuery.
O Geo Viz não permite o download de uma visualização para edição off-line.
Google Earth Engine
Também é possível visualizar dados geoespaciais usando o Google Earth Engine. Para usar o Earth Engine, exporte os dados do BigQuery para o Cloud Storage e importe-os para o Earth Engine. É possível usar as ferramentas do Earth Engine para visualizar os dados.
Para mais informações sobre como usar o Google Earth Engine, consulte:
É possível realizar visualizações em notebooks do Jupyter usando a extensão GeoJSON.
Para que você possa usar essa extensão, os dados geoespaciais precisam estar no formato GeoJSON.
Para mais informações, consulte a extensão GeoJSON (em inglês) no GitHub.
[[["Fácil de entender","easyToUnderstand","thumb-up"],["Meu problema foi resolvido","solvedMyProblem","thumb-up"],["Outro","otherUp","thumb-up"]],[["Difícil de entender","hardToUnderstand","thumb-down"],["Informações incorretas ou exemplo de código","incorrectInformationOrSampleCode","thumb-down"],["Não contém as informações/amostras de que eu preciso","missingTheInformationSamplesINeed","thumb-down"],["Problema na tradução","translationIssue","thumb-down"],["Outro","otherDown","thumb-down"]],["Última atualização 2025-03-06 UTC."],[[["\u003cp\u003eGeospatial analytics allows for the visualization of geographic location data through various tools.\u003c/p\u003e\n"],["\u003cp\u003eLooker Studio offers a no-cost, self-serve reporting and data visualization service with features like geographic field types, choropleth maps, and Google Maps-based visualization.\u003c/p\u003e\n"],["\u003cp\u003eBigQuery Geo Viz is a lightweight web tool that enables the visualization of geospatial data from BigQuery via interactive maps but is limited in terms of real-time analysis and supported inputs.\u003c/p\u003e\n"],["\u003cp\u003eGoogle Earth Engine provides another avenue for visualizing geospatial data by exporting data to Cloud Storage and using the Earth Engine's tools.\u003c/p\u003e\n"],["\u003cp\u003eJupyter notebooks, with the GeoJSON extension, can be utilized for visualizing geospatial data in GeoJSON format.\u003c/p\u003e\n"]]],[],null,["# Visualize geospatial data\n=========================\n\nGeospatial analytics lets you visualize geographic location data by\nusing the following:\n\n- [BigQuery Studio](#bigquery_studio)\n- [Looker Studio](#data_studio)\n- [BigQuery Geo Viz](#geo_viz)\n- [Colab notebooks](#colab)\n- [Google Earth Engine](#google_earth)\n\nBigQuery Studio\n---------------\n\n|\n| **Preview**\n|\n|\n| This feature is subject to the \"Pre-GA Offerings Terms\" in the General Service Terms section\n| of the [Service Specific Terms](/terms/service-terms#1).\n|\n| Pre-GA features are available \"as is\" and might have limited support.\n|\n| For more information, see the\n| [launch stage descriptions](/products#product-launch-stages).\n| **Note:** To request support or provide feedback for this feature, email [bigquery-earthengine-preview-support@google.com](mailto:bigquery-earthengine-preview-support@google.com).\n\nBigQuery Studio offers an integrated geography data viewer. When your query\nresults contain one or more `GEOGRAPHY` type columns, you can view the results\nin an interactive map.\nTo view the map, in the **Query results** pane, click the **Visualization** tab.\n\nVisualization in BigQuery is ideal for quick inspections and\niterative query development. You can visually confirm data alignment with\nexpectations, identify outliers, and assess the correctness of your spatial\ndata. It's also useful for ad hoc analysis to explore results and derive\nimmediate conclusions from geospatial queries.\n\nTo see an example of how to use the integrated geography viewer, see\n[Get started with geospatial analytics](/bigquery/docs/geospatial-get-started).\n\n### BigQuery Studio limitations\n\n- You can only visualize one `GEOGRAPHY` column at a time.\n- Performance is subject to browser capabilities and isn't intended for rendering extremely large or complex datasets. BigQuery renders up to approximately one million vertices, 20,000 rows, or 128 MB of results.\n\nLooker Studio\n-------------\n\nLooker Studio is a no-cost, self-serve reporting and data visualization\nservice from Google Marketing Platform that connects to BigQuery\nand hundreds of other data sources. The service includes support for a variety\nof [geographic field types](https://support.google.com/looker-studio/answer/9843174)\nand [choropleth maps](https://en.wikipedia.org/wiki/Choropleth_map) of\nBigQuery `GEOGRAPHY` polygons. With\n[Google Maps-based visualization](https://support.google.com/looker-studio/answer/9713352),\nyou can visualize and interact with your geographic data just as you do with\nGoogle Maps: pan around, zoom in, and pop into Street View.\n\nFor a walkthrough of geospatial analytics in Looker Studio, see\n[Visualize BigQuery `GEOGRAPHY` polygons with Looker Studio](https://support.google.com/looker-studio/answer/10502383).\n\nBigQuery Geo Viz\n----------------\n\nBigQuery Geo Viz is a web tool for visualization of geospatial\ndata in BigQuery using Google Maps APIs. You can run a SQL query\nand display the results on an interactive map. Flexible styling features let\nyou analyze and explore your data.\n\nBigQuery Geo Viz is not a fully featured geospatial analytics\nvisualization tool. Geo Viz is a lightweight way to visualize the results of a\ngeospatial analytics query on a map, one query at a time.\n\nTo see an example of using Geo Viz to visualize geospatial data, see\n[Get started with geospatial analytics](/bigquery/docs/geospatial-get-started).\n\nTo explore Geo Viz, go to the Geo Viz web tool:\n\n[Go to Geo Viz](https://bigquerygeoviz.appspot.com/)\n\n### Geo Viz limitations\n\n- Geo Viz supports geometry inputs (points, lines, and polygons) that are retrieved as a `GEOGRAPHY` column. You can use BigQuery's geography functions to convert latitude and longitude to `GEOGRAPHY`.\n- The number of results that Geo Viz can display on a map is limited by browser memory. You can lower the resolution and reduce size of geospatial data returned from the query by using `ST_Simplify` function.\n- Real-time, interactive analysis is handled locally by your browser and is subject to your browser's capabilities.\n- Geo Viz supports sharing visualizations only with users authorized to execute queries in the same BigQuery project.\n- Geo Viz does not support downloading a visualization for offline editing.\n\nColab notebooks\n---------------\n\nYou can also perform geospatial visualizations in Colab\nnotebooks. For a tutorial on building a Colab notebook to\nvisualize data, see [BigQuery geospatial visualization in Colab](/bigquery/docs/geospatial-visualize-colab).\n\nTo view and run a prebuilt notebook, see [BigQuery geospatial visualization in Colab](https://github.com/GoogleCloudPlatform/bigquery-utils/blob/master/notebooks/bigquery_geospatial_visualization.ipynb) in GitHub.\n\nGoogle Earth Engine\n-------------------\n\nYou can also visualize geospatial data using Google Earth Engine. To use\nGoogle Earth Engine, export your BigQuery data to Cloud Storage\nand then import it into Google Earth Engine. You can use the Google Earth Engine tools\nto visualize your data.\n\nFor more information on using Google Earth Engine, see the:\n\n- [Google Earth Engine developer's guide](https://developers.google.com/earth-engine/)\n- [Google Earth Engine API tutorials](https://developers.google.com/earth-engine/tutorials)"]]