建立 k-means 模型,將倫敦自行車租用資料集分群


本教學課程將說明如何在 BigQuery ML 中使用k-means 模型,找出資料集中的叢集。

將資料分組成各個叢集的 k-means 演算法,是一種非監督式機器學習。與預測分析的監督式機器學習不同,非監督式機器學習著重於描述性分析。非監督式機器學習可協助您瞭解資料,進而做出資料導向決策。

本教學課程中的查詢使用地理空間分析服務提供的地理位置函式,詳情請參閱「地理空間分析簡介」。

本教學課程使用 倫敦自行車租用公開資料集。資料包括租用開始和結束的時間戳記、車站名稱,以及騎乘時間。

目標

本教學課程會逐步引導您完成下列工作:

  • 檢查用於訓練模型的資料。
  • 建立 k-means 分群模型。
  • 使用 BigQuery ML 的資料叢集可視化功能,解讀產生的資料叢集。
  • 在 k-means 模型上執行 ML.PREDICT 函式,預測一組單車出租站的可能叢集。

費用

本教學課程使用 Google Cloud的計費元件,包括:

  • BigQuery
  • BigQuery ML

如要進一步瞭解 BigQuery 費用,請參閱 BigQuery 定價頁面。

如要瞭解 BigQuery ML 費用,請參閱 BigQuery ML 定價

事前準備

  1. Sign in to your Google Cloud account. If you're new to Google Cloud, create an account to evaluate how our products perform in real-world scenarios. New customers also get $300 in free credits to run, test, and deploy workloads.
  2. In the Google Cloud console, on the project selector page, select or create a Google Cloud project.

    Go to project selector

  3. Make sure that billing is enabled for your Google Cloud project.

  4. In the Google Cloud console, on the project selector page, select or create a Google Cloud project.

    Go to project selector

  5. Make sure that billing is enabled for your Google Cloud project.

  6. 新專案會自動啟用 BigQuery。如要在現有的專案中啟用 BigQuery,請前往

    Enable the BigQuery API.

    Enable the API

  7. 所需權限

    • 如要建立資料集,您必須具備 bigquery.datasets.create IAM 權限。

    • 您必須具備下列權限,才能建立模型:

      • bigquery.jobs.create
      • bigquery.models.create
      • bigquery.models.getData
      • bigquery.models.updateData
    • 如要執行推論,您需要具備下列權限:

      • bigquery.models.getData
      • bigquery.jobs.create

    如要進一步瞭解 BigQuery 中的 IAM 角色和權限,請參閱「IAM 簡介」。

建立資料集

建立 BigQuery 資料集來儲存 k 均值模型:

  1. 前往 Google Cloud 控制台的「BigQuery」頁面。

    前往「BigQuery」頁面

  2. 在「Explorer」窗格中,按一下專案名稱。

  3. 依序點選 「View actions」(查看動作) >「Create dataset」(建立資料集)

    建立資料集。

  4. 在「Create dataset」頁面上執行下列操作:

    • 在「Dataset ID」(資料集 ID) 中輸入 bqml_tutorial

    • 針對「Location type」(位置類型),選取「Multi-region」(多區域),然後選取「EU (multiple regions in European Union)」(歐盟 (多個區域))

      倫敦自行車租用公開資料集存放在 EU 多地區。資料集必須位於相同位置。

    • 保留其餘預設設定,然後點選「Create dataset」(建立資料集)

      「Create dataset」(建立資料集) 頁面。

檢查訓練資料

檢查要用來訓練 k-means 模型的資料。在本教學課程中,您將根據下列屬性將自行車站分群:

  • 租用時間
  • 每日租用次數
  • 距市中心的距離

SQL

這個查詢會擷取自行車的租用資料 (包括 start_station_nameduration 資料欄),並將這些資料與車站資訊彙整。包括建立計算結果欄,其中包含車站與市中心的距離。然後,查詢會計算 stationstats 欄中的車站屬性 (包括平均騎乘時間和租用次數),以及計算的 distance_from_city_center 欄。

請按照下列步驟檢查訓練資料:

  1. 前往 Google Cloud 控制台的「BigQuery」頁面。

    前往 BigQuery

  2. 在查詢編輯器中貼上以下查詢,然後點選「執行」

    WITH
    hs AS (
      SELECT
        h.start_station_name AS station_name,
        IF(
          EXTRACT(DAYOFWEEK FROM h.start_date) = 1
            OR EXTRACT(DAYOFWEEK FROM h.start_date) = 7,
          'weekend',
          'weekday') AS isweekday,
        h.duration,
        ST_DISTANCE(ST_GEOGPOINT(s.longitude, s.latitude), ST_GEOGPOINT(-0.1, 51.5)) / 1000
          AS distance_from_city_center
      FROM
        `bigquery-public-data.london_bicycles.cycle_hire` AS h
      JOIN
        `bigquery-public-data.london_bicycles.cycle_stations` AS s
        ON
          h.start_station_id = s.id
      WHERE
        h.start_date
        BETWEEN CAST('2015-01-01 00:00:00' AS TIMESTAMP)
        AND CAST('2016-01-01 00:00:00' AS TIMESTAMP)
    ),
    stationstats AS (
      SELECT
        station_name,
        isweekday,
        AVG(duration) AS duration,
        COUNT(duration) AS num_trips,
        MAX(distance_from_city_center) AS distance_from_city_center
      FROM
        hs
      GROUP BY
        station_name, isweekday
    )
    SELECT *
    FROM
    stationstats
    ORDER BY
    distance_from_city_center ASC;

結果應如下所示:

查詢結果

BigQuery DataFrames

在嘗試這個範例之前,請先參閱 BigQuery 快速入門:使用 BigQuery DataFrames,按照 BigQuery DataFrames 設定說明進行操作。詳情請參閱 BigQuery DataFrames 參考資料說明文件

如要向 BigQuery 進行驗證,請設定應用程式預設憑證。詳情請參閱「為本機開發環境設定 ADC」。

import datetime
import typing

import pandas as pd
from shapely.geometry import Point

import bigframes
import bigframes.bigquery as bbq
import bigframes.geopandas
import bigframes.pandas as bpd

bigframes.options.bigquery.project = your_gcp_project_id
# Compute in the EU multi-region to query the London bicycles dataset.
bigframes.options.bigquery.location = "EU"

# Extract the information you'll need to train the k-means model in this
# tutorial. Use the read_gbq function to represent cycle hires
# data as a DataFrame.
h = bpd.read_gbq(
    "bigquery-public-data.london_bicycles.cycle_hire",
    col_order=["start_station_name", "start_station_id", "start_date", "duration"],
).rename(
    columns={
        "start_station_name": "station_name",
        "start_station_id": "station_id",
    }
)

# Use GeoSeries.from_xy and BigQuery.st_distance to analyze geographical
# data. These functions determine spatial relationships between
# geographical features.
cycle_stations = bpd.read_gbq("bigquery-public-data.london_bicycles.cycle_stations")
s = bpd.DataFrame(
    {
        "id": cycle_stations["id"],
        "xy": bigframes.geopandas.GeoSeries.from_xy(
            cycle_stations["longitude"], cycle_stations["latitude"]
        ),
    }
)
s_distance = bbq.st_distance(s["xy"], Point(-0.1, 51.5), use_spheroid=False) / 1000
s = bpd.DataFrame({"id": s["id"], "distance_from_city_center": s_distance})

# Define Python datetime objects in the UTC timezone for range comparison,
# because BigQuery stores timestamp data in the UTC timezone.
sample_time = datetime.datetime(2015, 1, 1, 0, 0, 0, tzinfo=datetime.timezone.utc)
sample_time2 = datetime.datetime(2016, 1, 1, 0, 0, 0, tzinfo=datetime.timezone.utc)

h = h.loc[(h["start_date"] >= sample_time) & (h["start_date"] <= sample_time2)]

# Replace each day-of-the-week number with the corresponding "weekday" or
# "weekend" label by using the Series.map method.
h = h.assign(
    isweekday=h.start_date.dt.dayofweek.map(
        {
            0: "weekday",
            1: "weekday",
            2: "weekday",
            3: "weekday",
            4: "weekday",
            5: "weekend",
            6: "weekend",
        }
    )
)

# Supplement each trip in "h" with the station distance information from
# "s" by merging the two DataFrames by station ID.
merged_df = h.merge(
    right=s,
    how="inner",
    left_on="station_id",
    right_on="id",
)

# Engineer features to cluster the stations. For each station, find the
# average trip duration, number of trips, and distance from city center.
stationstats = typing.cast(
    bpd.DataFrame,
    merged_df.groupby(["station_name", "isweekday"]).agg(
        {"duration": ["mean", "count"], "distance_from_city_center": "max"}
    ),
)
stationstats.columns = pd.Index(
    ["duration", "num_trips", "distance_from_city_center"]
)
stationstats = stationstats.sort_values(
    by="distance_from_city_center", ascending=True
).reset_index()

# Expected output results: >>> stationstats.head(3)
# station_name	isweekday duration  num_trips	distance_from_city_center
# Borough Road...	weekday	    1110	    5749	    0.12624
# Borough Road...	weekend	    2125	    1774	    0.12624
# Webber Street...	weekday	    795	        6517	    0.164021
#   3 rows × 5 columns

建立 k-means 模型

使用倫敦自行車租用訓練資料建立 k-means 模型。

SQL

在下列查詢中,CREATE MODEL 陳述式會指定要使用的叢集數量,即四個。在 SELECT 陳述式中,EXCEPT 子句會排除 station_name 欄,因為這個欄不含特徵。該查詢會為每個 station_name 建立專屬的資料列,至於 SELECT 陳述式中則僅會納入特徵。

請按照下列步驟建立 k-means 模型:

  1. 前往 Google Cloud 控制台的「BigQuery」頁面。

    前往 BigQuery

  2. 在查詢編輯器中貼上以下查詢,然後點選「執行」

    CREATE OR REPLACE MODEL `bqml_tutorial.london_station_clusters`
    OPTIONS (
      model_type = 'kmeans',
      num_clusters = 4)
    AS
    WITH
    hs AS (
      SELECT
        h.start_station_name AS station_name,
        IF(
          EXTRACT(DAYOFWEEK FROM h.start_date) = 1
            OR EXTRACT(DAYOFWEEK FROM h.start_date) = 7,
          'weekend',
          'weekday') AS isweekday,
        h.duration,
        ST_DISTANCE(ST_GEOGPOINT(s.longitude, s.latitude), ST_GEOGPOINT(-0.1, 51.5)) / 1000
          AS distance_from_city_center
      FROM
        `bigquery-public-data.london_bicycles.cycle_hire` AS h
      JOIN
        `bigquery-public-data.london_bicycles.cycle_stations` AS s
        ON
          h.start_station_id = s.id
      WHERE
        h.start_date
        BETWEEN CAST('2015-01-01 00:00:00' AS TIMESTAMP)
        AND CAST('2016-01-01 00:00:00' AS TIMESTAMP)
    ),
    stationstats AS (
      SELECT
        station_name,
        isweekday,
        AVG(duration) AS duration,
        COUNT(duration) AS num_trips,
        MAX(distance_from_city_center) AS distance_from_city_center
      FROM
        hs
      GROUP BY
        station_name, isweekday
    )
    SELECT *
    EXCEPT (station_name, isweekday)
    FROM
    stationstats;

BigQuery DataFrames

在嘗試這個範例之前,請先參閱 BigQuery 快速入門:使用 BigQuery DataFrames,按照 BigQuery DataFrames 設定說明進行操作。詳情請參閱 BigQuery DataFrames 參考資料說明文件

如要向 BigQuery 進行驗證,請設定應用程式預設憑證。詳情請參閱「為本機開發環境設定 ADC」。


from bigframes.ml.cluster import KMeans

# To determine an optimal number of clusters, construct and fit several
# K-Means objects with different values of num_clusters, find the error
# measure, and pick the point at which the error measure is at its minimum
# value.
cluster_model = KMeans(n_clusters=4)
cluster_model.fit(stationstats)
cluster_model.to_gbq(
    your_model_id,  # For example: "bqml_tutorial.london_station_clusters"
    replace=True,
)

解讀資料叢集

模型的「評估」分頁中的資訊可協助您解讀模型產生的叢集。

如要查看模型的評估資訊,請按照下列步驟操作:

  1. 前往 Google Cloud 控制台的「BigQuery」頁面。

    前往 BigQuery

  2. 在「Explorer」窗格中,依序展開專案、bqml_tutorial 資料集,然後展開「Models」資料夾。

  3. 選取 london_station_clusters 模型。

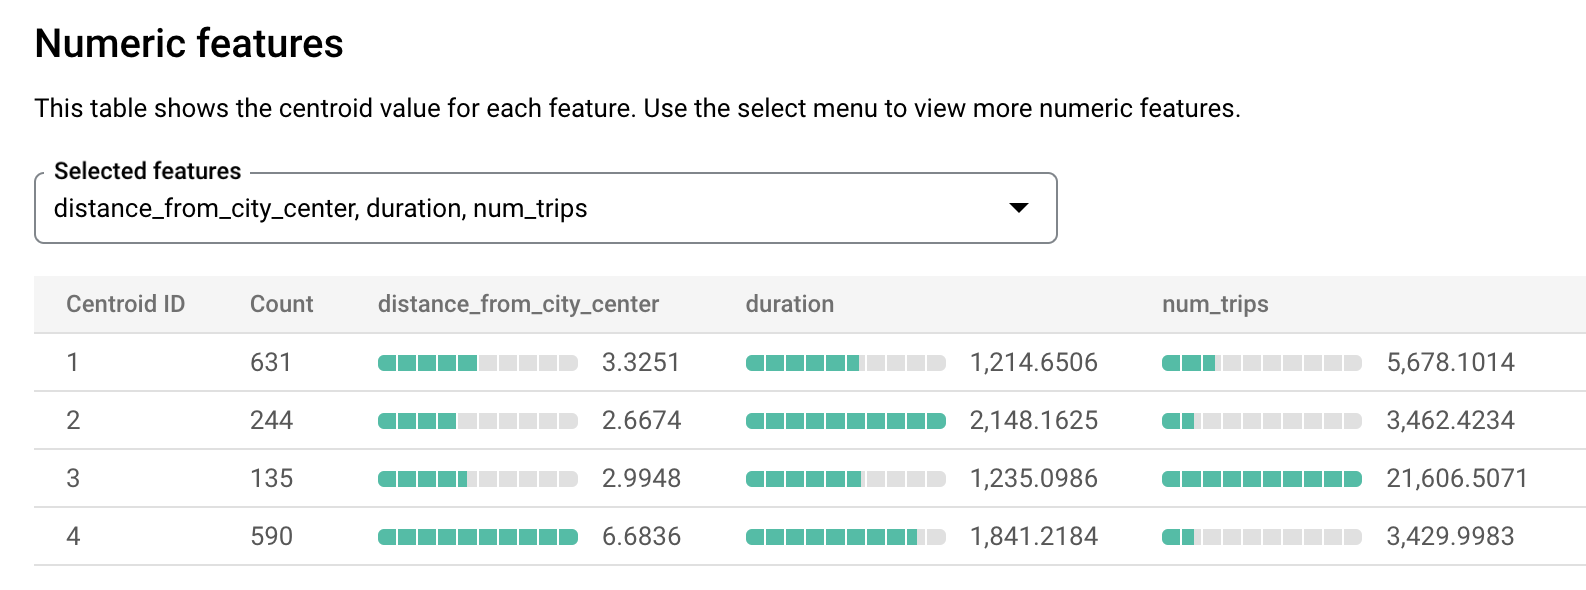
  4. 選取「評估」分頁標籤。這個分頁會顯示 k-means 模型所識別的分群的圖表。在「數值特徵」部分,長條圖會顯示每個群集中心最重要的數值特徵值。每個中心點都代表特定的資料叢集。您可以從下拉式選單中選取要視覺化的地圖項目。

    數值特徵圖表

    這個模型會建立下列重心:

    • Centroid 1 顯示較不繁忙的市區車站,租用時間較短。
    • Centroid 2 顯示第二個較不繁忙的城市車站,用於較長時間的租車。
    • Centroid 3 顯示靠近市中心的繁忙車站。
    • 中心點 4 顯示郊區車站,且行程較長。

    如果您經營自行車出租業務,可以利用這項資訊來制定業務決策。例如:

    • 假設您需要實驗某個新的鎖,您應該要選擇哪個車站叢集來做為實驗對象呢?中心點 1、中心點 2 或中心點 4 中的車站似乎是合乎邏輯的選擇,因為這些車站並非最繁忙的車站。

    • 假設您想要在某些車站擺放競速自行車,您應該要選擇哪些車站呢?質心 4 是距市中心最遠的車站群組,且騎乘距離最長。因此這些可以成為擺放競速自行車的候選車站。

使用 ML.PREDICT 函式來預測車站的叢集

使用 ML.PREDICT SQL 函式或 predict BigQuery DataFrames 函式,找出特定車站所屬的叢集。

SQL

以下查詢會使用 REGEXP_CONTAINS 函式,找出 station_name 欄中含有字串 Kennington 的所有項目。ML.PREDICT 函式會使用這些值,來預測哪些叢集可能包含這些車站。

請按照下列步驟操作,預測每個名稱含有 Kennington 字串的車站所屬的叢集:

  1. 前往 Google Cloud 控制台的「BigQuery」頁面。

    前往 BigQuery

  2. 在查詢編輯器中貼上以下查詢,然後點選「執行」

    WITH
    hs AS (
      SELECT
        h.start_station_name AS station_name,
        IF(
          EXTRACT(DAYOFWEEK FROM h.start_date) = 1
            OR EXTRACT(DAYOFWEEK FROM h.start_date) = 7,
          'weekend',
          'weekday') AS isweekday,
        h.duration,
        ST_DISTANCE(ST_GEOGPOINT(s.longitude, s.latitude), ST_GEOGPOINT(-0.1, 51.5)) / 1000
          AS distance_from_city_center
      FROM
        `bigquery-public-data.london_bicycles.cycle_hire` AS h
      JOIN
        `bigquery-public-data.london_bicycles.cycle_stations` AS s
        ON
          h.start_station_id = s.id
      WHERE
        h.start_date
        BETWEEN CAST('2015-01-01 00:00:00' AS TIMESTAMP)
        AND CAST('2016-01-01 00:00:00' AS TIMESTAMP)
    ),
    stationstats AS (
      SELECT
        station_name,
        isweekday,
        AVG(duration) AS duration,
        COUNT(duration) AS num_trips,
        MAX(distance_from_city_center) AS distance_from_city_center
      FROM
        hs
      GROUP BY
        station_name, isweekday
    )
    SELECT *
    EXCEPT (nearest_centroids_distance)
    FROM
    ML.PREDICT(
      MODEL `bqml_tutorial.london_station_clusters`,
      (
        SELECT *
        FROM
          stationstats
        WHERE
          REGEXP_CONTAINS(station_name, 'Kennington')
      ));

結果應如下所示:

ML.PREDICT 結果

BigQuery DataFrames

在嘗試這個範例之前,請先參閱 BigQuery 快速入門:使用 BigQuery DataFrames,按照 BigQuery DataFrames 設定說明進行操作。詳情請參閱 BigQuery DataFrames 參考資料說明文件

如要向 BigQuery 進行驗證,請設定應用程式預設憑證。詳情請參閱「為本機開發環境設定 ADC」。


# Select model you'll use for predictions. `read_gbq_model` loads model
# data from BigQuery, but you could also use the `cluster_model` object
# from previous steps.
cluster_model = bpd.read_gbq_model(
    your_model_id,
    # For example: "bqml_tutorial.london_station_clusters",
)

# Use 'contains' function to filter by stations containing the string
# "Kennington".
stationstats = stationstats.loc[
    stationstats["station_name"].str.contains("Kennington")
]

result = cluster_model.predict(stationstats)

# Expected output results:   >>>results.peek(3)
# CENTROID...	NEAREST...	station_name  isweekday	 duration num_trips dist...
# 	1	[{'CENTROID_ID'...	Borough...	  weekday	  1110	    5749	0.13
# 	2	[{'CENTROID_ID'...	Borough...	  weekend	  2125      1774	0.13
# 	1	[{'CENTROID_ID'...	Webber...	  weekday	  795	    6517	0.16
#   3 rows × 7 columns

清除所用資源

如要避免系統向您的 Google Cloud 帳戶收取本教學課程中所用資源的相關費用,請刪除含有該項資源的專案,或者保留專案但刪除個別資源。

  • 您可以刪除建立的專案。
  • 或者您可以保留專案並刪除資料集。

刪除資料集

刪除專案將移除專案中所有的資料集與資料表。若您希望重新使用專案,您可以刪除本教學課程中所建立的資料集。

  1. 如有必要,請在Google Cloud 控制台中開啟 BigQuery 頁面。

    前往「BigQuery」頁面

  2. 在導覽窗格中,按一下您建立的 bqml_tutorial 資料集。

  3. 按一下視窗右側的「Delete dataset」。這個動作會刪除資料集和模型。

  4. 在「Delete dataset」對話方塊中,輸入資料集的名稱 (bqml_tutorial),然後按一下「Delete」來確認刪除指令。

刪除專案

如要刪除專案,請進行以下操作:

  1. In the Google Cloud console, go to the Manage resources page.

    Go to Manage resources

  2. In the project list, select the project that you want to delete, and then click Delete.
  3. In the dialog, type the project ID, and then click Shut down to delete the project.

後續步驟