本教學課程將說明如何搭配 BigQuery ML 的內建 TimesFM 單變數模型,使用 AI.FORECAST 函式,根據特定資料欄的歷史值,預測該資料欄的未來值。
本教學課程使用公開資料表中的資料。bigquery-public-data.san_francisco_bikeshare.bikeshare_trips
預測單一共享單車行程時間序列
使用 AI.FORECAST 函式預測未來時間序列值。
下列查詢會根據過去四個月的歷來資料,預測下個月 (約 720 小時) 每小時的訂閱者單車共享行程數。confidence_level 引數表示查詢會產生信賴區間,信賴水準為 95%。
如要使用 TimesFM 模型預測資料,請按照下列步驟操作:
前往 Google Cloud 控制台的「BigQuery」頁面。
在查詢編輯器中貼上以下查詢,然後點選「執行」:
SELECT *
FROM
  AI.FORECAST(
    (
      SELECT TIMESTAMP_TRUNC(start_date, HOUR) as trip_hour, COUNT(*) as num_trips
FROM `bigquery-public-data.san_francisco_bikeshare.bikeshare_trips`
WHERE subscriber_type = 'Subscriber' AND start_date >= TIMESTAMP('2018-01-01')
GROUP BY TIMESTAMP_TRUNC(start_date, HOUR)
    ),
    horizon => 720,
    confidence_level => 0.95,
    timestamp_col => 'trip_hour',
    data_col => 'num_trips');
結果類似下方:
+-------------------------+-------------------+------------------+---------------------------------+---------------------------------+--------------------+
| forecast_timestamp      | forecast_value    | confidence_level | prediction_interval_lower_bound | prediction_interval_upper_bound | ai_forecast_status |
+-------------------------+-------------------+------------------+---------------------------------+---------------------------------+--------------------+
| 2018-05-01 00:00:00 UTC | 26.3045959...     |            0.95  | 21.7088378...                   | 30.9003540...                   |                    |
+-------------------------+-------------------+------------------+---------------------------------+---------------------------------+--------------------+
| 2018-05-01 01:00:00 UTC | 34.0890502...     |            0.95  | 2.47682913...                   | 65.7012714...                   |                    |
+-------------------------+-------------------+------------------+---------------------------------+---------------------------------+--------------------+
| 2018-05-01 02:00:00 UTC | 24.2154693...     |            0.95  | 2.87621605...                   | 45.5547226...                   |                    |
+-------------------------+-------------------+------------------+---------------------------------+---------------------------------+--------------------+
| ...                     | ...               |  ...             | ...                             |  ...                            |                    |
+-------------------------+-------------------+------------------+---------------------------------+---------------------------------+--------------------+
比較預測資料與輸入資料
繪製 AI.FORECAST 函式輸出內容的圖表,並與部分函式輸入資料進行比較。
請按照下列步驟繪製函式輸出內容的圖表:
前往 Google Cloud 控制台的「BigQuery」頁面。
在查詢編輯器中貼上以下查詢,然後點選「執行」:
WITH historical AS (
SELECT TIMESTAMP_TRUNC(start_date, HOUR) as trip_hour, COUNT(*) as num_trips
FROM `bigquery-public-data.san_francisco_bikeshare.bikeshare_trips`
WHERE subscriber_type = 'Subscriber' AND start_date >= TIMESTAMP('2018-01-01')
GROUP BY TIMESTAMP_TRUNC(start_date, HOUR)
ORDER BY TIMESTAMP_TRUNC(start_date, HOUR)
)
SELECT *
FROM
(
(SELECT
    trip_hour as date,
    num_trips AS historical_value,
    NULL as forecast_value,
    'historical' as type,
    NULL as prediction_interval_lower_bound,
    NULL as prediction_interval_upper_bound
FROM
    historical
ORDER BY historical.trip_hour DESC
LIMIT 400)
UNION ALL
(SELECT forecast_timestamp AS date,
        NULL as historical_value,
        forecast_value as forecast_value,
        'forecast' as type,
        prediction_interval_lower_bound,
        prediction_interval_upper_bound
FROM
    AI.FORECAST(
    (
    SELECT * FROM historical
    ),
    horizon => 720,
    confidence_level => 0.99,
    timestamp_col => 'trip_hour',
    data_col => 'num_trips')))
ORDER BY date asc;
查詢執行完畢後,按一下「查詢結果」窗格中的「視覺化」分頁標籤。產生的圖表看起來類似下列內容:
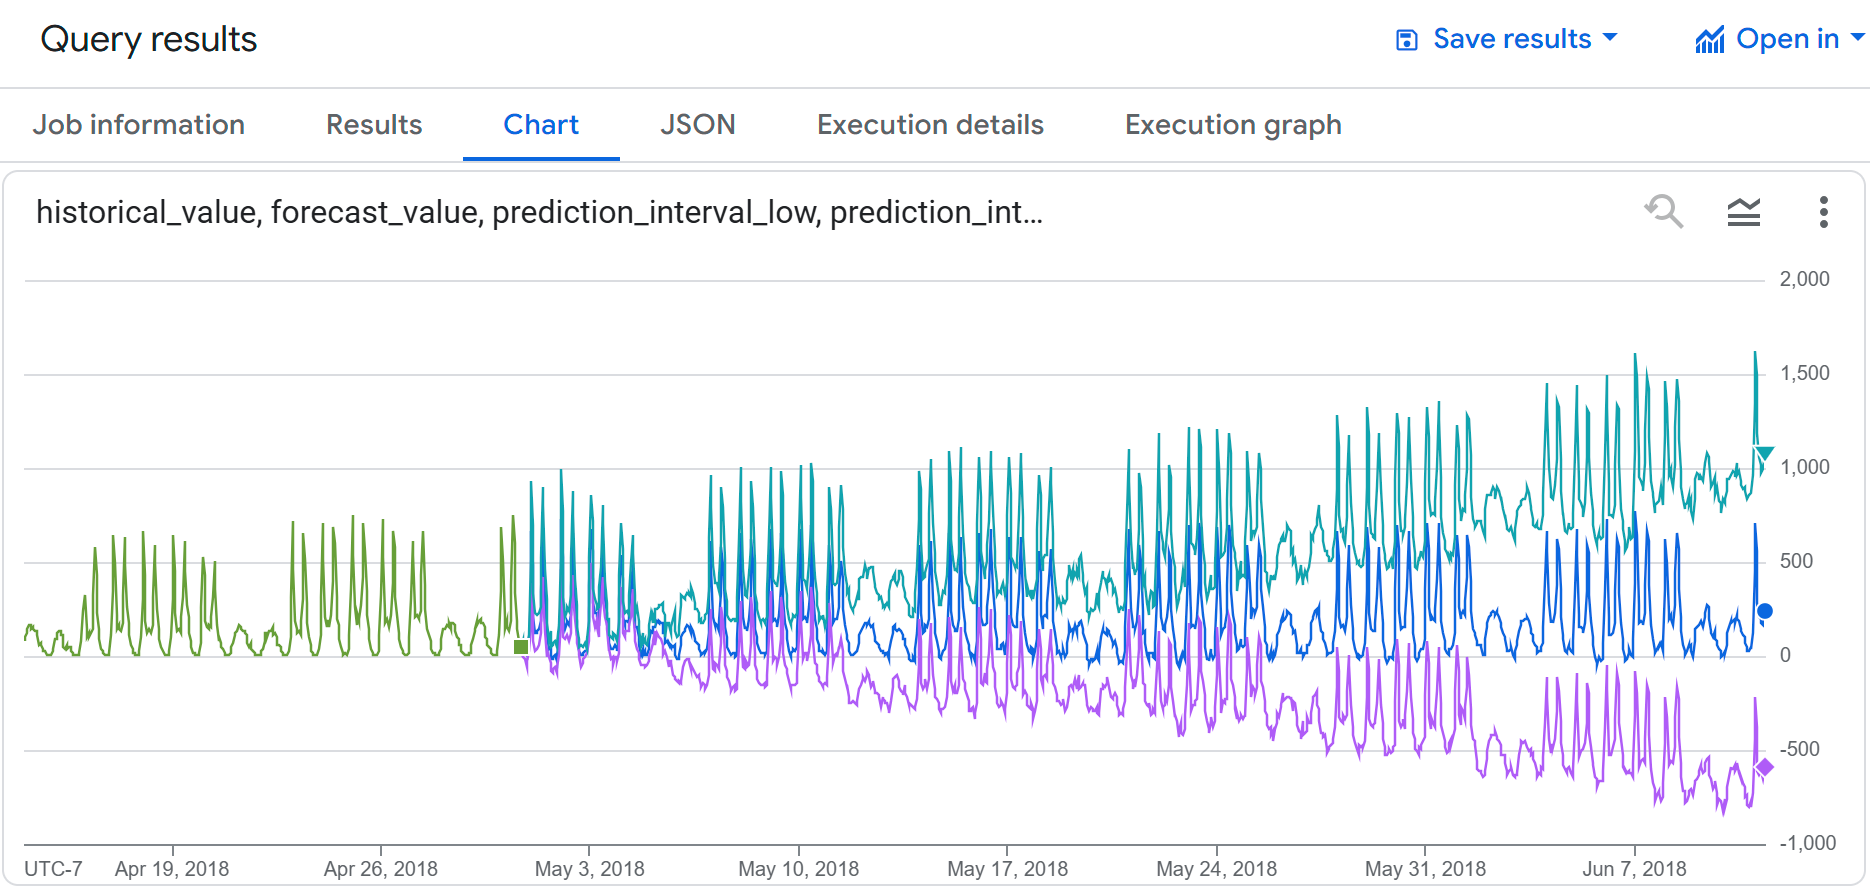
您會發現輸入資料和預測資料顯示的單車共享使用情形相似。您也可以看到,預測時間點越往未來延伸,預測區間下限和上限就會越高。
預測多個共享單車行程時間序列
下列查詢會根據過去四個月的歷史資料,預測下個月 (約 720 小時) 各訂閱者類型每小時的單車共享行程數。confidence_level 引數表示查詢會產生信賴區間,信賴水準為 95%。
如要使用 TimesFM 模型預測資料,請按照下列步驟操作:
前往 Google Cloud 控制台的「BigQuery」頁面。
在查詢編輯器中貼上以下查詢,然後點選「執行」:
SELECT *
FROM
  AI.FORECAST(
    (
      SELECT TIMESTAMP_TRUNC(start_date, HOUR) as trip_hour, subscriber_type, COUNT(*) as num_trips
      FROM `bigquery-public-data.san_francisco_bikeshare.bikeshare_trips`
      WHERE start_date >= TIMESTAMP('2018-01-01')
      GROUP BY TIMESTAMP_TRUNC(start_date, HOUR), subscriber_type
    ),
    horizon => 720,
    confidence_level => 0.95,
    timestamp_col => 'trip_hour',
    data_col => 'num_trips',
    id_cols => ['subscriber_type']);
結果類似下方:
+---------------------+--------------------------+------------------+------------------+---------------------------------+---------------------------------+--------------------+
| subscriber_type     | forecast_timestamp       | forecast_value   | confidence_level | prediction_interval_lower_bound | prediction_interval_upper_bound | ai_forecast_status |
+---------------------+--------------------------+------------------+------------------+---------------------------------+---------------------------------+--------------------+
| Subscriber          | 2018-05-01 00:00:00 UTC  | 26.3045959...    |            0.95  | 21.7088378...                   | 30.9003540...                   |                    |
+---------------------+--------------------------+------------------+------------------+---------------------------------+---------------------------------+--------------------+
| Subscriber          |  2018-05-01 01:00:00 UTC | 34.0890502...    |            0.95  | 2.47682913...                   | 65.7012714...                   |                    |
+---------------------+-------------------+------------------+-------------------------+---------------------------------+---------------------------------+--------------------+
| Subscriber          |  2018-05-01 02:00:00 UTC | 24.2154693...    |            0.95  | 2.87621605...                   | 45.5547226...                   |                    |
+---------------------+--------------------------+------------------+------------------+---------------------------------+---------------------------------+--------------------+
| ...                 | ...                      |  ...             | ...              | ...                             |  ...                            |                    |
+---------------------+--------------------------+------------------+------------------+---------------------------------+---------------------------------+--------------------+