Este guia mostra como investigar um alerta usando o Google Security Operations.
O que é um alerta?
Um alerta é um indicador de comprometimento (IOC), sinalizado pelo Google Security Operations,
indicando uma anomalia no fluxo de trabalho normal de tráfego na empresa.
Investigue os alertas como uma possível violação de segurança.
Como os alertas chegam ao Google Security Operations?
O Google Security Operations usa várias fontes externas na comunidade de segurança com bancos de dados do setor atualizados continuamente. As Operações de segurança do Google
também têm uma linguagem de programação rica em recursos, a YARA-L, para que você possa criar suas próprias regras personalizadas.
Você pode realizar essas etapas na instância do Google Security Operations da sua empresa ou no ambiente de demonstração do Google Security Operations.
O Google Security Operations foi criado para funcionar exclusivamente com os navegadores Google Chrome ou Mozilla Firefox.
O Google recomenda atualizar seu navegador para a versão mais recente. Baixe a versão mais recente do Chrome em https://www.google.com/chrome/.
O Google SecOps está integrado à sua solução de Logon único (SSO).
Você pode fazer login no Google SecOps usando as credenciais fornecidas pela sua empresa.
Abra o Chrome ou o Firefox.
Verifique se você tem acesso à sua conta corporativa.
Para acessar o aplicativo Google SecOps, em que customer_subdomain é seu identificador específico do cliente, acesse:
https://customer_subdomain.backstory.chronicle.security.
Ver alertas e correspondências de IOC
Na barra de navegação, selecione Detecção > Alertas e IOCs.
As guias "Alertas" e "Correspondências de IOC" são exibidas. Talvez seja necessário ajustar o período usando o controle de calendário no canto superior direito para que as correspondências e os alertas apareçam.
Mudar para a visualização de recursos
Em seguida, detalhe um recurso específico que pode ter sido comprometido.
Na guia "Correspondências de IOC", clique em um domínio para abrir a visualização de domínio.
Selecione a guia "Linha do tempo".
Para mudar para a visualização de recursos, clique no horário de um evento. A visualização de recursos mostra detalhes do recurso selecionado na linha do tempo do acionador de alerta, conforme mostrado na figura a seguir.
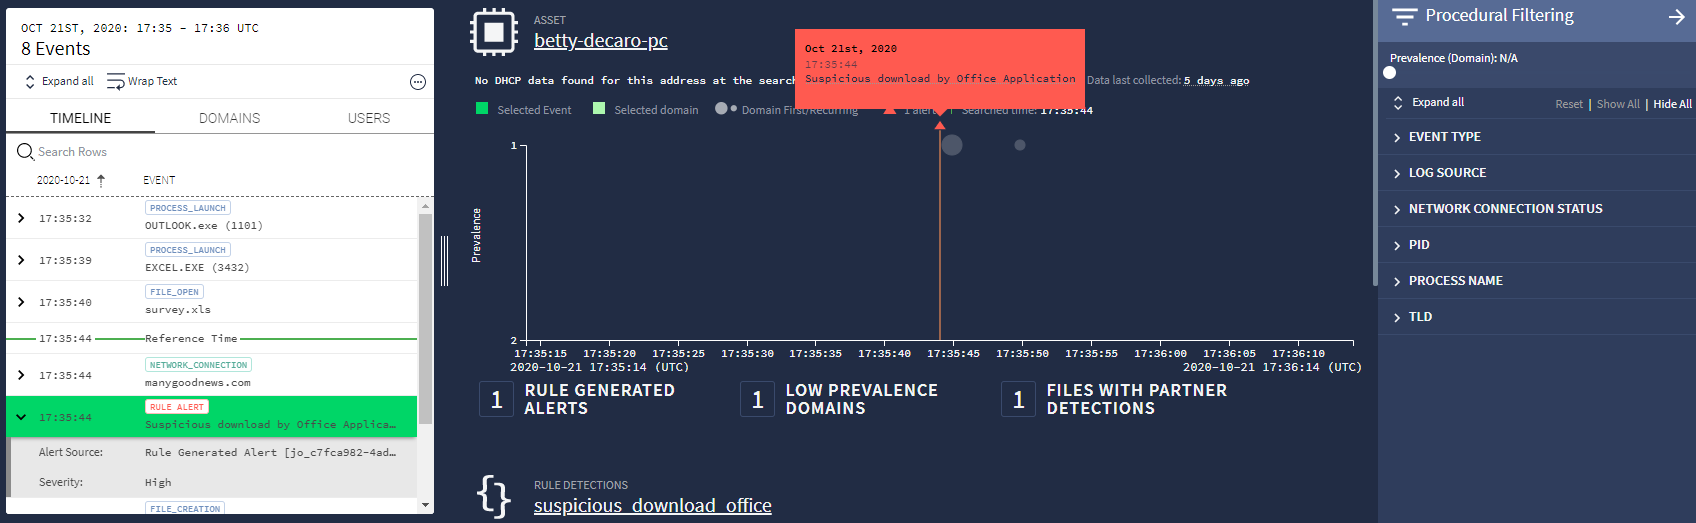
Visualização de recursos
As bolhas na janela principal representam a prevalência do recurso. O gráfico é organizado para que os eventos que ocorrem com menos frequência fiquem na parte de cima. Esses eventos de baixa prevalência são considerados suspeitos. Use o controle deslizante de tempo no canto superior direito para aumentar o zoom nos eventos que precisam ser investigados.
Se o menu "Filtragem procedural" não estiver visível, abra-o clicando no ícone Filtro (perto do canto superior direito).
Na parte de cima do menu, ajuste o controle deslizante Prevalência para filtrar eventos comuns. Usando os controles deslizantes "Tempo" e "Prevalência" para identificar eventos suspeitos.
Abra o alerta na lista da barra lateral da linha do tempo. No painel à esquerda, selecione a guia "Linha do tempo", que mostra os eventos que ocorrem ao redor do alerta. O evento de acionamento é destacado em verde.
Investigar o que acionou o alerta
Há várias maneiras de ter mais insights sobre o evento de acionamento.
No painel do meio, uma caixa de diálogo laranja pode aparecer acima de um pequeno triângulo laranja indicando a localização do alerta ao longo do tempo. Se a caixa de diálogo não aparecer, passe o cursor sobre o triângulo para que ela seja exibida. A caixa de diálogo contém a data, a hora e a descrição do alerta.
O painel à esquerda na visualização de recursos mostra a guia "Linha do tempo". Se o evento for rotulado como Alerta de regra, ele também vai mencionar uma descrição do alerta.
Ao passar o cursor sobre o evento Alerta de regra, um ícone Expandir aparece no lado direito do evento. Ao clicar nesse ícone, uma nova janela será aberta com mais detalhes sobre o evento no formato UDM, como mostrado na figura a seguir.
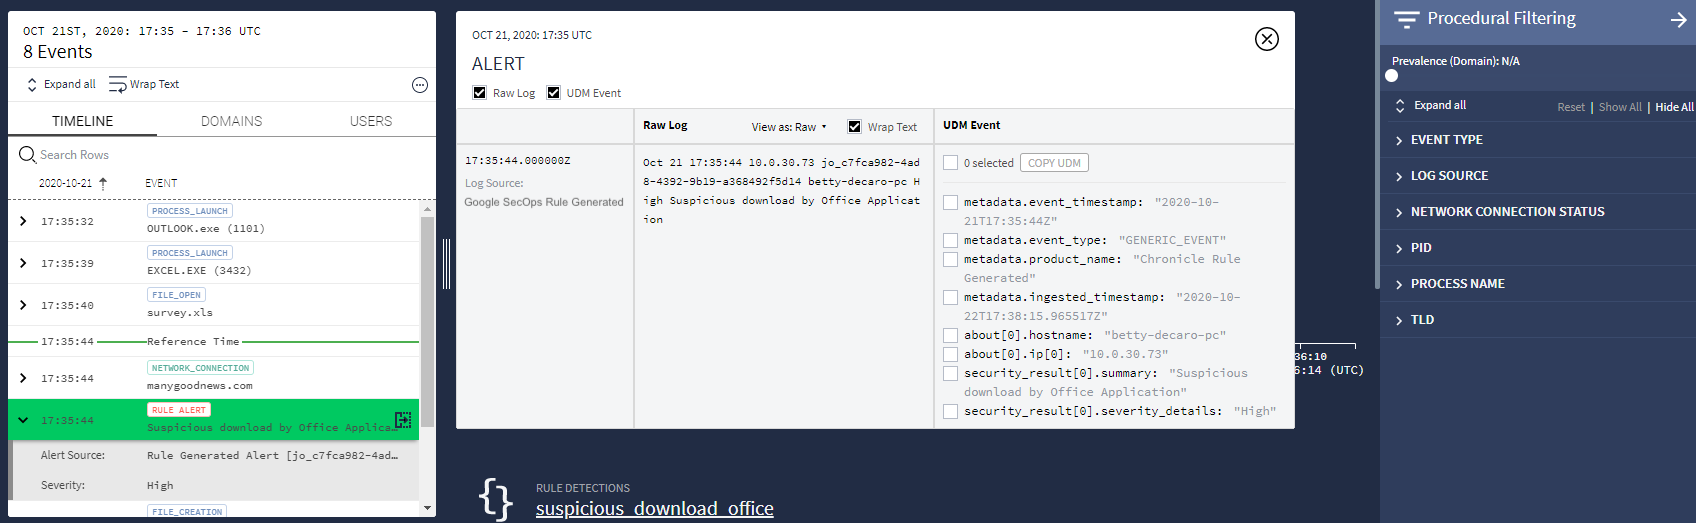
[[["Fácil de entender","easyToUnderstand","thumb-up"],["Meu problema foi resolvido","solvedMyProblem","thumb-up"],["Outro","otherUp","thumb-up"]],[["Difícil de entender","hardToUnderstand","thumb-down"],["Informações incorretas ou exemplo de código","incorrectInformationOrSampleCode","thumb-down"],["Não contém as informações/amostras de que eu preciso","missingTheInformationSamplesINeed","thumb-down"],["Problema na tradução","translationIssue","thumb-down"],["Outro","otherDown","thumb-down"]],["Última atualização 2025-08-21 UTC."],[[["\u003cp\u003eThis guide details how to investigate security alerts within Google Security Operations, which are indicators of potential security breaches identified through various external security sources and custom YARA-L rules.\u003c/p\u003e\n"],["\u003cp\u003eTo begin, access Google Security Operations via Chrome or Firefox using your enterprise credentials, and then navigate to the "Detection > Alerts and IOCs" section to view alerts and IOC matches.\u003c/p\u003e\n"],["\u003cp\u003eFrom the IOC Matches tab, you can pivot to Asset view to investigate specific assets by selecting an event's time and using the Time and Prevalence sliders to filter for suspicious events.\u003c/p\u003e\n"],["\u003cp\u003eThe Asset view's Timeline tab offers details about events surrounding an alert, with the triggering event highlighted in green, and more information available by hovering over "Rule Alert" events and expanding them.\u003c/p\u003e\n"],["\u003cp\u003eAn alert from Google security operations can be investigated to determine what specifically triggered it, by using the middle panel's orange dialog box, or the left panel's Timeline tab description.\u003c/p\u003e\n"]]],[],null,["# Quickstart: Review an alert using Google Security Operations\n\nReview an alert using Google Security Operations\n================================================\n\nSupported in: \nGoogle secops [SIEM](/chronicle/docs/secops/google-secops-siem-toc)\nThis guide shows how to investigate an alert using Google Security Operations.\n\n\u003cbr /\u003e\n\n### What is an alert?\n\nAn [alert](https://cloud.google.com/chronicle/docs/investigation/alerts-iocs) is an Indicator of Compromise (IOC), flagged by [Google Security Operations](https://cloud.google.com/chronicle/docs/overview),\nindicating an anomaly in the normal workflow of traffic within the enterprise.\nYou should investigate alerts as a possible breach of security.\n\n### How do alerts get to Google Security Operations?\n\nGoogle Security Operations taps into various external sources within the security\ncommunity using industry-wide databases updated continuously. Google Security Operations\nalso has a feature-rich programming language, YARA-L, so you can craft your own custom rules.\n\nFor more information on YARA-L, see the [Overview of the YARA-L 2.0 language](/chronicle/docs/detection/yara-l-2-0-overview). For more information on rules, see [Manage Rules Using Rules Editor](/chronicle/docs/detection/manage-all-rules).\n\nBefore you begin\n----------------\n\nYou can perform these steps from your company's Google Security Operations instance or\nfrom the Google Security Operations demo environment.\n\nGoogle Security Operations is designed to work exclusively with the Google Chrome or Mozilla Firefox browsers.\n| **Note:** Google SecOps doesn't support multiple concurrent logins for the same profile.\n\nGoogle recommends upgrading your browser to the most current version. You can download the latest version of Chrome from \u003chttps://www.google.com/chrome/\u003e.\n\nGoogle SecOps is integrated into your single sign-on solution (SSO).\nYou can log in to Google SecOps using the credentials provided by your enterprise.\n\n1. Launch Chrome or Firefox.\n\n2. Ensure you have access to your corporate account.\n\n3. To access the Google SecOps application, where \u003cvar translate=\"no\"\u003ecustomer_subdomain\u003c/var\u003e\n is your customer-specific identifier, navigate to:\n https://\u003cvar translate=\"no\"\u003ecustomer_subdomain\u003c/var\u003e.backstory.chronicle.security.\n\nView Alerts and IOC Matches\n---------------------------\n\nIn the navigation bar, select **Detection \\\u003e Alerts and IOCs**.\n\nThe Alerts and IOC Matches tabs are displayed. You may have to adjust the time\nrange using the calendar control in the top right for matches and alerts to appear.\n\nPivot to Asset view\n-------------------\n\nNext, drill down to a particular asset that may have been compromised.\n\n1. From the IOC Matches tab, click on a domain to open Domain view.\n\n2. Select the Timeline tab.\n\n3. To pivot to Asset view, select an event by clicking on its time. Asset view shows details of the selected asset around the timeline of the alert trigger, as shown in the following figure.\n\n\n **Asset view**\n\n The bubbles in the main window represent the prevalence of the asset. The graph is arranged so events occurring less often are at the top. These low-prevalence events are considered suspicious. Use the Time slider in the upper right to zoom in to events requiring investigation.\n4. If the Procedural Filtering menu is not visible, open it by clicking the *Filter* icon (near the upper right corner).\n\n5. At the top of the menu, adjust the **Prevalence** slider to filter out common events. Using the Time and Prevalence sliders, to identify suspicious events.\n\n6. Open the alert from the Timeline sidebar list. In the left panel, select the Timeline tab which display events occurring around the alert. The triggering event is highlighted in green.\n\nInvestigate what triggered the alert\n------------------------------------\n\nThere are several ways to gain more insight into the triggering event.\n\n- In the middle panel, an orange dialog box may appear above a small orange triangle indicating the location, in time, of the alert. If the dialog box is not displayed, hovering over the triangle causes it to appear. The dialog contains the date, time, and description of the alert.\n\n- The left panel in Asset view shows the Timeline tab. If the event is labeled *Rule Alert*, it will also mention a description of the alert.\n\n- Hovering over the *Rule Alert* event causes an *Expand* icon to appear on the right side of the event. Clicking on this icon will open a new window with more details about the event in UDM format, as shown in the following figure.\n\n\n **Event Details**\n\n**Need more help?** [Get answers from Community members and Google SecOps professionals.](https://security.googlecloudcommunity.com/google-security-operations-2)"]]