Collect SOAR logs
This document describes how to use Google Cloud Logs Explorer to manage and monitor SOAR logs.
The integration provides the following key capabilities:
Centralized monitoring: View and analyze essential data captured from the Google SecOps SOAR platform's ETL, Playbook, and Python functions (for example, Python script execution, alert ingestion, and playbook performance).
Custom metrics and alerting: Use Google Cloud tools to configure custom metrics and alerts based on specific events recorded in the Google SecOps SOAR operational logs.
Set up SOAR logs
To set up the SOAR logs, follow these steps:
- Create a Service Account in the Google Cloud project where you plan to view the logs. For details, see Create and manage service accounts.
- Go to IAM & Admin > IAM.
Locate the Service Account you created and click edit Edit principal.
In the Assign Roles section, select Logs Writer. For more information, see the predefined Logs Writer role.
Click Save.
Select Service Accounts and select your created service account.
Click more_vert More and select Manage Permissions.
In the Permissions section, click Grant Access.
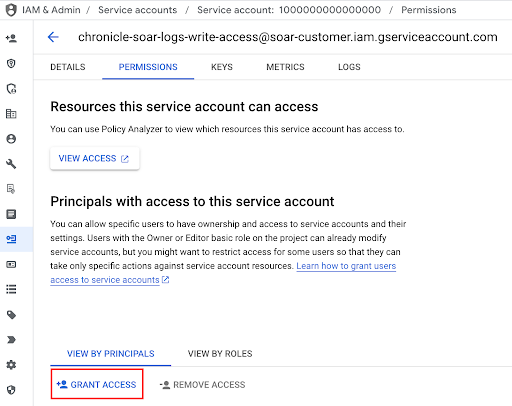
In the Add Principal section, add the following principal:
gke-init-backgroundservices@{SOAR-GCP-Project-Id}.iam.gserviceaccount.com- If you don't know the
SOAR_GCP_Project_Id, submit a ticket through Google Support.
- If you don't know the
In Assign Roles, select Service Account Token Creator. For more information, see Service Account Token Creator.
Click Save.
Provide the name of the configured Service Account to the Google SecOps support team.
SOAR logs
SOAR logs are written in a separate namespace, called
chronicle-soar, and are categorized by the service that generated the log.
Because the logs are generated by a background job, you must configure this job first to send the logs to Google Cloud:
To access SOAR logs, do the following:
- In the Google Cloud console, go to Logging > Logs Explorer.
- Select the Google SecOps Google Cloud project.
Enter the following filter in the box and click Run Query:
resource.labels.namespace_name="chronicle-soar"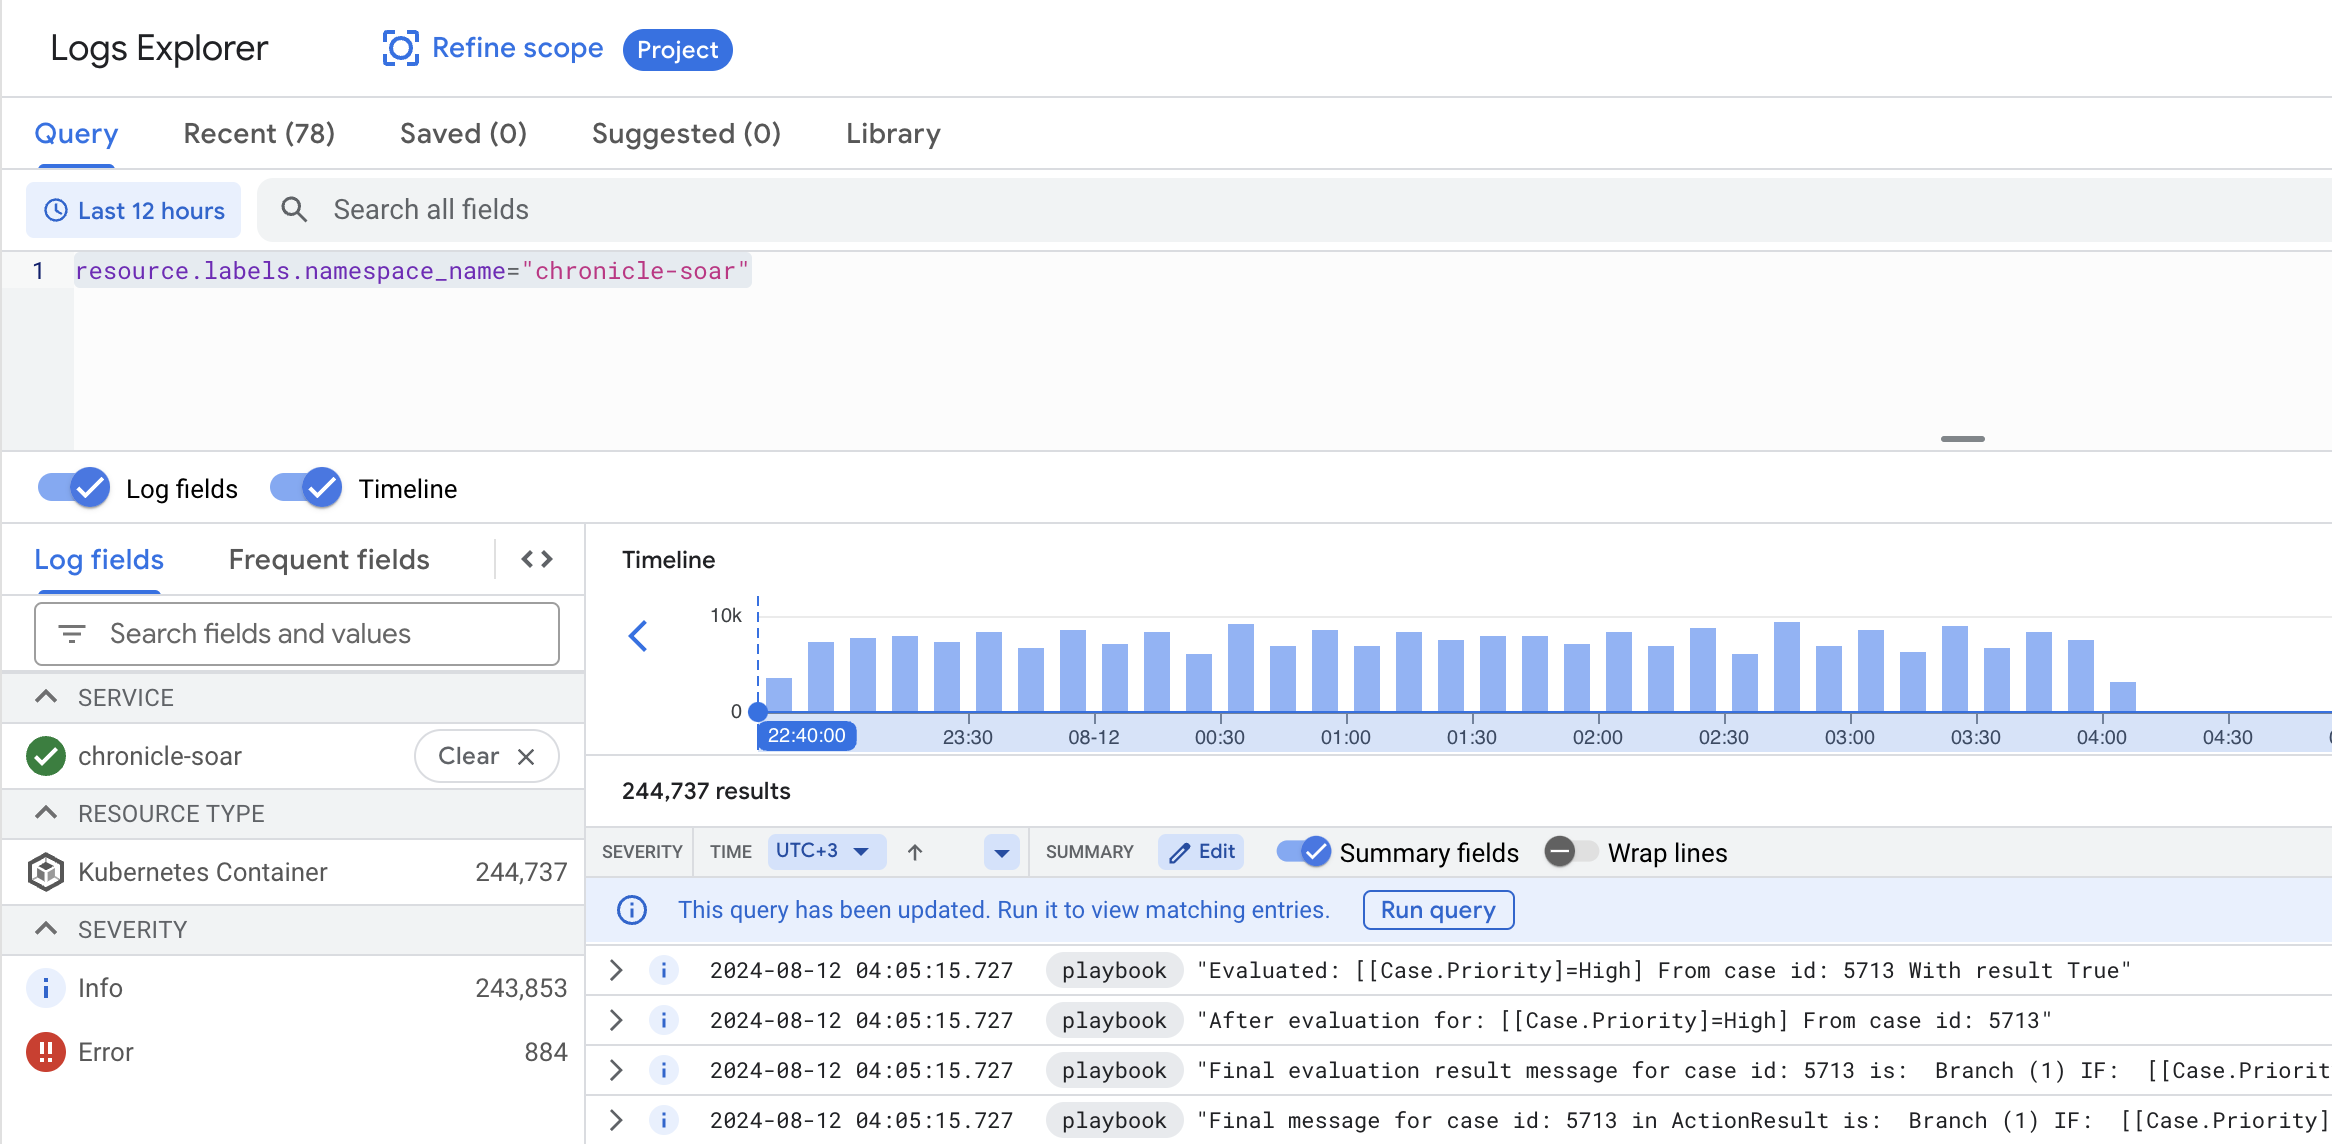
To filter logs from a specific service, enter the following syntax in the query box and click Run Query:
    resource.labels.namespace_name="chronicle-soar"
    resource.labels.container_name="<container_name>"
Replace
<container_name>with the relevant service container:playbook,python, oretl.
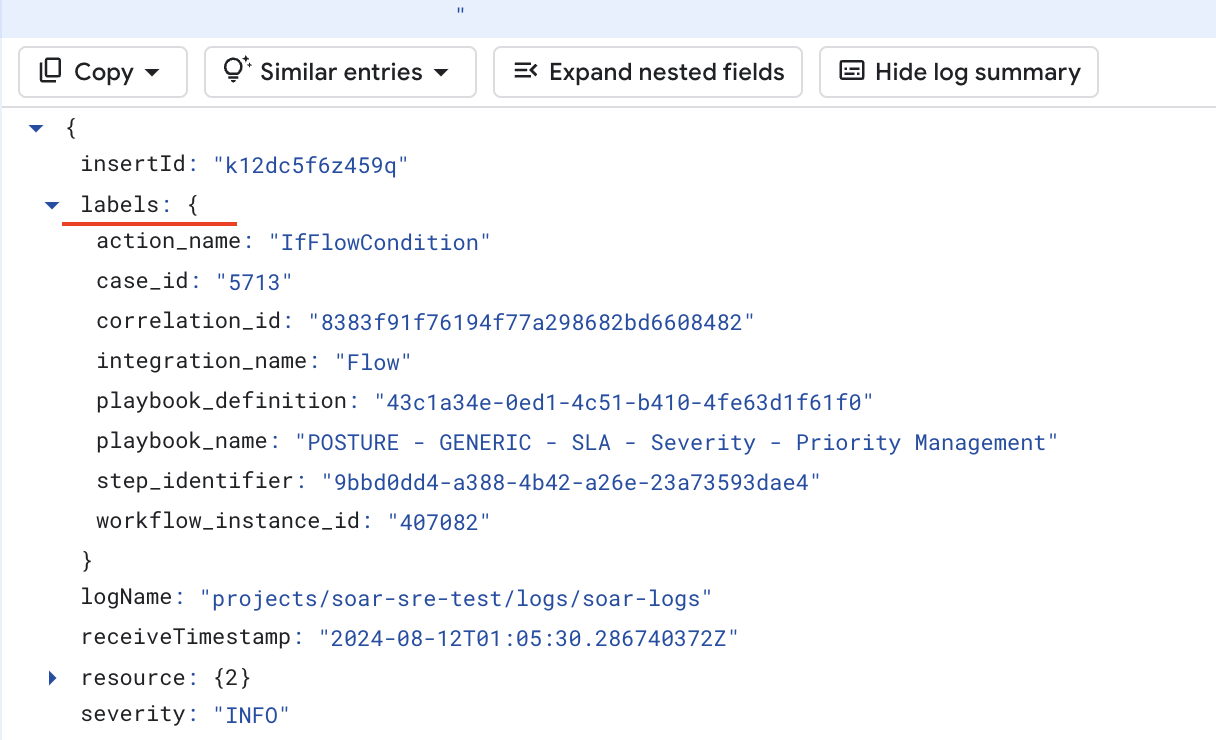
Playbook log labels
Playbook log labels provide a more efficient and convenient way to refine a query
scope. All labels are located in the Labels section of each
log message.
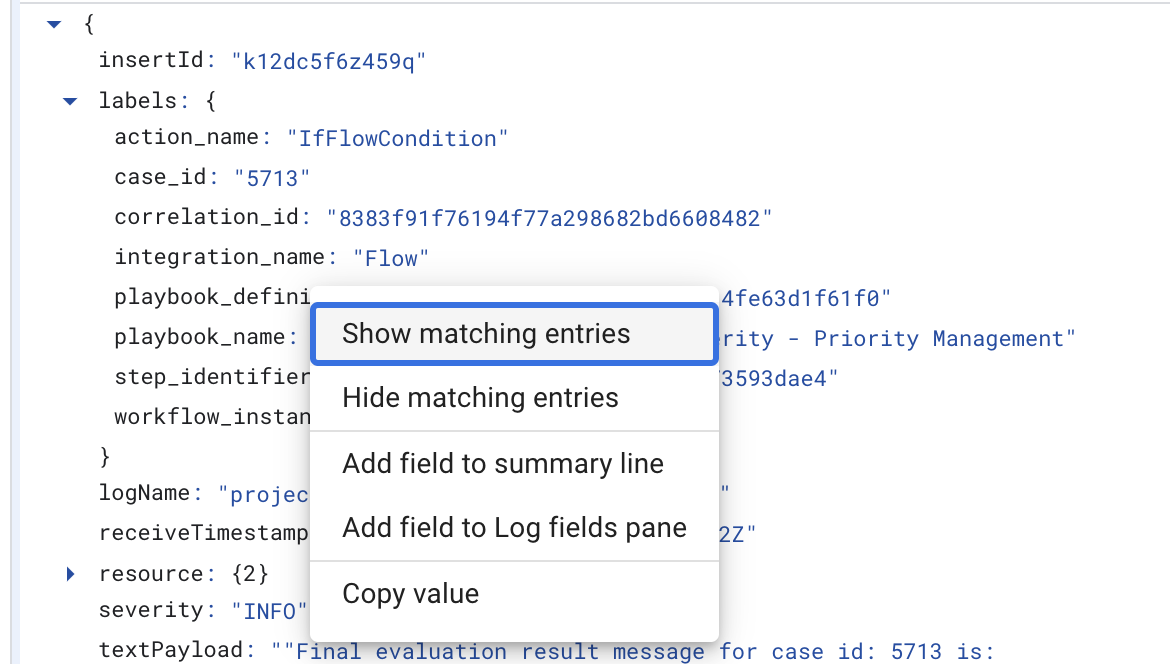
To narrow the log scope, expand the log message, right-click each label, and hide or show specific logs:
The following labels are available:
playbook_nameplaybook_definitionblock_nameblock_definitioncase_idcorrelation_idintegration_nameaction_name
Python logs
The following logs are available for Python service:
```none
resource.labels.container_name="python"
```
Integration and connector labels:
integration_nameintegration_versionconnector_nameconnector_instance
Job labels:
integration_nameintegration_versionjob_name
Action labels:
integration_nameintegration_versionintegration_instancecorrelation_idaction_name
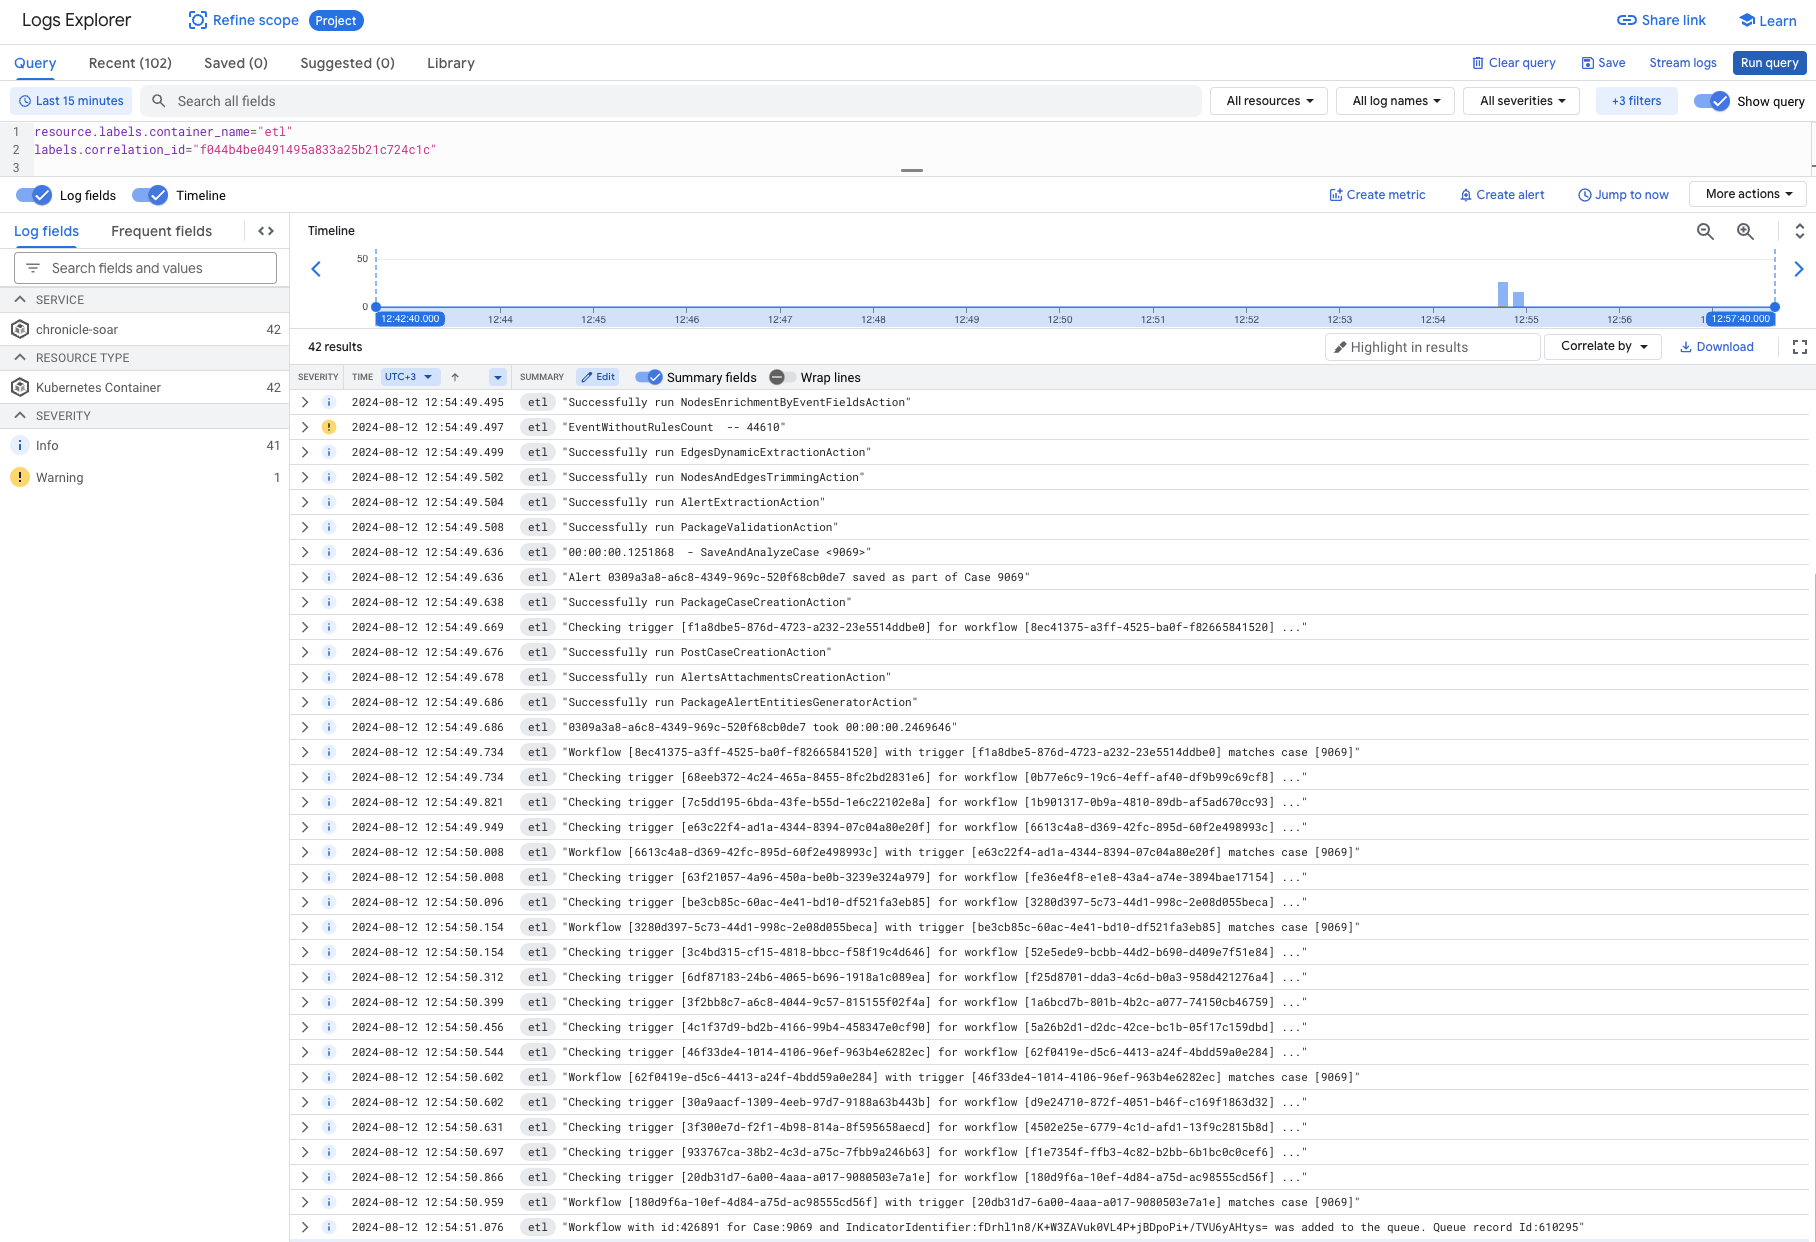
ETL logs
The following logs are available for ETL service:
```none
resource.labels.container_name="etl"
```
ETL labels
correlation_id
For example, to provide the ingestion flow for an alert, filter by
correlation_id:
Need more help? Get answers from Community members and Google SecOps professionals.