Search for events and alerts
The search function lets you find Unified Data Model (UDM) events and alerts in your Google Security Operations instance using YARA-L 2.0 syntax. Search includes options to refine and navigate through your UDM data. You can search for individual UDM events and groups of UDM events that match the same query.
On systems that use data RBAC, you can only see data that matches your scopes. For more information, see data RBAC impact on Search.
For Google SecOps customers, alerts can also be ingested from connectors and webhooks. You can use search to find these alerts as well.
For more information about UDM, see Format log data as UDM and UDM field list.
Access search
You can access Google SecOps search using the following options:
On the navigation bar, click Investigation > Search.
In the Search field, enter a valid UDM field for any search field in Google SecOps, and then press CTRL+Enter.
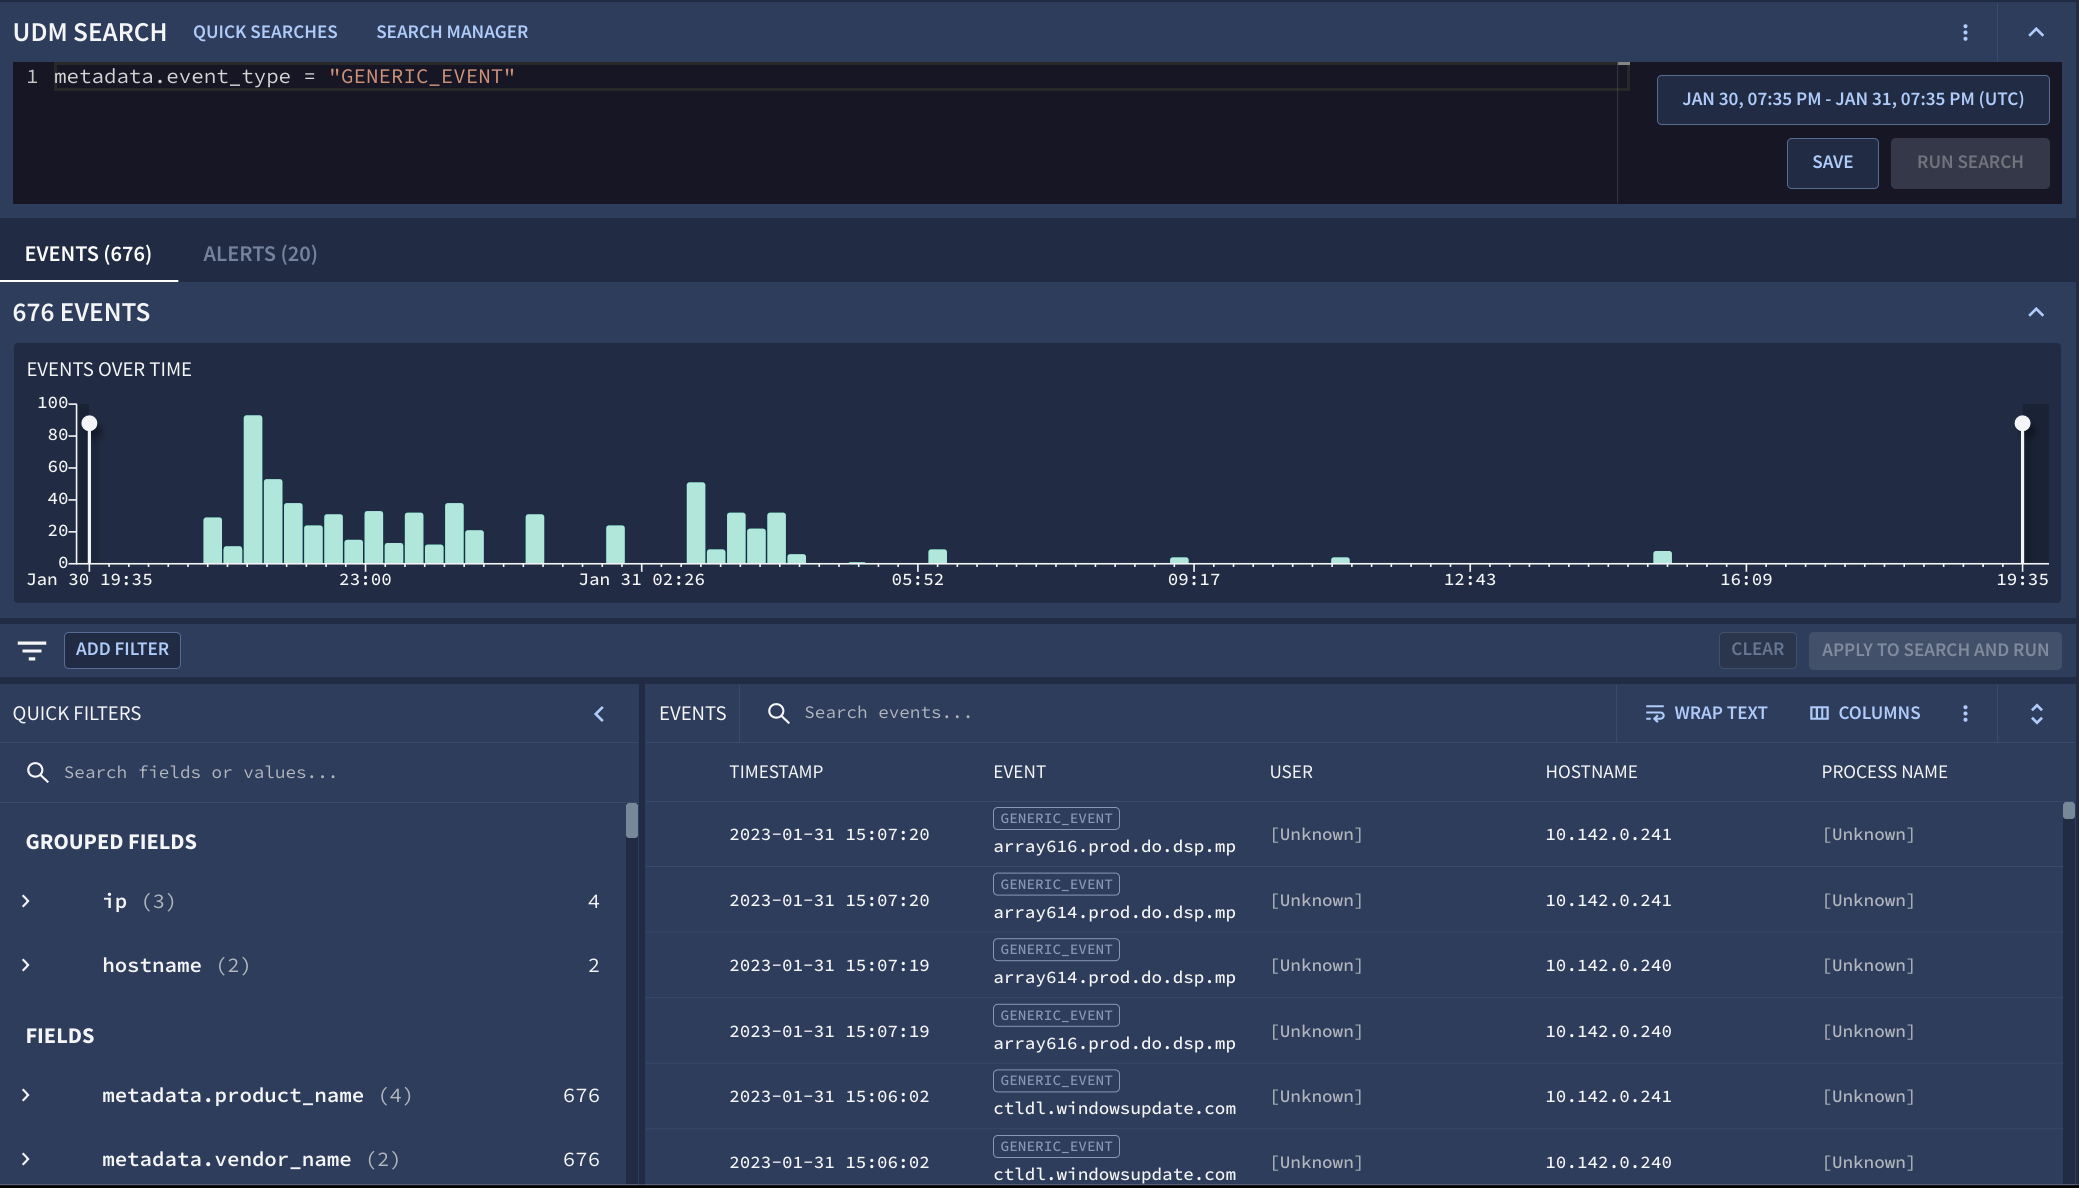
Figure 1. Example of the Search window used to explore event trends.
The following sections detail how to use the search features.
Use the search feature
A search expression consists of a UDM field to search, an operator, and a data value to search for.
If the query expression is valid, the Google SecOps console enables the Run search button.
UDM queries are based on fields defined in the Unified Data Model field list. You can browse and select these UDM fields using Filters or Raw Log Search.
To adjust the number of events returned, click More and select Search Settings. For details, see Search settings.
To change the data range, open the Date range window.
To use the search feature, complete the following steps:
- Go to the Search page.
- In the Search field, enter a search expression.
- To search for events, enter a UDM field name in the Search field. As you type, the automatic completion feature suggests valid UDM fields based on your input.
Once you have entered a valid UDM field, select a valid operator. The user interface displays the available valid operators based on the UDM field you entered. The following operators are supported:
<, ><=, >==, !=nocase-- supported for strings
After you enter a valid UDM field and operator, add the log data value you want to search for. For details, see Format the data value to search for.
Click Run search to run your search.
The event results are displayed in the Events timeline table on the Search page.
Optional: Narrow the results by adding additional UDM filters manually or using the console.
Format the data value to search for
Format the data value using the following guidelines:
Data type: Format the data value based it's the data type:
Enumerated values: Use a valid enumerated value defined for the selected UDM field.
For example: A text value, all caps enclosed in double quotes:
metadata.event_type = "NETWORK_CONNECTION"Additional values: Use the
field[key\] = valueformat to search withinadditionalandlabelsfields.For example:
additional.fields["key"]="value"Boolean values: Use
trueorfalse(case-insensitive, no quotes needed).For example:
network.dns.response = trueIntegers: Use numeric values without quotes.
For example:
target.port = 443Float values: For UDM fields of the
floattype, enter a decimal value, such as3.1, or an integer, such as3.For example:
security_result.about.asset.vulnerabilities.cvss_base_score = 3.1Regular expressions: Enclose the regular expression between forward slashes (/).
For example:
principal.ip = /10.*/Search for the execution of
psexec.exe(Window):target.process.command_line = /\bpsexec(\.exe)?\b/ nocase
For details about regular expressions, see the regular expressions page.
Strings: Enclose text values in double quotes.
For example:
metadata.product_name = "Google Cloud VPC Flow Logs"
Case-insensitive strings: Use the
nocaseoperator to match any combination of uppercase and lowercase characters in a string.For example:
principal.hostname != "http-server" nocaseprincipal.hostname = "JDoe" nocaseprincipal.hostname = /dns-server-[0-9]+/ nocase
Escape characters in strings: Escape special characters with a backslash, as follows:
- Use
\\to escape a backslash (\). - Use
\"to escape a double quote (").
For example:
principal.process.file.full_path = "C:\\Program Files (x86)\\Google\\Application\\chrome.exe"target.process.command_line = "cmd.exe /c \"c:\\program files\\a.exe\""
- Use
Boolean expressions: Use
AND,OR, andNOTto combine conditions and narrow results.The following examples show supported boolean operators (
AND,OR, andNOT):A AND BA OR BUse parentheses ( ) to group expressions and control evaluation order:
(A OR B) AND (B OR C) AND (C OR NOT D)
Examples:
Search for login events on the finance server:
metadata.event_type = "USER_LOGIN" and target.hostname = "finance-svr"Use the operator (>) to search for connections where more than 10 MB of data was sent:
metadata.event_type = "NETWORK_CONNECTION" and network.sent_bytes > 10000000Use multiple conditions to search for
winword.exelaunchingcmd.exeorpowershell.exe:metadata.event_type = "PROCESS_LAUNCH" and principal.process.file.full_path = /winword/ and (target.process.file.full_path = /cmd.exe/ or target.process.file.full_path = /powershell.exe/)
Search key-value pairs in
additionalandlabelsfields:The
additionalandlabelsfields act as customizable containers for event data that doesn't map to standard UDM fields. Each entry stores a single key-value pair.additionalfields may contain multiple key-value pairs.labelsfields can only contain a single key-value pair.
Use this syntax to specify the key-value pairs to search in the
additionalandlabelsfields:field[key\] = value.For example:
additional.fields["key"]="value"Examples of searches using specific key-value pairs in the
additionalandlabelsfields:Search for events containing specified key-value pairs:
additional.fields["pod_name"] = "kube-scheduler"metadata.ingestion_labels["MetadataKeyDeletion"] = "startup-script"
Use the
ANDoperator with key-value pair searches:additional.fields["pod_name"] = "kube-scheduler" AND additional.fields["pod_name1"] = "kube-scheduler1"Search for all events that contain the specified key, regardless of the value:
additional.fields["pod_name"] != ""Search for events that contain a specific key, using a regular expression:
additional.fields.value.string_value = "mystring"Search for events that use multiple keys with the same name, using a regular expression:
additional.fields.key = /myKeynumber_*/Use regular expressions and the
nocaseoperator:additional.fields["pod_name"] = /br/additional.fields["pod_name"] = bar nocase
Use block and single-line comments.
Use a block comment:
  additional.fields["pod_name"] = "kube-scheduler"
  /*
  Block comments can span
  multiple lines.
  */
  AND additional.fields["pod_name1"] = "kube-scheduler1"
Use a single-line comment:
additional.fields["pod_name"] != "" // my single-line comment
Search settings
You can set the maximum number of search results in UDM Search settings. These settings are user-specific.
Click Search settings from the More next to Run search.
Select Max Results to Return. The options are
1K,30K,100K,1Mandcustom, which can take values between1and1M. The default value is1M. Queries usually run faster when you choose a smaller result set size.
Search returns too many results
If your search is too broad, Google SecOps displays a warning message indicating that not all search results can be shown.
In such cases, the system retrieves only the latest results, up to the search limit of 1M events and 1,000 alerts. However, there may be many more matching events and alerts that are not displayed.
To capture all relevant results, refine your search by applying additional filters.
- Narrow the time range to reduce the dataset size.
- Use specific search queries or filters instead of broad terms.
- Query precise UDM fields instead of grouped fields when you need results for a single field.
The search results page displays the latest 10,000 results. You can filter and refine the search results to display the older results, as an alternative to modifying and rerunning the search.
Limit results
You can limit search results by adding the limit keyword with the maximum
number of search results you want to display. This is useful for generating
quick previews of data, performance optimization, or when you only need a subset
of the results.
For example, if you add the following to your search, it limits the results to a maximum of 25:
limit: 25
Navigate search results using pagination
To improve browser stability and performance when loading a large number of results, Google SecOps provides paginated search results.
Use the Rows per page list, on the Events table, to select the number of rows to display per page (25 to 1,000 events). This pagination applies only to the 10,000 results displayed in the table.
25 to 1,000 events. This pagination applies to the 10,000 results displayed in the table.
Search grouped fields
Grouped fields are aliases for groups of related UDM fields. You can use them to query multiple UDM fields at the same time without typing each field individually.
The following example shows how to enter a query to match the common UDM fields that might contain the specified IP address:
ip = "1.2.3.4"
You can match a grouped field using a regular expression and using the nocase
operator. Reference lists are also supported. Grouped fields can also be used in
combination with regular UDM fields as shown in the following example:
ip = "5.6.7.8" AND metadata.event_type = "NETWORK_CONNECTION"
Grouped fields have a separate section in Aggregations.
Types of grouped UDM fields
You can search across all of the following grouped UDM fields:
| Grouped field name | Associated UDM fields |
| domain | about.administrative_domain about.asset.network_domain network.dns.questions.name network.dns_domain principal.administrative_domain principal.asset.network_domain target.administrative_domain target.asset.hostname target.asset.network_domain target.hostname |
| intermediary.user.email_addresses
network.email.from network.email.to principal.user.email_addresses security_result.about.user.email_addresses target.user.email_addresses |
|
| file_path | principal.file.full_path
principal.process.file.full_path principal.process.parent_process.file.full_path target.file.full_path target.process.file.full_path target.process.parent_process.file.full_path |
| hash | about.file.md5
about.file.sha1 about.file.sha256 principal.process.file.md5 principal.process.file.sha1 principal.process.file.sha256 security_result.about.file.sha256 target.file.md5 target.file.sha1 target.file.sha256 target.process.file.md5 target.process.file.sha1 target.process.file.sha256 |
| hostname | intermediary.hostname
observer.hostname principal.asset.hostname principal.hostname src.asset.hostname src.hostname target.asset.hostname target.hostname |
| ip | intermediary.ip
observer.ip principal.artifact.ip principal.asset.ip principal.ip src.artifact.ip src.asset.ip src.ip target.artifact.ip target.asset.ip target.ip |
| namespace | principal.namespace
src.namespace target.namespace |
| process_id | principal.process.parent_process.pid
principal.process.parent_process.product_specific_process_id principal.process.pid principal.process.product_specific_process_id target.process.parent_process.pid target.process.parent_process.product_specific_process_id target.process.pid target.process.product_specific_process_id |
| user | about.user.userid
observer.user.userid principal.user.user_display_name principal.user.userid principal.user.windows_sid src.user.userid target.user.user_display_name target.user.userid target.user.windows_sid |
Find a UDM field for search query
While writing a search query, you may not know which UDM field to include. The UDM Lookup lets you quickly find a UDM field name that contains a text string in the name or that stores a specific string value. The UDM Lookup function is not intended to be used to search other data types, such as bytes, boolean, or numeric. You select one or more results returned by UDM Lookup, and use it as a starting point for a Search query.
To use UDM Lookup, do the following:
On the Search page, click UDM Lookup.
In the UDM Lookup dialog, select one or more of the following matching options, to specify the scope of data to search:
UDM Fields: Search for text in UDM field names.
For example:
network.dns.questions.nameorprincipal.ipValues: Search for text in the values assigned to UDM Fields.
For example:
dnsorgoogle.com.
Enter or modify the string in the UDM fields/values Look up field. As you type, search results appear in the dialog.
The results are slightly different when searching in UDM Fields versus Values:
Searching for a text string in UDM field names returns an exact match found at any location in the name.
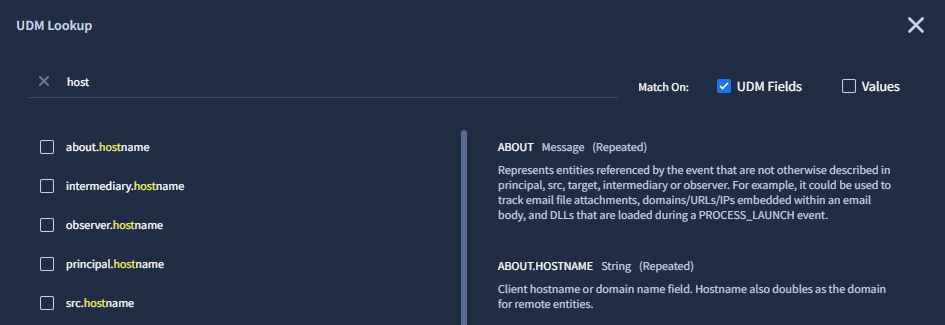
Figure 2. Search within UDM field names in the UDM Lookup.
Searching for text in Values returns results as follows:
- If the string is found at the beginning or end of the value, it is highlighted in the result, along with the UDM field name and the log ingestion time.
- If the text string is found elsewhere in the value, the result displays the UDM field name and the text Possible value match.
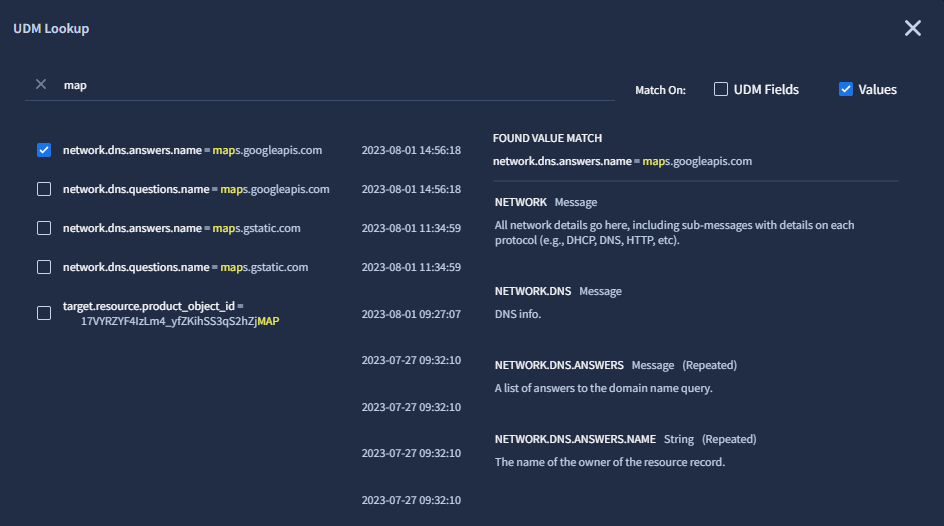
Figure 3. Search within Values in the UDM Lookup.
In the results list, you can perform the following:
Click the name of a UDM field to see a description of that field.
Select one or more results by clicking the checkbox on the left of each UDM field name.
Click the Reset button to deselect all selected fields in the results list.
To append the selected results to the Search field on the Search page, do one of the following:
Click Append to search.
Click Copy UDM to copy the selected results to the clipboard. Then, close the UDM Lookup dialog, and paste the search query string into the Search field on the Search page.
Google SecOps converts the selected results to a search query string as the UDM field name or a name-value pair. If you append multiple results, each result is added to the end of the existing query in the Search field using the
ORoperator.The appended query string is different depending on the type of match returned by UDM Lookup.
If the result matches a text string in a UDM field name, the full UDM field name is appended to the query. For example:
principal.artifact.network.dhcp.client_hostnameIf the result matches a text string at the beginning or end of a value, the name-value pair contains the UDM field name and the complete value in the result. The following are examples:
metadata.log_type = "PCAP_DNS"network.dns.answers.name = "dns-A901F3j.hat.example.com"
If the result includes the text Possible value match, the name-value pair contains the UDM field name and a regular expression containing the search term. For example:
principal.process.file.full_path = /google/ NOCASE
The query string generated by UDM Lookup serves as a starting point for a search query. Edit the Search query on the Search page to fit your use case.
UDM Lookup behavior summary
This section provides more details about UDM Lookup capabilities.
- UDM Lookup searches data ingested after August 10, 2023. Data ingested before this is not searched. It returns results found in unenriched UDM fields. It does not return matches to enriched fields. For information about enriched versus unenriched fields, see View events in the Event Viewer.
- Searches using UDM Lookup are case-insensitive. The term
hostnamereturns the same result asHostName. - Hyphens (
-) and underscores (_) in a query text string are ignored when searching Values. The text stringdns-landdnslboth return the valuedns-l. When searching Values, UDM Lookup does not return matches in the following cases:
Matches in the following UDM fields: metadata.product_log_idnetwork.session_idsecurity_result.rule_idnetwork.parent_session_id
Matches in UDM fields with a full path that ends in one of the following values: .pid
For exampletarget.process.pid..asset_id
For exampleprincipal.asset_id..product_specific_process_id
For exampleprincipal.process.product_specific_process_id..resource.id
For exampleprincipal.resource.id.
When searching Values, UDM Lookup displays Possible value match when a match is found in the following cases:
Matches in the following UDM fields: metadata.descriptionsecurity_result.descriptionsecurity_result.detection_fields.valuesecurity_result.summarynetwork.http.user_agent
Matches in fields with a full path that ends in one of the following values: .command_line
For exampleprincipal.process.command_line..file.full_path
For exampleprincipal.process.file.full_path..labels.value
For examplesrc.labels.value..registry.registry_key
For exampleprincipal.registry.registry_key..url
For exampleprincipal.url.
Matches in fields with a full path that begins with the following values: additional.fields.value.
For exampleadditional.fields.value.null_value.
View alerts in search
To view alerts, click the Alerts tab, located next to the Events tab, at the top right of the Search page.
How alerts are surfaced
Google SecOps evaluates the events returned in search against events that exist for alerts in the customer environment. When a search query event matches an event present in an alert, it is displayed in the Alert timeline and the resulting Alert table.
Definition of events and alerts
An event is generated from a raw log source that is ingested into Google SecOps and processed by Google SecOps's ingestion and normalization process. Multiple events can be generated from a single raw log source record. An event represents a set of security-relevant data points that are generated from that raw log.
In search, an alert is defined as a YARA-L rule detection with alerting enabled. See running a rule against live data to learn more.
Other sources of data can be ingested into Google SecOps as alerts, such as Crowdstrike Falcon Alerts. These alerts don't surface within search unless they are processed by the Google SecOps Detection Engine as a YARA-L rule.
Events that are associated with one or more alerts are marked with an Alert chip in the Event Timeline. If there are multiple alerts associated with the timeline, the chip displays the numbers of associated alerts.
The timeline displays the latest 1,000 alerts retrieved from search results. When the 1,000 limit is reached, no more alerts are retrieved. To make sure you see all the results relevant to your search, refine your search with filters.
How to investigate an alert
To learn how to use Alert graph and Alert details to investigate an alert, follow the steps outlined in Investigate an alert.
View data table rows in Search
You can view data tables rows directly in Search. When you use a data table in your YARA-L search, the results can reference the data table rows linked to the matching events. These results appear in the Events tab.
Use the Column Manager in Search to choose which data table and columns to display in the results.
Search displays the current state of the data table and its rows when you view the results.
For more information, see Use data tables.
Use reference lists in searches
The process for applying reference lists in Rules can also be used in search. Up to seven lists may be included in a single search query. All types of reference lists (string, regular expression, CIDR) are supported.
You can create lists of any variable you want to track.
For example, you could create a list of suspicious IP addresses:
// Field value exists in reference list
principal.ip IN %suspicious_ips
You can use multiple lists by using AND or OR:
// multiple lists can be used with AND or OR
principal.ip IN %suspicious_ips AND
principal.hostname IN %suspicious_hostnames
Refine the search results
Use the Search page features to filter and refine results, as an alternative to modifying and rerunning the search. For example:
Optimized results view
To maximize the space available for viewing search results, Google SecOps provides an event-focused view. When you run a query, the search editor panel automatically collapses to provide more space for the results.
You can also hide the Charts and Aggregations panels by default by clearing the related checkboxes in the View Options list. To make the panels visible again, select the same checkboxes in the list.
Timelines chart
The Timelines chart provides a graphical representation of the number of events and alerts occurring each day that are being surfaced by the current search. Events and alerts are displayed on the same timeline chart, which is available in both the Events and Alerts tab.
The width of each bar depends on the time interval searched. For example, each bar represents 10 minutes when the search spans 24 hours of data. This chart is updated dynamically as you modify the existing search.
Time range adjustment
Move the slider controls to adjust the chart's time range. When you adjust the time range, the UDM Fields and Values and Events tables update to reflect your selection. You can also click any bar in the histogram to apply its time range as a snapshot filter and view events from that period.
After you adjust the time range, the Filtered Events and Query Events checkboxes appear, which lets you further limit the types of events displayed.

Figure 4. Events timelines chart with time range controls.
Aggregations window
The Aggregations window displays Grouped Fields and UDM Fields generated by your UDM search. Grouped Fields are used to search across multiple UDM Fields of a similar type.
A Grouped Field, for example, ip, namespace, or user, is a placeholder
variable that groups the values of similar UDM fields. For example, the
namespace grouped field groups all the values from the following UDM Fields:
principal.namespace, src.namespace, and target.namespace.
An Events count is displayed for each Grouped Field and UDM Field. The Events count is the number of event records having the same value for that field.
Grouped Fields and UDM Fields are sorted from highest to lowest Events count, and in alphabetical order within the same Events count.
To pin a field to the top of the Aggregations list, click the field's keep Keep icon.

Figure 5. Aggregations help identify high frequency values.
Using Aggregations, you can further narrow your UDM search. You can either scroll through the list of UDM fields or search for specific UDM fields or values using the Search field.
Filter aggregation fields
Use filter options to narrow the list of UDM fields displayed in the Aggregations list, as follows:

Figure 6. Example of events that include the selected UDM field value.
Select a UDM field in the Aggregations list, to display a list Values for that field.
Select a Value from that list and click the more_vert More menu icon.
Select one of the filter options:
- Show only: Only show events that include the selected UDM field value.
- Filter out: Filter out events that include the selected UDM field value.
- Copy: Copy the UDM field value to your clipboard.
You can add these additional UDM filters to the Filter events field.
Filter events field
The Filter events field displays the filters you've created, and lets you apply them to the Search field, or remove them as needed.
When you click Apply to search and run, the displayed events are filtered based on the displayed additional filters, and the Search field is updated. The search is automatically run again using the same date and time parameters.

Figure 7. Filter events field.
If you click Add filter, a window opens letting you select additional UDM fields.

Figure 8. Filter events window.
View alerts in the Alerts table
You can view alerts by clicking the Alerts tab.
Use Aggregations to sort alerts by:
- Case
- Name
- Priority
- Severity
- Status
- Verdict
This helps you to focus on the alerts that are most important to you.
Alerts are displayed on the same timeframe as the events are in the Events tab. This helps you see the connection between events and alerts.
If you want to learn more about a specific alert, click the alert. An individual Alert detail page opens containing in-depth information about that alert.
View events in the Events table
All filters and controls affect the list of events shown in the Events
table. Click any event to open the Event Viewer, where you can view both the
raw log and the corresponding UDM record. When you click the event's
timestamp, you can then navigate to the associated Asset, IP address,
Domain, Hash, or User view. You can also use the Search field to
find a specific event.
Manage the set of columns in the Events table
This section describes how to manage the set of columns in the Events table.
To configure which columns are shown in the Events table, do the following:
- At the top of the Events table, click Columns to open the Column Manager.
Configure the following:
- Click the filter to specify whether to show non-applicable columns.
- Click the Show Selected toggle to display only the selected columns in the Events Columns tab.
- In the Events Columns tab, select fields from the following collapsible sections:
- Quick Fields: Use quick fields to quickly add the most relevant UDM field for that data type. Select a data type (for example, Hostname), and the most prevalent UDM field for that data type is added as a column (for example, udm.principal.hostname).
- Grouped Fields: Browse related UDM fields. Use grouped fields to find fields grouped together by category.
- All Event Fields: View and select from the full list of event fields.
- All Entity Fields: View and select from the full list of entity fields.
Optional: Click Save to save the column set. Specify a name for the set. Enter a name for the column set, and then click Save again., and click Save again.
Create custom column sets
To use a consistent view when analyzing event data, you can create and save custom column sets.
- In the Column Manager, add or remove the columns to create your customized view.
Arrange the columns, then click Save.
This opens the Save column set dialog.
In the Save column set dialog, select one of these options:
- Save: Enter a new name for your column set.
- Replace: If you have modified a previously saved set, you can overwrite the existing set with your changes.
Click Save.
Load a saved column set
To load a saved set of columns, do the following:
- At the top of the Events table, click Columns to open the Column Manager.
- Select the Columns Sets tab.
- Select the column set to load and click Apply.
Delete a saved column set
To delete a saved set of columns, do the following:
- At the top of the Events table, click Columns to open the Column Manager.
- Select the Columns Sets tab.
- Select the column set, click More > Delete.
Download the displayed events and raw logs
You can download the displayed events—including raw logs—as a CSV file to correlate normalized UDM events with their source logs.
- To download all search results (up to 1 million events), click More and select Download as CSV.
The console displays the exact number of events included.
View events in the Event Viewer
To open the Event Viewer, hold the pointer over an event in the Events table and click the switch_access_2 icon.
The Event Viewer includes these tabs:
Event Fields tab
By default, the Event Fields tab displays UDM event fields in a hierarchical tree structure, which is labeled Selected.
Use the Event Fields tab to do the following:
- View a field definition. Hold the pointer over the field name to view its definition.
- Pin a field for quick access. In the Selected list, select a field, and click keep pin.
. The field is then displayed in the Pinned list. Fields remain in the Selected list, and their hierarchy in the Pinned list is shown in dot-delimited notation with the
udmprefix (for example,udm.metadata.event_type). - Add to columns or copy multiple fields. Select the checkbox next to a node or field, then choose Add to Columns or Copy.
Perform the following actions:
Filters: Apply the following filters to the Selected list:
Show unenriched fields
Show enriched fields
Show additional fields
Show extracted fields
Add to Columns: Add the UDM field as a column.
Copy: To copy the selected UDM fields and UDM values to the system clipboard.
Each UDM field is labeled with an icon indicating whether the field contains enriched or unenriched data. The icon labels are the following:
- U: Unenriched fields contain values populated during the normalization process using data from the original raw log.
E: Enriched fields contain values that Google SecOps populates to provide additional context about artifacts in a customer environment. For more information, see Enrich event and entity data with Google SecOps.
The display of each enriched field can show all associated sources. This information useful for validation and troubleshooting, and may be required for auditing and compliance purposes. You can also filter fields according to their enrichment source.
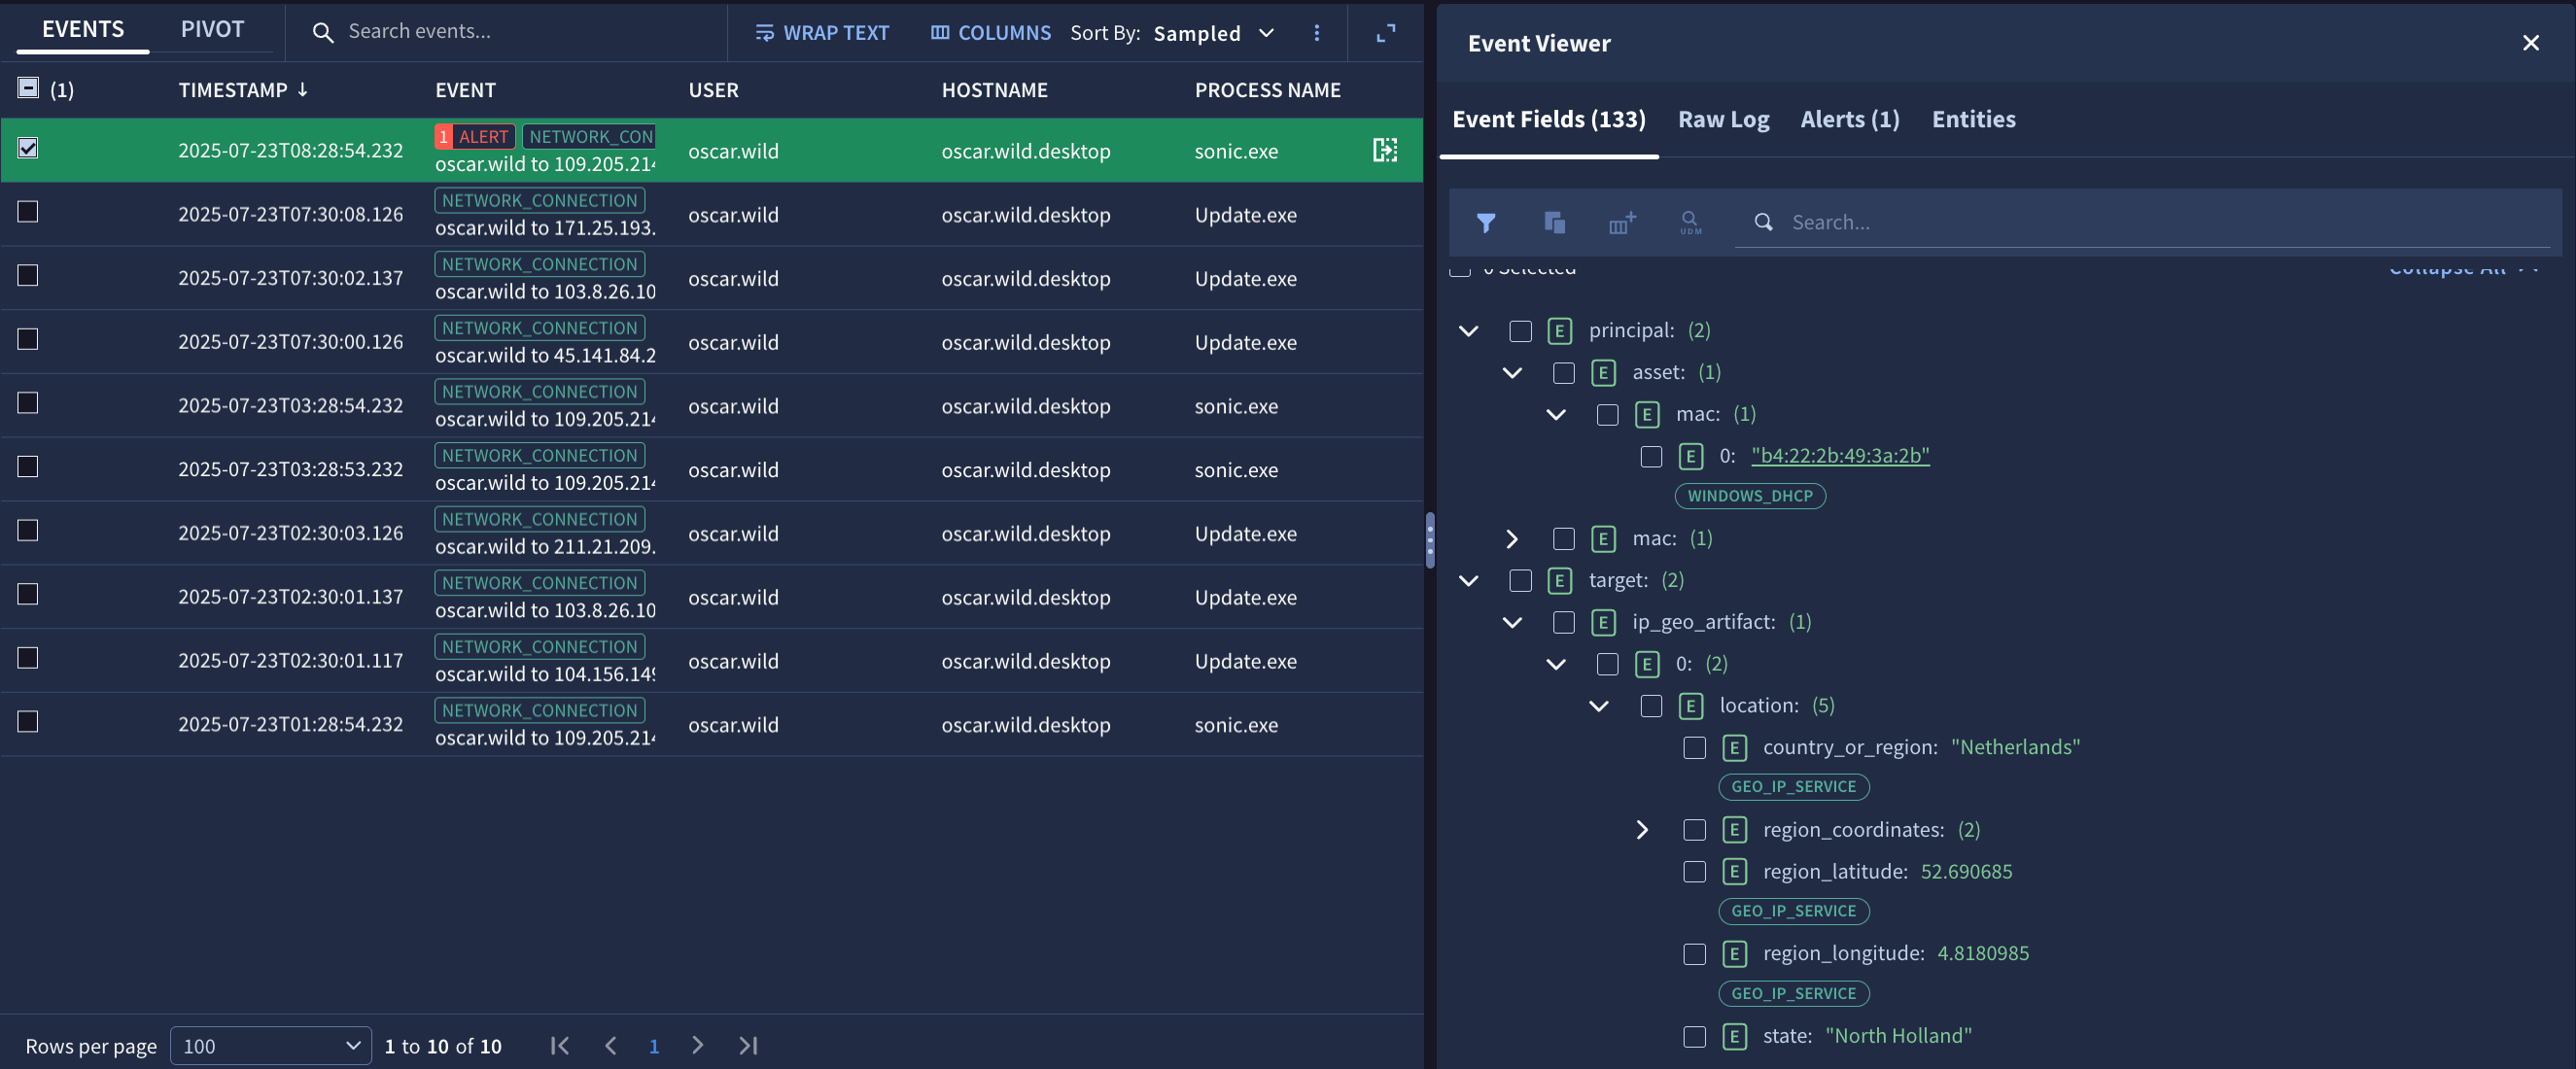
Figure 9. Enriched and unenriched UDM fields in the Event Fields tab of the Event Viewer, showing sources of enriched fields.
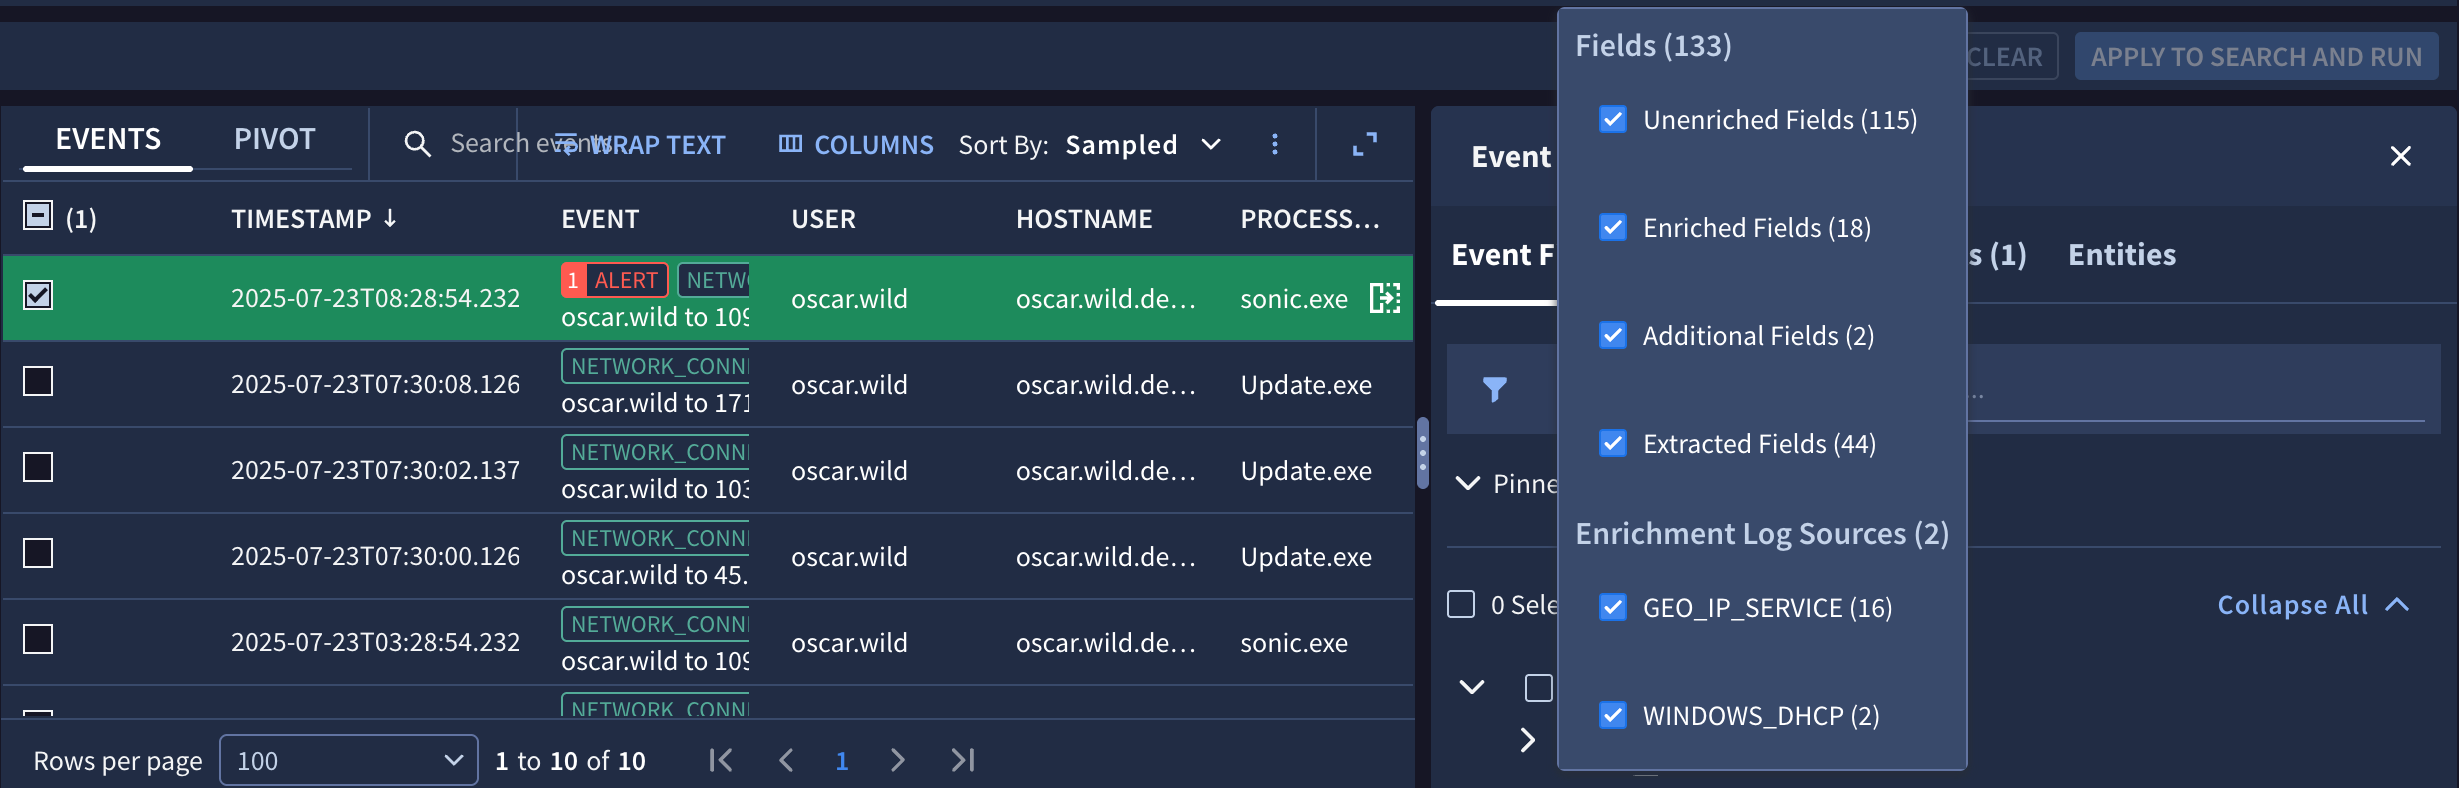
Figure 10. Use the filter in the Event Fields tab to show or hide fields according to various attributes.
Raw Log tab
The Raw Log tab displays the original raw sign in any of the following formats:
- Raw
- JSON
- XML
- CSV
- Hex/ASCII
Alerts tab
The Alerts tab displays the alerts associated with the event.
Entities tab
The Entities tab displays the entities associated with the event.
Click an entity to display the Entity context dialog, which can include the following items:
- Asset name
- First time seen
- Last time seen
- IP addresses
- MAC addresses
- Number of alerts
- Highest alert count by rule
- Alerts-over-time bar graph
- Open Alerts & IOCs link
- View in Alerts Tab link
Use the Pivot Table to analyze events
The Pivot Table lets you analyze events using expressions and functions against the results from the search.
Complete the following steps to open and configure the Pivot Table:
Run a search.
Click the Pivot tab to open the Pivot Table.
Specify a Group by value to group the events by a specific UDM field. You can display the results using the default capitalization or using lowercase only by selecting lowercase from the menu. This option is only available for string fields. You can specify up to five Group by values by clicking Add Field.
If your Group by value is one of the hostname fields, you have the following additional Transform options:
- Top N-Level Domain: Pick which level of the domain to display.
For example, using a value of 1 displays just the top level domain
(such as
com,gov, oredu). Using a value of 3 displays the next two levels of the domain names (such asgoogle.co.uk). - Get Registered Domain: Displays just the registered domain name (such as
google.com,nytimes.com,youtube.com).
If your Group by value is one of the IP fields, you have the following additional Transform options:
- (IP) CIDR Prefix length in bits: You can specify 1 through 32 for IPv4 addresses. For IPv6 addresses, you can specify values up to 128.
If your Group by value includes a timestamp, you have the following additional Transform options:
- (Time) Resolution in milliseconds
- (Time) Resolution in seconds
- (Time) Resolution in minutes
- (Time) Resolution in hours
- (Time) Resolution in days
- Top N-Level Domain: Pick which level of the domain to display.
For example, using a value of 1 displays just the top level domain
(such as
Specify a Value for your Pivot from the list of Fields in your results. You can specify up to five values. After you specify a Field, you must select a Summarize option. You can summarize by the following options:
- sum
- count
- count distinct
- average
- stddev
- min
- max
Specify a value of Event count to return the number of events identified for this particular search and Pivot Table.
The Summarize options are not universally compatible with the Group by fields. For example, the sum, average, stddev, min, and max options can only be applied to numeric fields. If you attempt to associate an incompatible Summarize option with a Group by field, you receive an error message.
Specify one or more UDM fields and select one or more sorts by using the Order by option.
Click Apply when you're ready. The results are displayed in the Pivot Table.
Optional: To download the Pivot Table, click More and select Download as CSV. If you did not select a pivot, this option is disabled.
Saved searches and search history overview
Clicking Search manager lets you retrieve saved searches and view your search history. Select a saved search to view additional information, including the title and description.
Saved searches and search history are:
Stored with your Google SecOps account.
Only viewable and accessible by the individual user unless you use the Share a search feature to share your search with your organization.
Save a search
To save a search, do the following:
From the Search page, click More next to Run search and click Save search to use this search later. This opens the Search manager dialog. We recommend giving your saved search a meaningful name and a plain text description of what you're searching for. You can also create a new search from within the Search manager dialog by clicking Add. Standard UDM editing and completion tools are also available here.
Optional: Specify placeholder variables in the format
${<variable name>}using the same format as is used for variables in YARA-L. If you add a variable to a search, you must also include a prompt to help the user understand the required information to enter before they run the search. All variables must be populated with values prior to a search being run.For example, you could add
metadata.vendor_name = ${vendor_name}to your search. For${vendor_name}, you need to add a prompt for future users, such asEnter the name of the vendor for your search. Each time a user loads this search in the future, they are prompted to enter the vendor name prior to running the search.Click Save Edits when you're finished.
To view saved searches, click Search Manager and then click the Saved tab.
Retrieve a saved search
To retrieve and run a saved search, do the following:
In the Search manager dialog, select a saved search from the list to the left. These saved searches are saved to your Google SecOps account.
Optional: Delete a search by clicking More and selecting Delete search. You can only delete searches you created.
You can change the name of the search and the description. Click Save edits when you're finished.
Click Load search. The search is loaded into the main search field.
Click Run Search to see the events associated with this search.
Retrieve a search from your search history
To retrieve and run a search from your search history, do the following:
In the Search Manager, click History.
Select a search from your search history. Your search history is saved to your Google SecOps account. You can delete a search by clicking Delete.
Click Load search. The search is loaded into the main search field.
Click Run search to see the events associated with this search.
Clear, disable, or enable search history
To clear, disable, or enable search history, do the following:
In Search Manager, click the History tab.
Click More.
Select Clear History to clear the search history.
Click Disable History to disable search history. You have the option to either:
Opt-Out Only: Disable search history.
Opt-Out and Clear: Disable search history and delete the saved search history.
If you have previously disabled search history, you can enable it again by clicking Enable Search History.
Click Close to exit Search Manager.
Share a search
Shared searches let you share searches with your team. In the Saved tab, you can share or delete searches. You can also filter your searches by clicking filter_altFilter next to the search bar and sort searches by Show all, Google SecOps defined, Authored by Me, or Shared.
You cannot edit a shared search that is not your own.
- Click Saved.
- Click the search you want to share.
- Click More on the right side of the search. A dialog with the option to share your search appears.
- Click Share With Your Organization.
- A dialog appears that says Sharing your search will be visible to people in your organization. Are you sure you want to share? Click Share.
If you want the search to only be visible to you, click More and click Stop Sharing. If you stop sharing, only you can use this search.
UDM fields that can or cannot be downloaded to CSV from the platform
Supported and unsupported UDM fields for downloading are shown in the following subsections.
Supported fields
You can download the following fields to a CSV file from the platform:
user
hostname
process name
event type
timestamp
raw log (valid only when raw logs are enabled for the customer)
All fields starting with
udm.additional
Valid field types
You can download the following field types to a CSV file:
double
float
int32
uint32
int64
uint64
bool
string
enum
bytes
google.protobuf.Timestamp
google.protobuf.Duration
Unsupported fields
Fields that start with "udm" (not udm.additional) and meet either of the following conditions cannot be downloaded to CSV:
The nesting of the field is more than 10 deep in udm proto.
The data type is Message or Group.
Factors that limit search results
When conducting UDM searches, the following factors can limit the number of results returned:
Total results exceeded 1M: Search limits results to 1M events. When results exceed 1M, only 1M results are shown.
Limiting results to <1M in the platform through search settings: you can configure the default search result set to return fewer than 1M results, improving query speed. If set to <1M, you see fewer results. By default, SecOps search limits the number of results to 30K, but you can change this to up to 1M using search settings on the Results page.
Search results are limited to 10K: Even if your search returns more than 10,000 results, the console displays only the first 10,000. This limitation of the console doesn't reflect the total number of possible results.
What's next
For information about how to use context-enriched data in search, see Use context-enriched data in search.
Need more help? Get answers from Community members and Google SecOps professionals.