Review an alert using Google Security Operations
What is an alert?
An alert is an Indicator of Compromise (IOC), flagged by Google Security Operations, indicating an anomaly in the normal workflow of traffic within the enterprise. You should investigate alerts as a possible breach of security.
How do alerts get to Google Security Operations?
Google Security Operations taps into various external sources within the security community using industry-wide databases updated continuously. Google Security Operations also has a feature-rich programming language, YARA-L, so you can craft your own custom rules.
For more information on YARA-L, see the Overview of the YARA-L 2.0 language. For more information on rules, see Manage Rules Using Rules Editor.
Before you begin
You can perform these steps from your company's Google Security Operations instance or from the Google Security Operations demo environment.
Google Security Operations is designed to work exclusively with the Google Chrome or Mozilla Firefox browsers.
Google recommends upgrading your browser to the most current version. You can download the latest version of Chrome from https://www.google.com/chrome/.
Google SecOps is integrated into your single sign-on solution (SSO). You can log in to Google SecOps using the credentials provided by your enterprise.
Launch Chrome or Firefox.
Ensure you have access to your corporate account.
To access the Google SecOps application, where customer_subdomain is your customer-specific identifier, navigate to: https://customer_subdomain.backstory.chronicle.security.
View Alerts and IOC Matches
In the navigation bar, select Detection > Alerts and IOCs.
The Alerts and IOC Matches tabs are displayed. You may have to adjust the time range using the calendar control in the top right for matches and alerts to appear.
Pivot to Asset view
Next, drill down to a particular asset that may have been compromised.
From the IOC Matches tab, click on a domain to open Domain view.
Select the Timeline tab.
To pivot to Asset view, select an event by clicking on its time. Asset view shows details of the selected asset around the timeline of the alert trigger, as shown in the following figure.
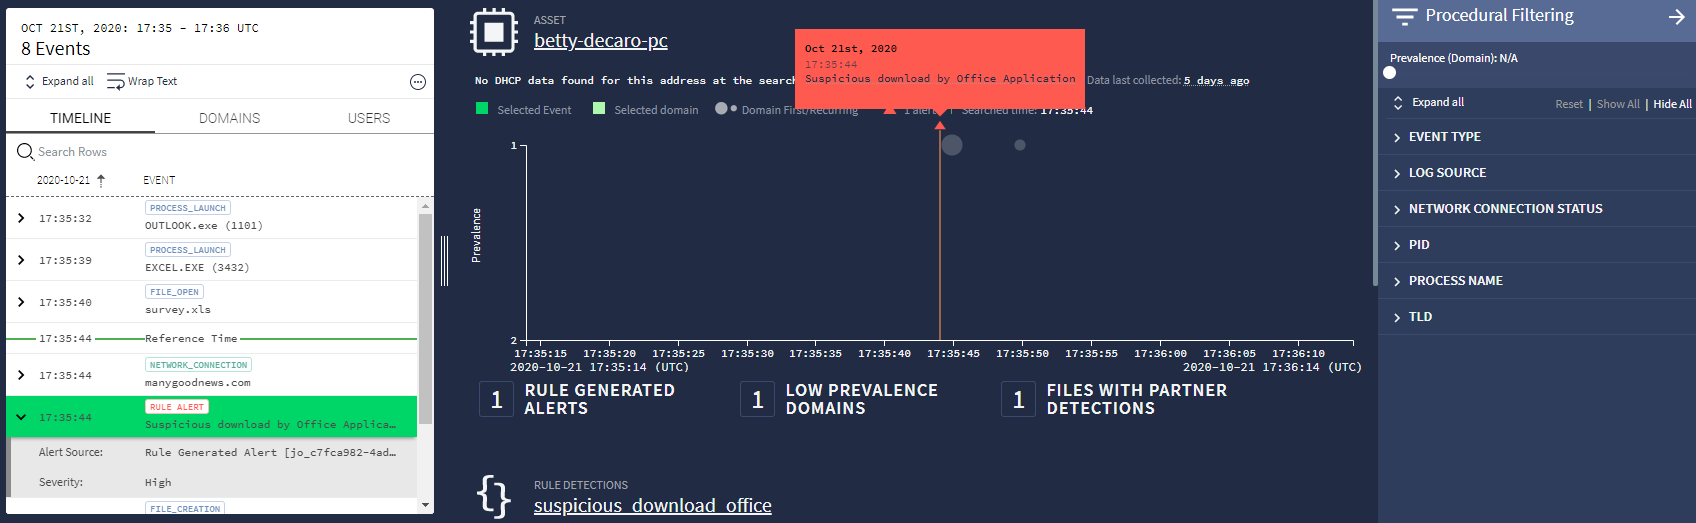 Asset view
The bubbles in the main window represent the prevalence of the asset. The graph is arranged so events occurring less often are at the top. These low-prevalence events are considered suspicious. Use the Time slider in the upper right to zoom in to events requiring investigation.
If the Procedural Filtering menu is not visible, open it by clicking the Filter icon
 (near the upper right corner).
At the top of the menu, adjust the Prevalence slider to filter out common events. Using the Time and Prevalence sliders, to identify suspicious events.
Open the alert from the Timeline sidebar list. In the left panel, select the Timeline tab which display events occurring around the alert. The triggering event is highlighted in green.
Investigate what triggered the alert
There are several ways to gain more insight into the triggering event.
In the middle panel, an orange dialog box may appear above a small orange triangle indicating the location, in time, of the alert. If the dialog box is not displayed, hovering over the triangle causes it to appear. The dialog contains the date, time, and description of the alert.
The left panel in Asset view shows the Timeline tab. If the event is labeled Rule Alert, it will also mention a description of the alert.
Hovering over the Rule Alert event causes an Expand icon
 to appear on the right side of the event. Clicking on this icon will open a new window with more details about the event in UDM format, as shown in the following figure.
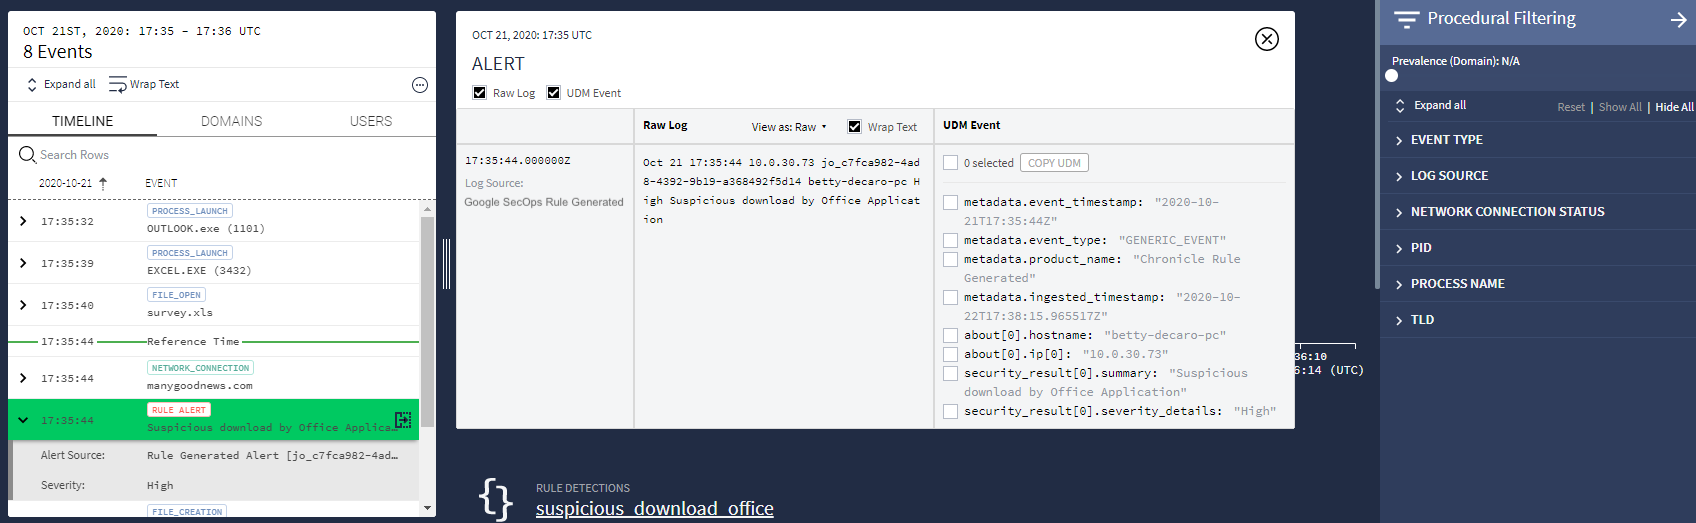 Event Details
Need more help? Get answers from Community members and Google SecOps professionals.