Visualize query results
Use this quickstart to run SQL and visualize your results in a BigQuery notebook:
- Run a query using the
bigquery-public-data.ml_datasets.penguinspublic dataset. - Use a SQL cell to iterate on your query results.
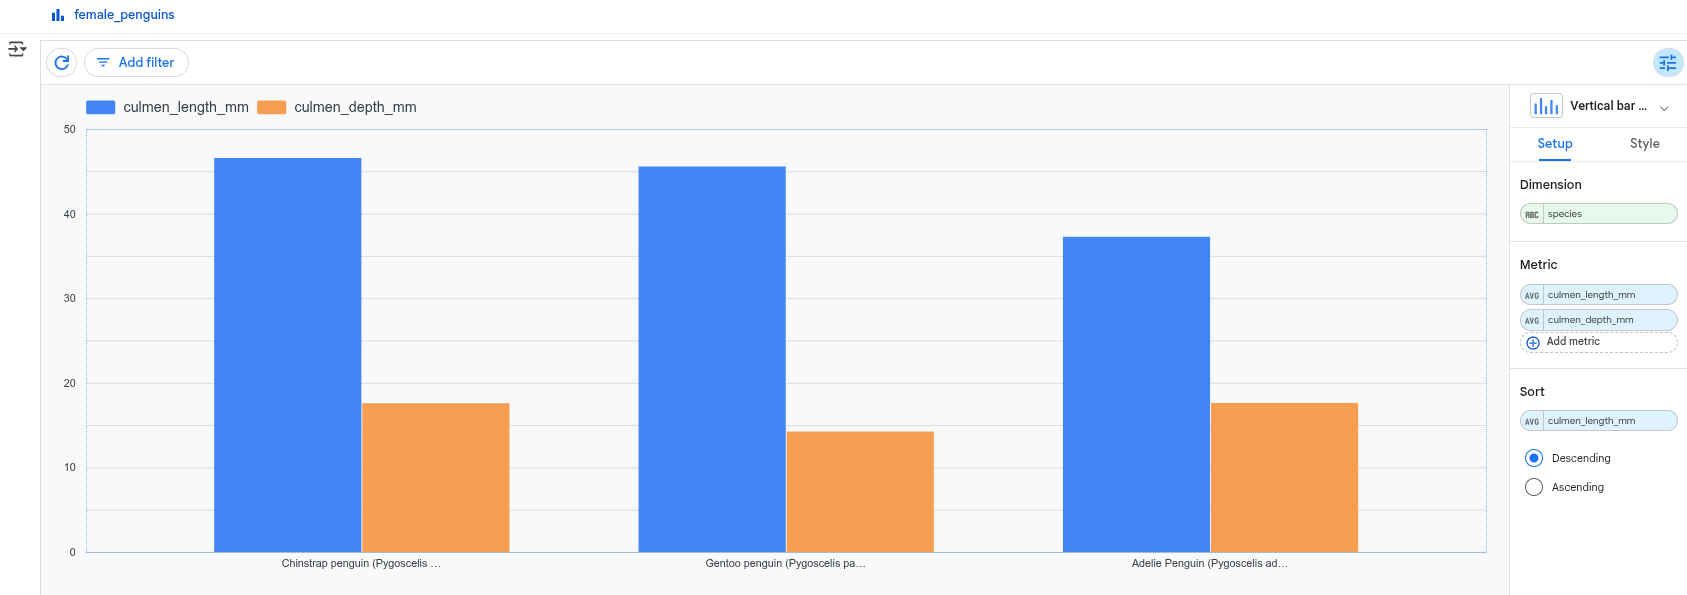
- Use a visualization cell to display the average culmen length and depth of female penguins for each species.
Before you begin
- Sign in to your Google Cloud account. If you're new to Google Cloud, create an account to evaluate how our products perform in real-world scenarios. New customers also get $300 in free credits to run, test, and deploy workloads.
-
In the Google Cloud console, on the project selector page, select or create a Google Cloud project.
Roles required to select or create a project
- Select a project: Selecting a project doesn't require a specific IAM role—you can select any project that you've been granted a role on.
-
Create a project: To create a project, you need the Project Creator
(
roles/resourcemanager.projectCreator), which contains theresourcemanager.projects.createpermission. Learn how to grant roles.
-
Verify that billing is enabled for your Google Cloud project.
Verify that the BigQuery API is enabled.
If you created a new project, the BigQuery API is automatically enabled.
Required permissions
To create and run notebooks, you need the following Identity and Access Management (IAM) roles:
Create a notebook
Follow the instructions in Create a notebook from the BigQuery editor to create a new notebook.
Run a query
To run a SQL query in a notebook, follow these steps:
To create a new SQL cell in your notebook, click SQL.
Enter the following query:
SELECT * FROM `bigquery-public-data.ml_datasets.penguins`;Click Run cell.
The results of the query are automatically saved in a DataFrame called
df.Create another SQL cell and change the title to
female_penguins.Enter the following query, which references the DataFrame you just created and filters the results to only include female penguins:
SELECT * FROM {df} WHERE sex = 'FEMALE';Click Run cell.
The results of the query are automatically saved in a DataFrame called
female_penguins.
Visualize results
To create a new visualization cell in your notebook, click Visualization.
Click Choose a dataframe and then select
female_penguins.A chart interface appears.
Click Scatter chart to open a chart menu, then select the Vertical bar chart.
In the Metric section, check that
culmen_length_mmandculmen_depth_mmappear. If a metric is missing, click Add metric and select it. To remove a metric, hold the pointer over the metric name and then click Close.For each metric, click Edit. For Aggregation select Average.
Clean up
The easiest way to eliminate billing is to delete the project that you created for the tutorial.
To delete the project:
- In the Google Cloud console, go to the Manage resources page.
- In the project list, select the project that you want to delete, and then click Delete.
- In the dialog, type the project ID, and then click Shut down to delete the project.
What's next
- Learn more about BigQuery DataFrames.
- Learn more about SQL cells in Colab Enterprise.
- Learn more about visualization cells in Colab Enterprise.
- Learn how to visualize graphs using BigQuery DataFrames.
- Learn how to use a BigQuery DataFrames notebook.