This guide shows you how to configure Google Cloud's Agent for SAP to collect the Process Monitoring metrics from your SAP systems.
For information about this feature, see Process Monitoring using Google Cloud's Agent for SAP.
Before you begin
- Validate your installation of Google Cloud's Agent for SAP. For instructions, see the installation guide for your scenario.
- If you have installed the agent on a Bare Metal Solution server, then make sure that you have completed the required prerequisites and set up a service account. For instructions, see Configure Google Cloud's Agent for SAP on Linux.
Required IAM roles
To ensure that the service account has the necessary permissions to let Google Cloud's Agent for SAP collect Process Monitoring metrics, ask your administrator to grant the service account the following IAM roles on your project:
-
Compute Viewer (
roles/compute.viewer): to collect the Process Monitoring metrics from the Compute Engine instance that hosts your SAP system. -
Monitoring Metric Writer (
roles/monitoring.metricWriter): to write the collected metrics to Cloud Monitoring. -
(Optional) Secret Manager Secret Accessor (
roles/secretmanager.secretAccessor): if you are using Secret Manager to store the password to connect to the SAP HANA database.
For more information about granting roles, see Manage access to projects, folders, and organizations.
These predefined roles contain the permissions required to let Google Cloud's Agent for SAP collect Process Monitoring metrics. To see the exact permissions that are required, expand the Required permissions section:
Required permissions
The following permissions are required to let Google Cloud's Agent for SAP collect Process Monitoring metrics:
-
To collect the Process Monitoring metrics from the host Compute Engine instance and write them to Cloud Monitoring:
-
monitoring.timeSeries.create -
compute.instances.get -
compute.nodeGroups.list -
compute.nodeGroups.get
-
-
If you are using Secret Manager to store the password to connect to the SAP HANA database, then to access the secret:
secretmanager.versions.access
Your administrator might also be able to give the service account these permissions with custom roles or other predefined roles.
Required SAP HANA roles
To let the agent collect metrics from your SAP HANA database, make sure that the SAP HANA user
that you specify in the agent's configuration file has the MONITORING role.
For information about this role, see the SAP document Standard Database Roles.
Enable Process Monitoring metrics collection
To enable the collection of Process Monitoring metrics using Google Cloud's Agent for SAP, follow these steps:
Establish an SSH connection with your host Compute Engine instance.
Open the agent's configuration file:
/etc/google-cloud-sap-agent/configuration.json
Alternatively, you can also perform this configuration by running commands. For more information, see Configuration commands for Google Cloud's Agent for SAP.
In the
collection_configurationsection, perform the following:- For the parameter
collect_process_metrics, specify the valuetrue. - To enable the collection of process monitoring metrics related to your
SAP HANA database instances, you need to configure additional parameters
in the
hana_metrics_configsection. For information about these parameters, see Configuration parameters.
- For the parameter
Optionally, under the
cloud_propertiessection, you can update the parameter values that are set automatically. To do so, add thecloud_propertiessection to your configuration file, and then specify the required parameters and their values.Save the configuration file.
Restart the agent for the new settings to take effect:
sudo systemctl restart google-cloud-sap-agent
Example configuration files
Compute Engine instance
The following examples are completed configuration files of Google Cloud's Agent for SAP, running on a Compute Engine instance, where the collection of Process Monitoring metrics is enabled:
For SAP HANA authentication, the agent uses the following order of
preference: if specified, the hdbuserstore_key configuration
parameter is preferred over the hana_db_password parameter, which
is preferred over the hana_db_password_secret_name parameter. We
recommend that you set only one authentication option in your configuration
file.
- The following example uses a
Secure user store (
hdbuserstore) key for SAP HANA authentication:{ "provide_sap_host_agent_metrics": true, "bare_metal": false, "log_level": "INFO", "log_to_cloud": true, "collection_configuration": { "collect_workload_validation_metrics": true, "collect_process_metrics": true, "process_metrics_frequency": 30, "slow_process_metrics_frequency": 120, "hana_metrics_config": { "hana_db_user": "db_user_name", "sid": "DEH", "hdbuserstore_key": "user_store_key" } }, "discovery_configuration": { "enable_discovery": true, "enable_workload_discovery": true }, "hana_monitoring_configuration": { "enabled": false } }
- The following example uses a username and Secret Manager
secret for SAP HANA authentication:
{
  "provide_sap_host_agent_metrics": true,
  "bare_metal": false,
  "log_level": "INFO",
  "log_to_cloud": true,
  "collection_configuration": {
    "collect_workload_validation_metrics": true,
    "collect_process_metrics": true,
    "process_metrics_frequency": 30,
    "slow_process_metrics_frequency": 120,
    "hana_metrics_config": {
      "hana_db_user": "db_user_name",
      "sid": "DEH",
      "hana_db_password_secret_name": "db_pwd_secret_name"
    }
  },
  "discovery_configuration": {
    "enable_discovery": true,
    "enable_workload_discovery": true
  },
  "hana_monitoring_configuration": {
    "enabled": false
  }
}
- The following example uses a username and password for SAP HANA
authentication. We recommend that you instead use a
Secret Manager secret or
Secure user store (
hdbuserstore) key for SAP HANA authentication.{ "provide_sap_host_agent_metrics": true, "bare_metal": false, "log_level": "INFO", "log_to_cloud": true, "collection_configuration": { "collect_workload_validation_metrics": true, "collect_process_metrics": true, "process_metrics_frequency": 5, "slow_process_metrics_frequency": 30, "hana_metrics_config": { "hana_db_user": "db_user_name", "sid": "DEH", "hana_db_password": "TempPa55word" } }, "discovery_configuration": { "enable_discovery": true, "enable_workload_discovery": true }, "hana_monitoring_configuration": { "enabled": false } }
Bare Metal Solution server
The following examples are completed configuration files of Google Cloud's Agent for SAP, running on a Bare Metal Solution server, where the collection of Process Monitoring metrics is enabled:
For SAP HANA authentication, the agent uses the following order of
preference: if specified, the hdbuserstore_key configuration
parameter is preferred over the hana_db_password parameter, which
is preferred over the hana_db_password_secret_name parameter. We
recommend that you set only one authentication option in your configuration
file.
- The following example uses a
Secure user store (
hdbuserstore) key for SAP HANA authentication:{ "provide_sap_host_agent_metrics": true, "bare_metal": true, "log_level": "INFO", "log_to_cloud": true, "collection_configuration": { "collect_workload_validation_metrics": true, "collect_process_metrics": true, "process_metrics_frequency": 30, "slow_process_metrics_frequency": 120, "hana_metrics_config": { "hana_db_user": "db_user_name", "sid": "DEH", "hdbuserstore_key": "user_store_key" } }, "cloud_properties": { "project_id": "my-project", "instance_name": "bms-machine-1", "region": "us-central1", "image": "rhel-8" },
"discovery_configuration": { "enable_discovery": true, "enable_workload_discovery": true }, "hana_monitoring_configuration": { "enabled": false } } - The following example uses a username and Secret Manager
secret for SAP HANA authentication:
{ "provide_sap_host_agent_metrics": true, "bare_metal": true, "log_level": "INFO", "log_to_cloud": true, "collection_configuration": { "collect_workload_validation_metrics": true, "collect_process_metrics": true, "process_metrics_frequency": 30, "slow_process_metrics_frequency": 120, "hana_metrics_config": { "hana_db_user": "db_user_name", "sid": "DEH", "hana_db_password_secret_name": "db_pwd_secret_name" } }, "cloud_properties": { "project_id": "my-project", "instance_name": "bms-machine-1", "region": "us-central1", "image": "rhel-8" },
"discovery_configuration": { "enable_discovery": true, "enable_workload_discovery": true }, "hana_monitoring_configuration": { "enabled": false } } - The following example uses a username and password for SAP HANA
authentication. We recommend that you instead use a
Secret Manager secret or
Secure user store (
hdbuserstore) key for SAP HANA authentication.{ "provide_sap_host_agent_metrics": true, "bare_metal": true, "log_level": "INFO", "log_to_cloud": true, "collection_configuration": { "collect_workload_validation_metrics": true, "collect_process_metrics": true, "process_metrics_frequency": 5, "slow_process_metrics_frequency": 30, "hana_metrics_config": { "hana_db_user": "db_user_name", "sid": "DEH", "hana_db_password": "TempPa55word" } }, "cloud_properties": { "project_id": "my-project", "instance_name": "bms-machine-1", "region": "us-central1", "image": "rhel-8" },
"discovery_configuration": { "enable_discovery": true, "enable_workload_discovery": true }, "hana_monitoring_configuration": { "enabled": false } }
Configuration parameters
The following table explains the configuration parameters of Google Cloud's Agent for SAP that are specific to the collection of the Process Monitoring metrics.
| Parameters | |
|---|---|
provide_sap_host_agent_metrics |
To enable the collection of the metrics required by the
SAP Host Agent, specify |
bare_metal |
When the agent is installed on a Bare Metal Solution server, specify
|
log_level |
To set the logging level of the agent, set the required value. The available log levels are as follows:
Default is |
log_to_cloud |
To redirect the agent's logs to
Cloud Logging, specify
|
cloud_properties.project_id |
If your SAP system is running on a Bare Metal Solution server, then
specify the project ID of the Google Cloud project that you are
using with Bare Metal Solution. |
cloud_properties.instance_name
|
If your SAP system is running on a Compute Engine instance, then specify the name that compute instance. The agent automatically detects the compute instance name upon installation. If your SAP system is running on a Bare Metal Solution server, then specify the name of that server. |
cloud_properties.region |
If your SAP system is running on a Bare Metal Solution server,
then specify the region of the Bare Metal Solution server. |
cloud_properties.zone |
When the agent runs on a compute instance, by default, the agent uses the zone where the compute instance is deployed. |
cloud_properties.image |
Specify the OS image name of the instance. |
cloud_properties.numeric_project_id |
Specify the numeric ID of the Google Cloud project where the SAP system
is running. |
discovery_configuration.enable_workload_discovery |
To let the agent collect the names and versions of the SAP products
running on the host, specify For more information, see the agent's codebase in the
|
discovery_configuration.enable_discovery |
To send to Cloud Logging the information that the agent collects about
the SAP products running on the host, specify If you specify the value |
collection_configuration.collect_process_metrics |
To enable Process Monitoring metrics collection, specify |
collection_configuration.process_metrics_frequency |
From version 2.6, this parameter determines the collection frequency of the
fast-changing Process Monitoring metrics,
in seconds. Fast-changing Process Monitoring metrics are: The default value for this parameter is
All other (slow-changing) Process Monitoring metrics are collected at a
default frequency of 120 seconds. To change the collection frequency of
the slow-changing Process Monitoring metrics, use the parameter
|
collection_configuration.slow_process_metrics_frequency |
Specify the collection frequency of the slow-changing Process Monitoring metrics, in seconds. The default value for this parameter is |
collection_configuration.process_metrics_to_skip |
Specify the
Process Monitoring metrics
that you don't want the agent to collect. This parameter accepts a
comma-separated value of Process Monitoring metric names. For example:
|
collection_configuration.hana_metrics_config.hana_db_user |
Specify the database user account that the agent uses to query
SAP HANA. Default is |
collection_configuration.hana_metrics_config.hana_db_password |
Specify the plain text password for the database user account that the agent uses to query SAP HANA. Instead of specifying a plain text password, we recommend that you use one of the following options:
For SAP HANA authentication, the agent uses the following order of
preference: if specified, the |
collection_configuration.hana_metrics_config.hana_db_password_secret_name |
To securely provide the password for the database user account that the agent uses to query SAP HANA, specify the name of the secret that contains the security credentials for the database user account. The agent collects the SAP HANA related metrics only when you specify
either For SAP HANA authentication, the agent uses the following order of
preference: if specified, the |
collection_configuration.hana_metrics_config.hdbuserstore_key
|
To securely connect to an SAP HANA system, specify a
Secure user store ( To use an
This configuration parameter is supported from version 3.3 of the agent. For SAP HANA authentication, the agent uses the following order of
preference: if specified, the |
collection_configuration.hana_metrics_config.sid |
Specify the SID of your SAP HANA instance.
If you're using an |
Validate the setup for Process Monitoring metrics collection
You can validate if you have the correct Google Cloud setup for the collection of the
Process Monitoring metrics by running the agent's status command. This
command is supported from version 3.7 of the agent.
To do this, complete the following steps:
- Establish an SSH connection with your Compute Engine instance or Bare Metal Solution server.
Run the following command:
sudo /usr/bin/google_cloud_sap_agent statusIf your Google Cloud setup for Process Monitoring metrics collection is correct, then the output includes the following. Your configuration might have values other than the
defaultones.Agent Status: ... Systemd Service Enabled: True Systemd Service Running: True Cloud API Full Scopes: True Configuration File: /etc/google-cloud-sap-agent/configuration.json Configuration Valid: True ... ---------------------------------------------------------------------------- Process Metrics: Enabled Status: Fully Functional IAM Permissions: All granted Configuration: collect_process_metrics: true (configuration file) process_metrics_frequency: 30 (default) process_metrics_to_skip: [] (default) slow_process_metrics_frequency: 120 (default) ...If your output conveys that some setup is missing, then review the information provided in the preceding sections, perform the required actions, and then re-run the
statuscommand to re-validate the setup.
View the collected metrics
To visualize the Process Monitoring metrics that the agent collects, you can use the following custom dashboards that Google Cloud provides:
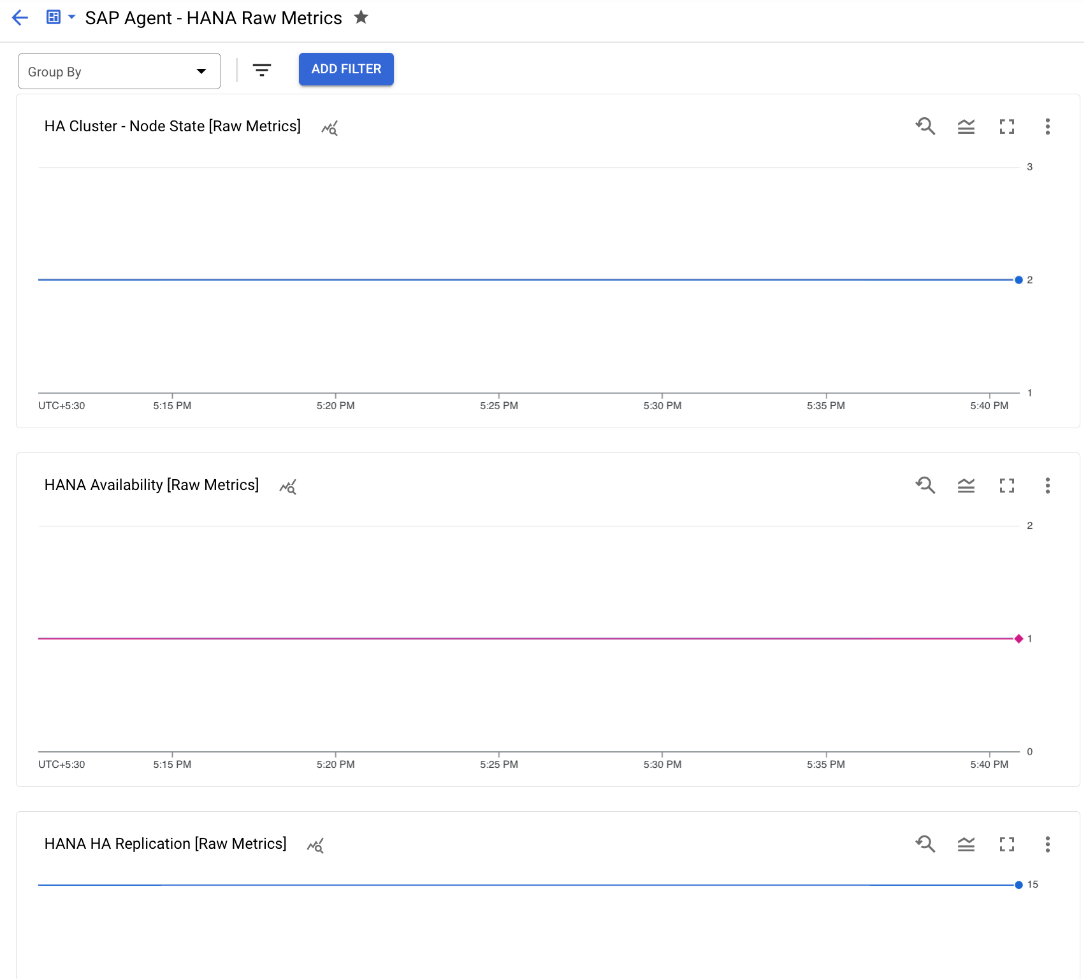
Agent for SAP - HANA Overview: This dashboard provides charts that display status overview for the following metrics: SAP HANA Availability, SAP HANA HA Availability, SAP HANA HA Replication, SAP HANA Service Status, HA Cluster - Node State, and HA Cluster - Resource State for SAP Instances.
The JSON file for this dashboard is
sap-agent-status-overview.json.Agent for SAP - HANA Raw Metrics: This dashboard provides charts that display raw metric values for the following metrics: SAP HANA Availability, SAP HANA HA Availability, SAP HANA HA Replication, SAP HANA Service Status, HA Cluster - Node State, and HA Cluster - Resource State for SAP Instances.
The JSON file for this dashboard is
sap-agent-raw-metrics.json.
Install dashboards
To install a custom dashboard, complete the following steps:
Google Cloud console
In the Google Cloud console, go to the Monitoring page:
In the Monitoring navigation panel, click Dashboards.
Click the Sample library tab.
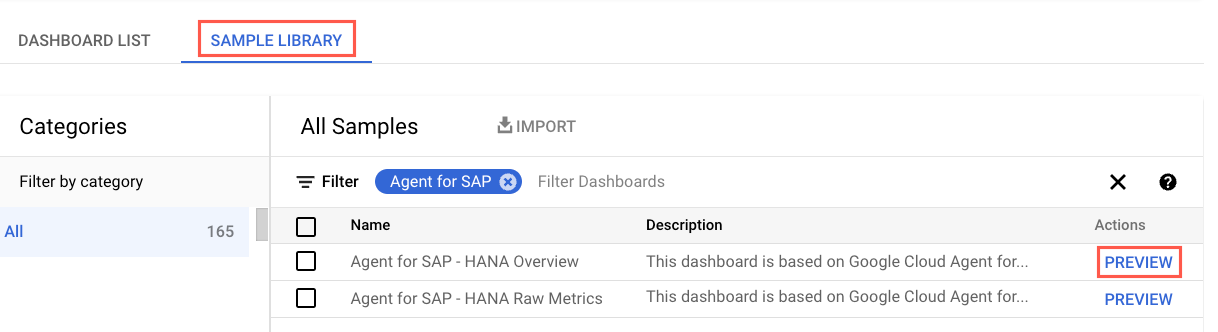
To filter the agent-specific custom dashboards, in the Filter field, type
Agent for SAP.(Optional) To view details about a dashboard or to preview its contents, click Preview.
Select the dashboard that you want to install.
Click Import, and then click Confirm.
The dashboard is added to the available dashboards in your Google Cloud project. To see your dashboard, follow the instructions in View the installed dashboard.
Google Cloud CLI
Open the Cloud Shell:
In the Cloud Shell, clone or download the repository:
git clone https://github.com/GoogleCloudPlatform/monitoring-dashboard-samples/
In the Cloud Shell, install the required dashboard using the corresponding JSON file:
gcloud monitoring dashboards create --config-from-file=CONFIG_FROM_FILE
Replace
CONFIG_FROM_FILEwith the path to the JSON file that contains the dashboard configuration. Dashboard configuration files can be located at path:monitoring-dashboard-samples/dashboards/google-cloud-agent-for-sap.The dashboard is added to the available dashboards in your Google Cloud project. To see your dashboard, follow the instructions in View the installed dashboard.
View the installed dashboards
To view the installed dashboards, follow these steps:
In the Google Cloud console, go to the Monitoring page:
In the Monitoring navigation panel, click Dashboards.
Click the dashboard name in the list.
If you have a lot of dashboards, then you can filter for custom dashboards or for the name of the new dashboard. For information on filtering this list, see View custom dashboards.
The following image is an example that shows a part of the custom dashboard for SAP HANA metrics in Monitoring.