Halaman ini berlaku untuk Apigee dan Apigee Hybrid.
Lihat dokumentasi
Apigee Edge.

Tampilan Linimasa Pemantauan API menampilkan linimasa traffic API terbaru, untuk membantu Anda mendiagnosis dan menyelidiki masalah.
Untuk mengakses tampilan Linimasa, ikuti langkah-langkah di bagian Mengakses Pemantauan API dan pilih Linimasa.
Gambar di bawah menunjukkan UI dengan Timeline yang dipilih.
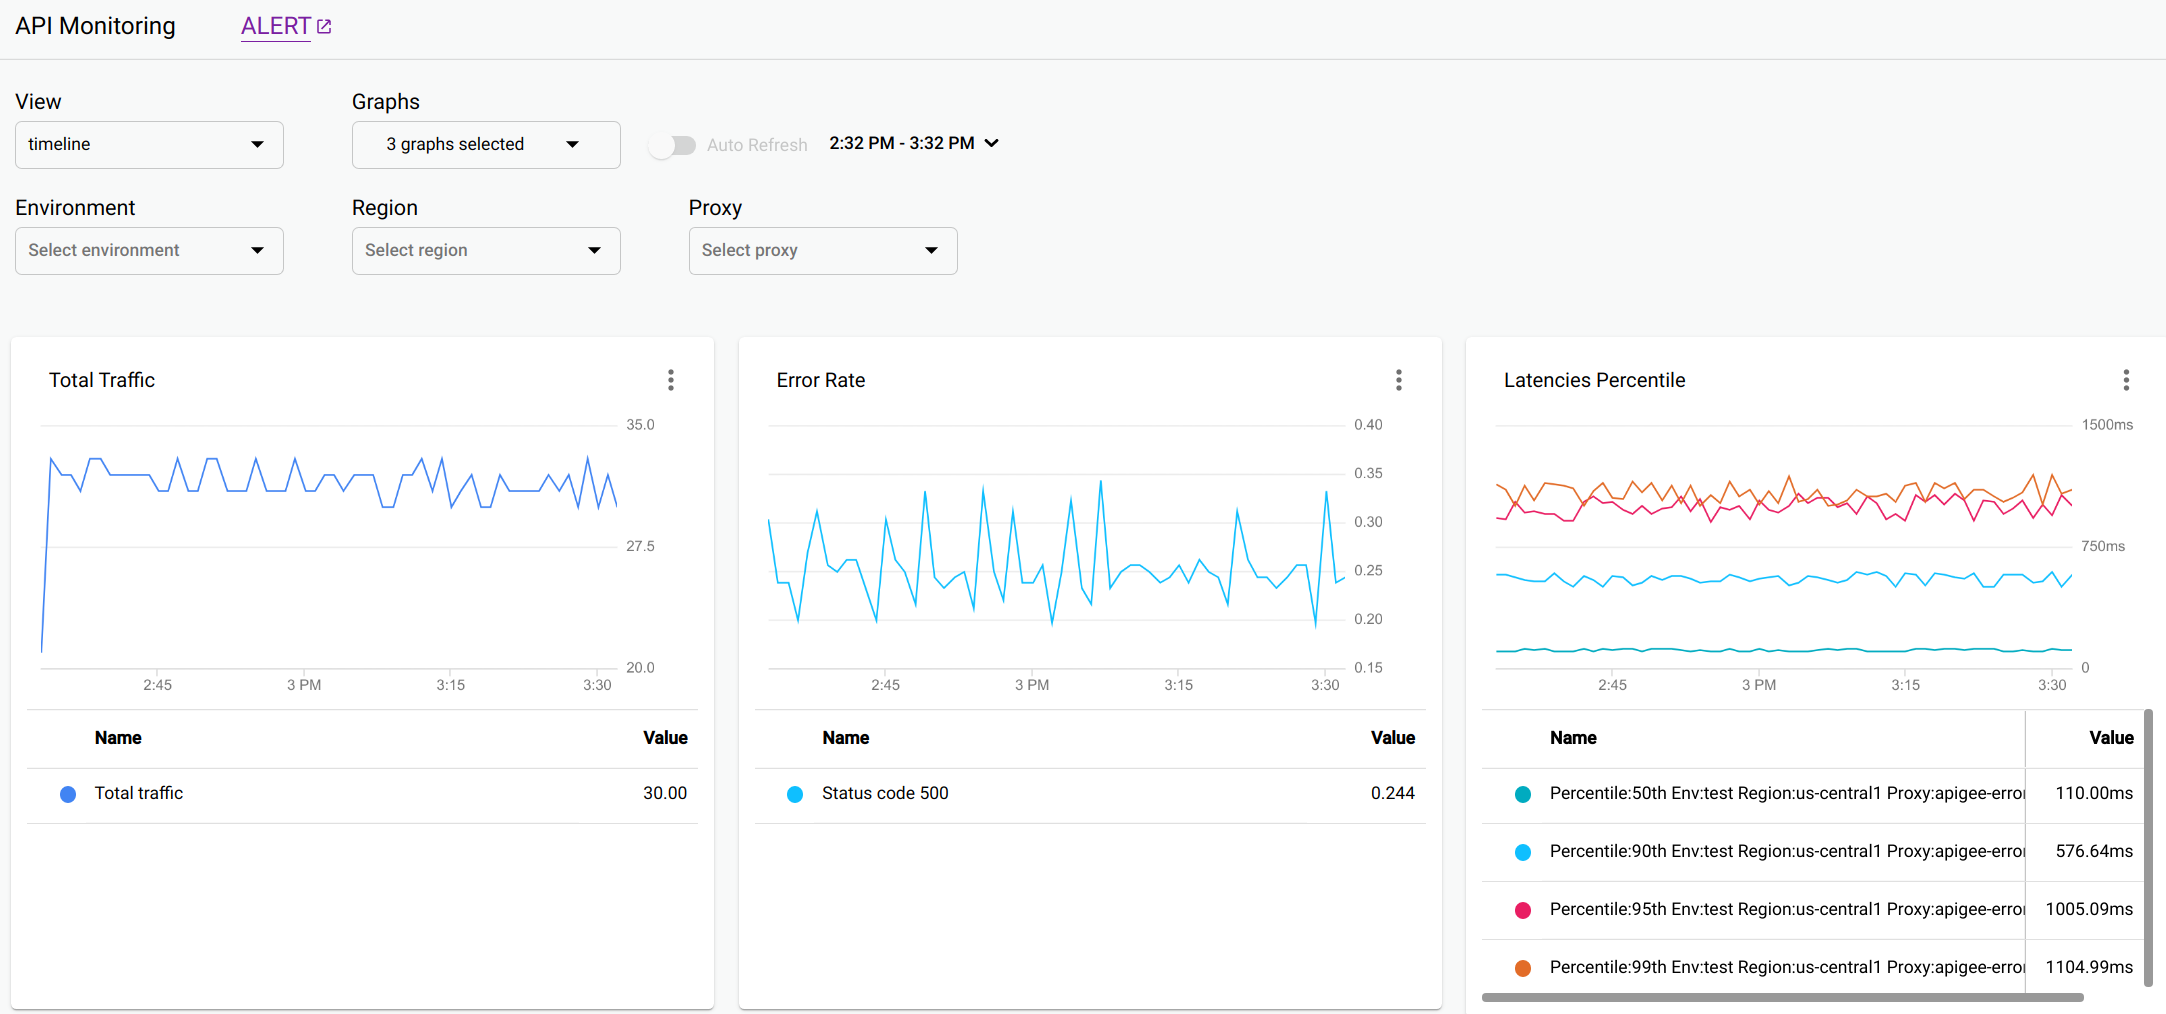
Tampilan Linimasa menampilkan grafik berikut:
- Total Traffic Proxy: Jumlah permintaan selama interval 1 menit rentang waktu.
- Rasio Error Proxy: Total error (4xx dan 5xx) dibagi dengan total traffic di setiap interval.
- Persentil Latensi Proxy: Persentil untuk latensi API. Grafik menampilkan persentil berikut: persentil ke-50 (median), persentil ke-90, persentil ke-95, dan persentil ke-99.
- Target Total Traffic
- Target Tingkat Error
- Persentil Latensi Target
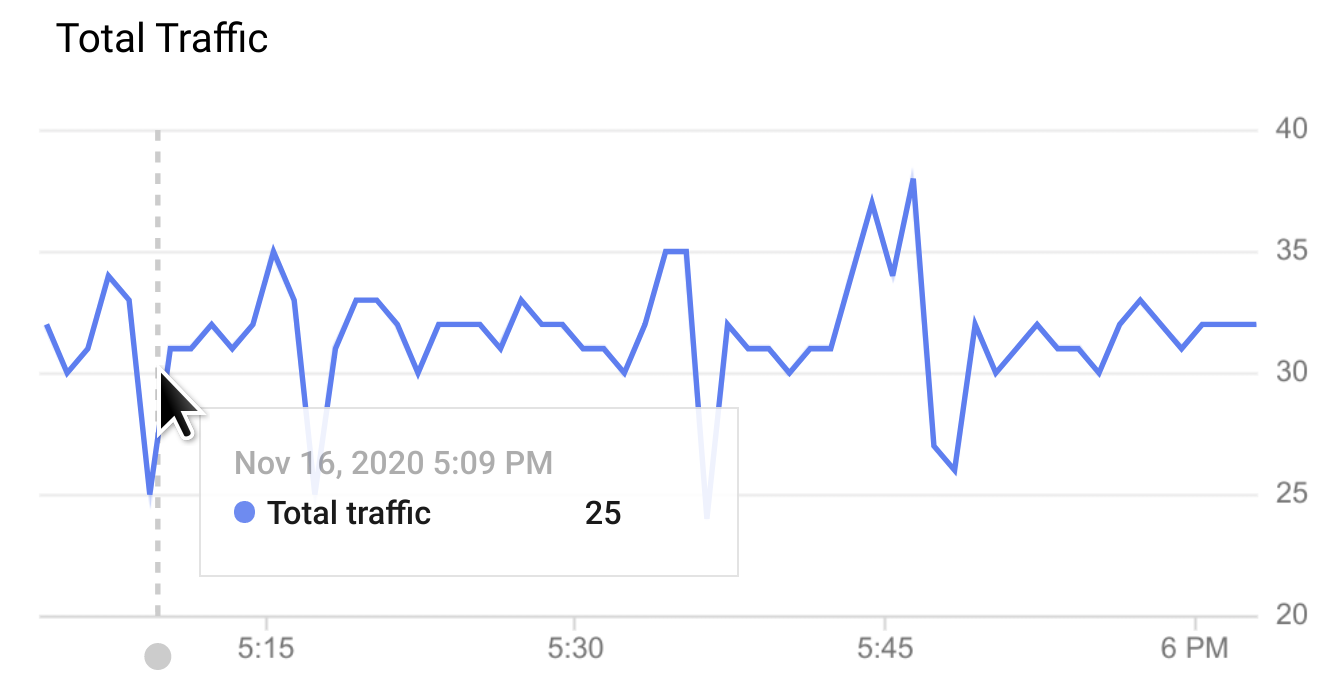
Arahkan kursor ke titik mana pun dalam grafik untuk menampilkan nilai pada titik tersebut.
Anda dapat memilih grafik yang akan ditampilkan di menu drop-down Graphs.
Opsi grafik untuk semua tampilan
Opsi grafik berikut tersedia di ketiga tampilan: Linimasa, Selidiki, dan Terbaru:
- PERINGATAN: Klik PERINGATAN untuk menyiapkan peringatan dan notifikasi untuk peristiwa, seperti lonjakan traffic atau latensi.
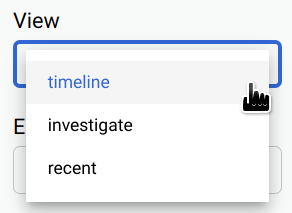
Lihat: Pilih salah satu tampilan API Monitoring:
- Linimasa (ditampilkan di atas)
- Investigasi
- Terbaru
Grafik: Pilih grafik yang akan ditampilkan dari menu drop-down.
Saat Anda memilih grafik, grafik tersebut ditampilkan dalam urutan yang Anda pilih, dimulai dengan grafik yang terakhir dipilih.
Rentang waktu: Pilih durasi rentang waktu untuk grafik.
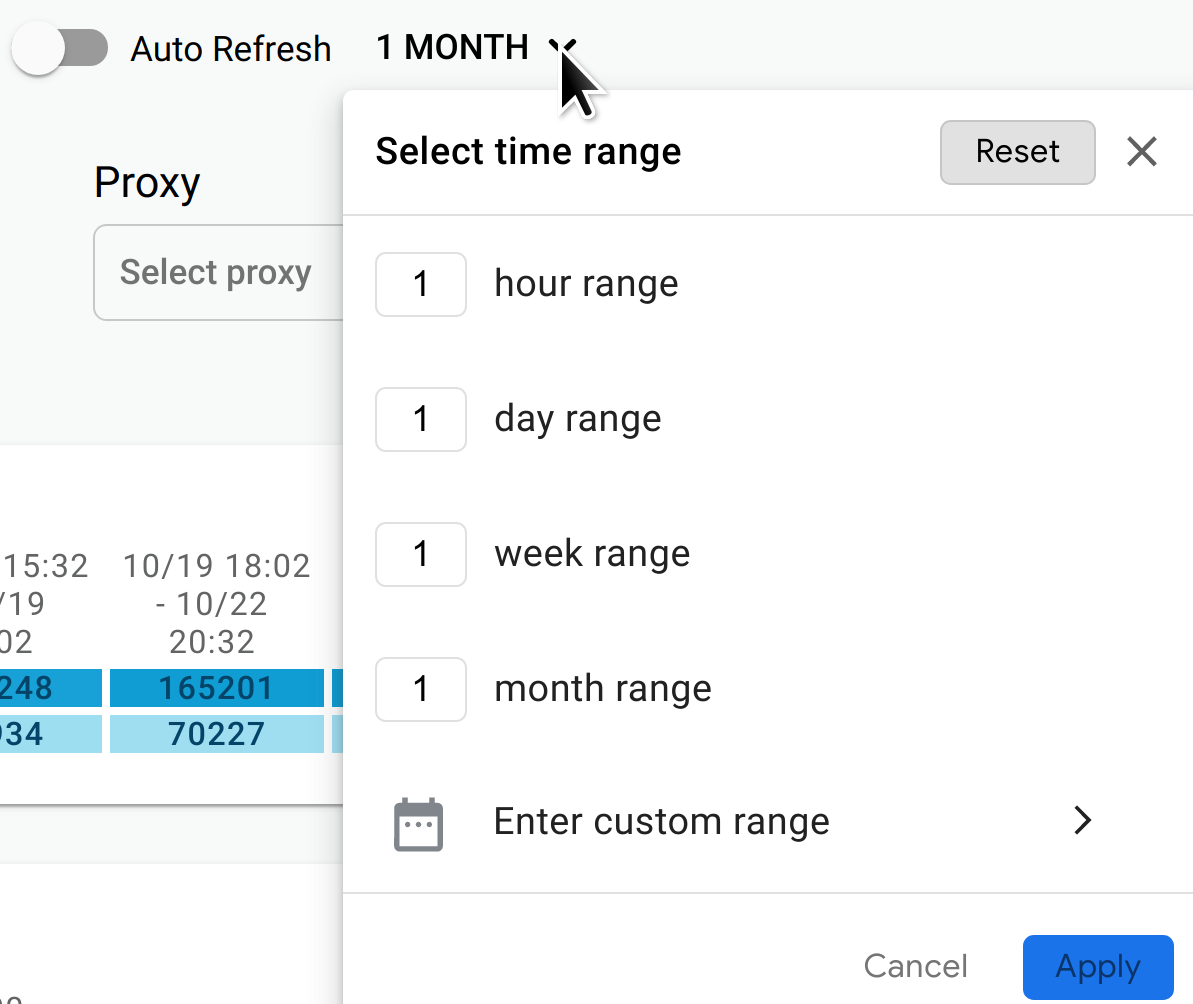
Anda juga dapat mengaktifkan Pemuatan Ulang Otomatis untuk memperbarui data secara otomatis setiap menit.
Lingkungan: Pilih lingkungan untuk API.
Region (hanya tampilan Linimasa dan Selidiki): Pilih region API.
Proxy (hanya tampilan Linimasa dan Selidiki): Pilih proxy API.