This page applies to Apigee and Apigee hybrid.
View
Apigee Edge documentation.

Custom reports enable you to drill down into specific API metrics and view the exact data that you want to see. You can create a custom report by using any of the metrics and dimensions built into Apigee.
There are two types of custom reports:
- Real-time reports (also called synchronous reports): When you specify the report parameters in the Apigee UI, real-time reports are displayed in the Apigee UI within a couple of minutes.
- Report jobs (also called asynchronous reports): For custom report jobs you request the report and retrieve the results at a later time.
See Real-time reports versus report jobs.
Availability of custom reports
If you are an Apigee Subscription customer, access to Apigee API Analytics and the custom report functionality is included in your subscription entitlements and automatically enabled for each of your Apigee environments.
If you are a Pay-as-you-go customer, you must enable Apigee API Analytics as a paid add-on to access analytics and generate custom reports. For more information on enabling the Apigee API Analytics add-on for your Intermediate or Comprehensive Apigee environments, see Manage the Apigee API Analytics add-on.
If you are unsure whether you are using a Subscription or Pay-as-you-go Apigee organization, contact your Apigee organization administrator.
About custom reports
When building a custom report, you'll select the data you want to see (metrics), group the data in meaningful ways (dimensions), and optionally limit the data returned based on specific characteristics (filters) of the data.
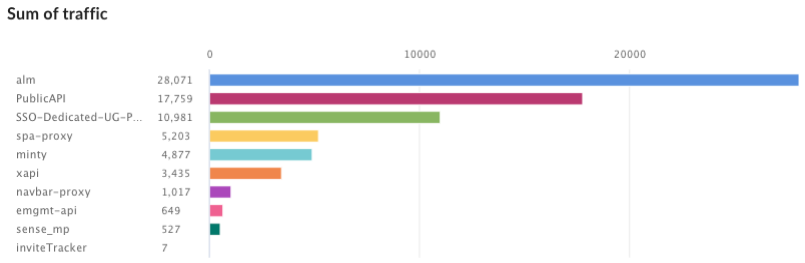
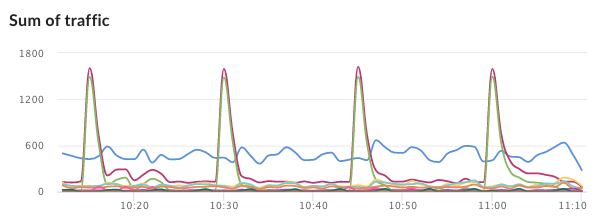
You can also set the chart type displayed in the custom report as a column or line chart. The following images show chart examples for the transactions per second metric grouped by the API proxy dimension:
Column - each API proxy is represented by a different column:
Line - each API is represented by a different line:
Setting metrics and dimensions
The metrics you choose for your custom report specify the data you are trying to measure. Common metrics include:- Transactions per second
- Response time
- Policy errors
In addition to the standard metrics and dimensions, you can also create custom reports for custom data you collect using the DataCapture policy. See Collecting custom data with the DataCapture policy.
Some metrics let you set an aggregation function to run against the metric. For example, you can use the following aggregation functions with the response time metric:
avg: Returns the average response time.min: Returns the minimum response time.max: Returns the maximum response time.sum: Returns the sum of all response times.
Not all metrics support all aggregation functions. The documentation on
metrics contains a table that specifies the metric name
and the function (sum, avg, min, max) supported by the metric.
The dimension specifies how to group the metrics data. For example, you want to create a custom report showing the response time metric. You can use dimensions to group the metrics data by API product, API proxy, or AppGroup:
- The response time per API product
- The response time per API proxy
- The response time per AppGroup
The way the dimension is displayed in the chart of the custom report depends on the chart type:
- Column: Each column corresponds to a different dimension value.
- Line: Each line in the chart corresponds to a different dimension value, and the x-axis represents time.
Setting filters
A filter lets you limit the metrics data displayed in the custom report by setting specific characteristics on the metrics data to return. For example, you can create a filter so that you see metrics data only for a response time greater than a specific value or only for an API proxy with a specific name.
You can build complex filters using conditional syntax and operators such as
eq, ne, gt, lt, and more.
Custom report examples
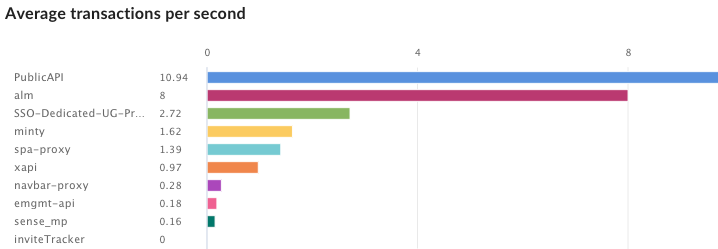
In the simplest type of custom report, you specify a single metric and a single dimension. For example, you define a custom report with the following settings:
- type = Column
- metric = Average transactions per second
- dimension = API Proxy
The custom report contains a column chart with the "Average transactions per second" metric data grouped by the API proxy dimension:
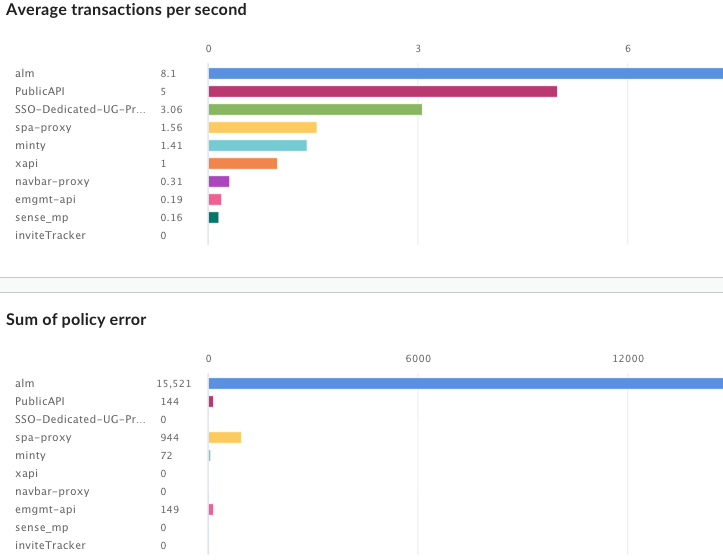
You can add multiple metrics to a custom report. For example, you define a custom report with two metrics:
- type = Column
- metric = Average transactions per second
- metric = Policy Errors
- dimension = API Proxy
The custom report contains a separate chart for each metric:
You can add multiple dimensions to a custom report. For example, you define a custom report with the following settings that includes two metrics and two dimensions:
- type = Column
- metric = Average transactions per second
- metric = Policy errors
- dimension = API Proxy
- dimension = Request verb
Real-time reports versus report jobs
Apigee Analytics lets you run a real-time report or a report job.
For real-time reports, you request the report and it is displayed as soon as the analytics server provides a response. However, because a report might need to process a large amount of data (for example, 100's of GB), a real-time report might fail because of a time out.
A real-time report can have a maximum time range of 92 days. If you select a time range greater than this, the report is run as a report job.
See Run a custom report.
For a report job, you request the report and retrieve the results at a later time. Some situations when a report job might be a good alternative include:
- Analyzing and creating reports that span large time intervals.
- Analyzing data with a variety of grouping dimensions and other constraints that add complexity to the query.
- Managing queries when you find that data volumes have increased significantly for some users or organizations.
You can also run a report job using the API, as described in Using the asynchronous custom reports API. See View a report job.
Open the Custom Reports page
In the Google Cloud console, go to the Analytics > Custom reports page.
The Custom Reports page has two tabs:
- Reports: Displays real-time reports.
- Report Jobs: Displays report jobs.
See Real-time reports versus report jobs.
Both tabs display a list of the reports or report jobs that have already been created. To view a report or report job, click the name of the report. See Run a report for an example.
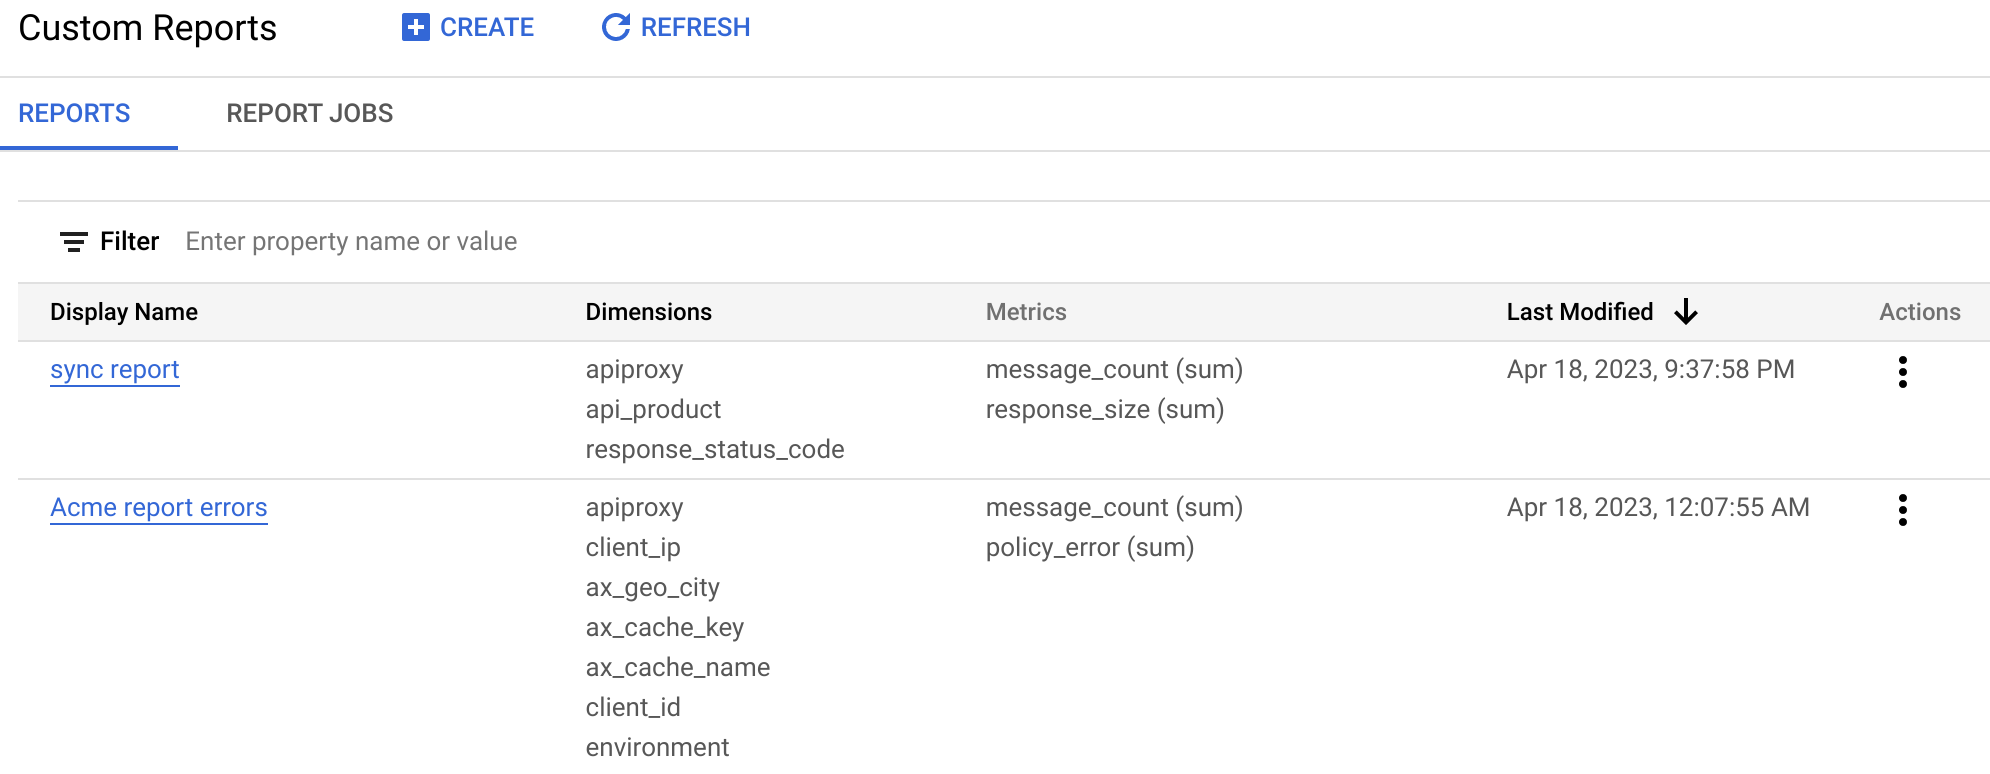
Reports
The Reports tab displays the following information about each report:
- Display Name: The name of the report.
- Dimensions: The dimensions included in the report.
- Metrics: The metrics and aggregation functions (such as sum) included in the report.
- Last Modified: The last time and date when the report was run.
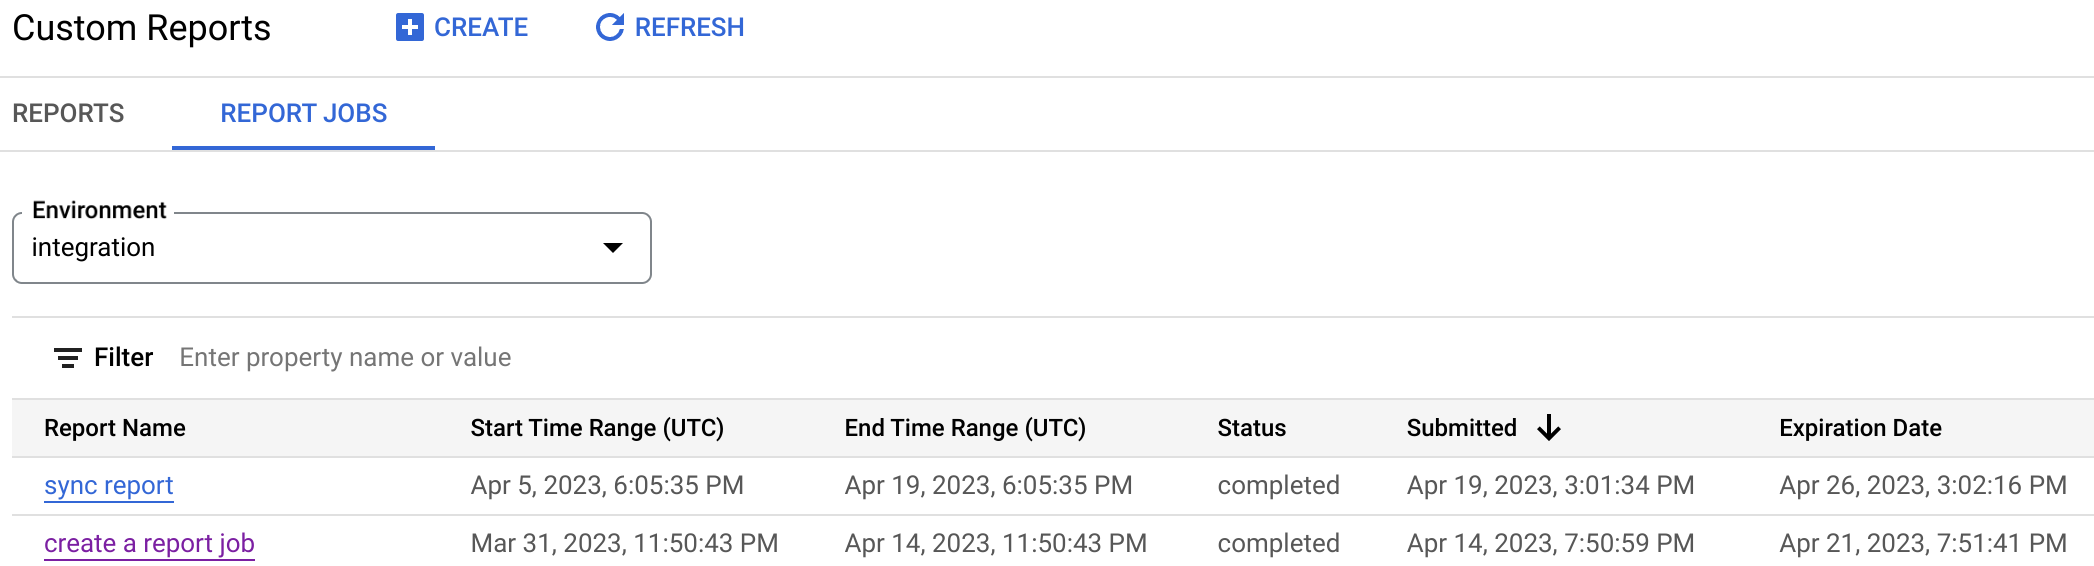
Report Jobs
The Report Jobs tab displays the following information about each report job:
- Report Name: The name of the report.
- Start Time Range (UTC): The start time of the report job.
- End Time Range (UTC): The end time of the report job.
- Status: The status of the report job, which can be running, completed, or expired.
- Submitted: The date and time when the report job was submitted.
The Custom Reports page enables you to:
- View a custom report and report job.
- Create a custom report or report job.
- Run a report.
- Edit a custom report or report job.
- Delete a custom report or report job.
Create a custom report
This section explains how to create a custom report.
In the Custom Reports page, you can create either a real-time report or a report job. To do so:
- Open the Custom Reports page.
- Click + Create.
- To create a real-time report, select Custom Report.
- To create a report job, select Custom Report Job.
- In the Basic section, enter the following information:
- Report Name: Name of the report.
- For a real-time report only, you can also enter an optional Description of the report.
- The following sections depend on whether you are creating a real-time report of a report
job:
- For real-time reports only:
After Chart Type, select the style of chart to present your data:
- Column: X-axis represents groups designated by dimensions.
- Line: X-axis represents time.
- For report jobs only:
- Report Details: In the Environment field, select the environment in which you want to run the report. Note that for real-time reports, you can select the environment in the report page, after the report has run.
- Report Date Range: Select the Start time and End time
for the report.
Note: The maximum date range for a report job is 365 days. For reports requiring date ranges precise to the second, use the Custom Reports API to create the report job. The API accepts date range inputs that include seconds.
- For real-time reports only:
- In the Metrics section:
- Select the metric that you want to analyze.
- Select an Aggregate function to display the Sum, Average, Min, or Max values.
- Click Done.
Note: In addition to the standard metrics and dimensions, you can also select metrics or dimensions corresponding to custom data collected with the DataCapture policy.
- In the Dimensions field, select a dimension, such as "Proxy", to constrain the data set used to generate the reports. You can add additional dimensions to further constrain the data.
In the Filter section, you can further narrow the data displayed by adding filters to your report definition. For example, you could add a filter that excludes data for the weather API proxy or developer jane@example.com.
First, click Add a Filter to open the New Filter section.
- Select the name of the entity you want to filter on, which can be a metric or a dimension.
- Select an operator such as = or !=, and a Value.
- Enter a value for the metric or dimension.
- Click Done to add the filter.
- Click Save to save the report.
Run a report
To run a real-time report:
- Open the Custom Reports page.
- In the Reports tab, select the report to run.
When the report is ready, it is displayed:
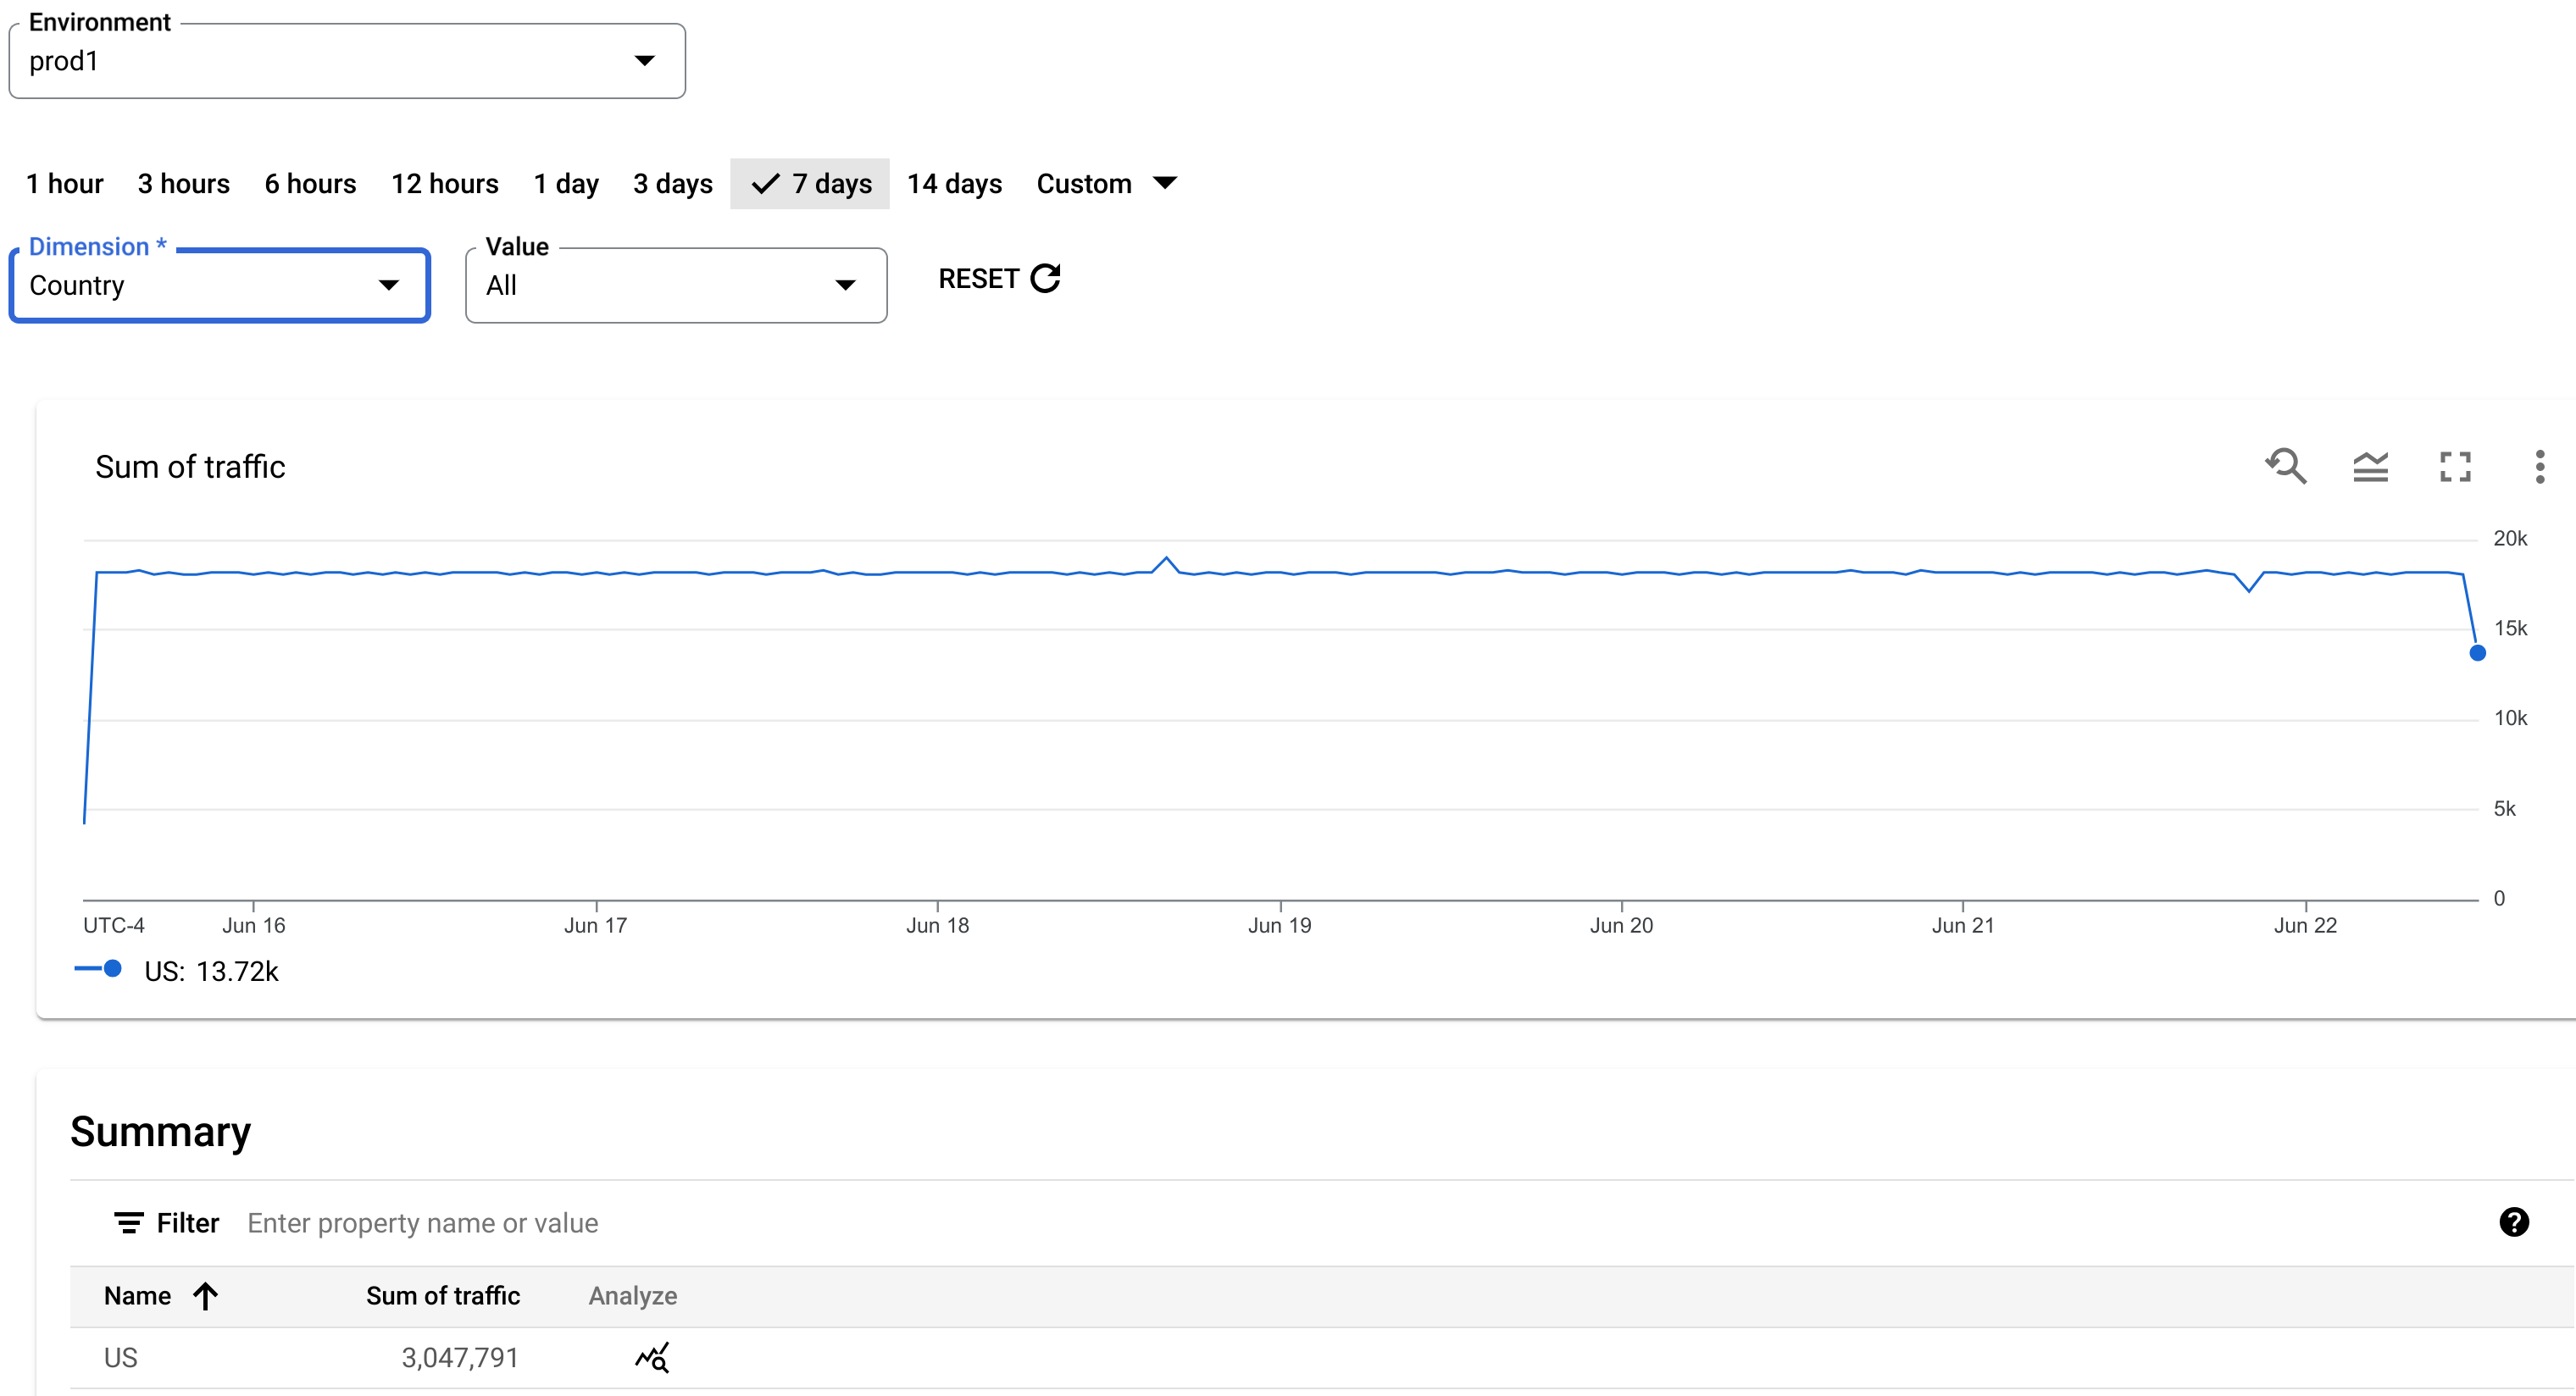
The report displays a chart of the data and a summary table.
In the report page, you can select the following options for the report:
- Environment: The environment in which to run the report.
- A time period for the report.
- Dimension: A dimension for the report. Only one dimension can be displayed at a time.
- Value: A specific value for the dimension, or All to display all values.
You can also choose the following options at the top of the report page:
- Edit: Edit the details of the report.
- Export: Download the data for the report in a CSV file.
- Submit Job: Submit the report as a report job. When you click Submit Job, a dialog opens giving you the options that are described in Create a custom report. After you have entered the options, click Create to create the report job.
See View a report job for more information about report jobs.
View a report job
To view a report job, select the Report Jobs tab at the top of the Custom Reports page.
The Report Jobs tab is displayed:
The Report Jobs page enables you to:
View all report jobs that have been submitted in the last 7 days.
Select the environment for which you want to display report jobs.
Search the list of custom reports by entering all or part of a relevant string in the search box; all displayed fields are searched for the string.
To view the custom report, make sure its Status is completed. Then click the report name to view the report.
Edit a custom report
To edit a custom report:
- Open the Custom Reports page.
- Click the three-dot menu under Actions.
- Select Edit. This opens the Edit custom report dialog, where you can edit the options for the report. The options are described in Create a custom report.
- Click Update to save your changes.
Delete a custom report
To delete a custom report:
- Open the Custom Reports page.
- Click the three-dot menu under Actions.
- Click Delete to delete the report.