This page applies to Apigee and Apigee hybrid.
API supply chain enables you to visualize and manage the relationships or dependencies between your APIs, API versions, and API operations in API hub. This capability extends to both APIs managed within API hub and those integrated from external sources. Understanding and tracking API dependencies is essential for effective API ecosystem management. The benefits of using API supply chain include:
- Improved impact analysis: Quickly understand how changes to one API can affect others.
- Enhanced troubleshooting: Trace dependencies to identify and resolve issues faster.
- Better compliance and cost management: Analyze dependencies to ensure adherence to regulations and optimize costs.
- Greater API ecosystem visibility: Gain a comprehensive view of how your APIs interact.
What is a dependency (API supply chain relationship)?
API hub models a dependency as a directional relationship between API resources or external APIs, where one entity is the supplier and the other is the consumer.
- Consumer: An API operation or external API that relies on another API operation or external API for data or functionality.
- Supplier: An API operation or external API that provides data or functionality to one or more consumers.
PetStore API calls an operation in the Location API, the PetStore API is the consumer, and the Location API is the supplier.
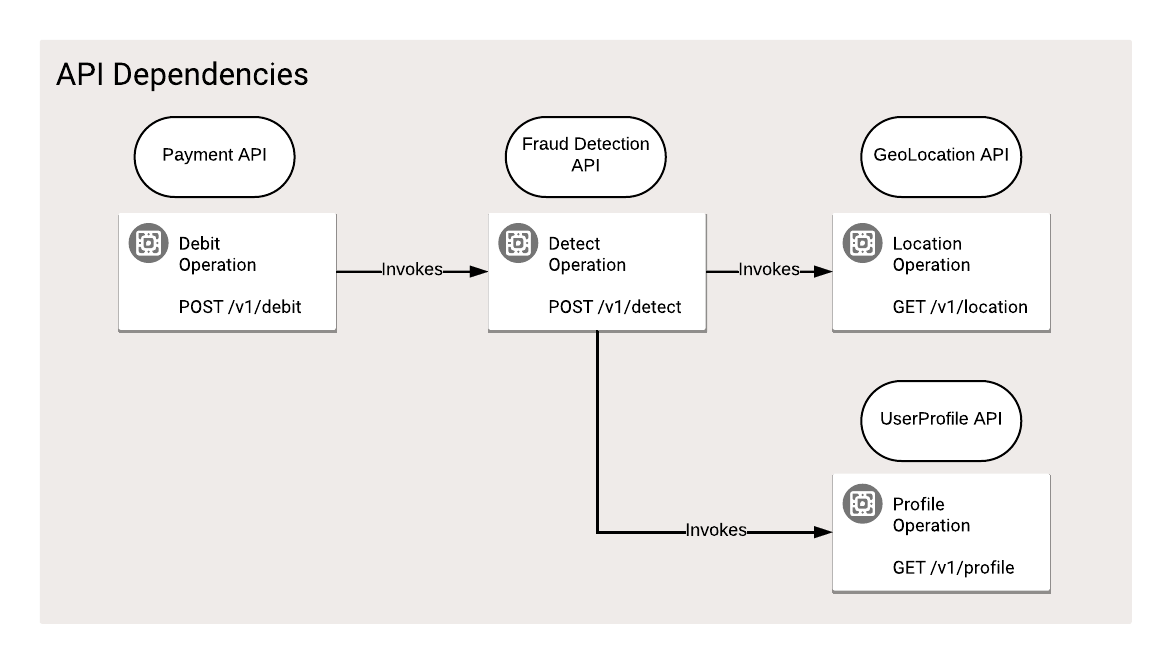
Figure 1 illustrates the supplier/consumer relationship between API operations.
The Payment API's /debit operation consumes the Fraud Detection API's /detect operation. The debit operation is the
consumer, and the fraud detection operation is the supplier in this relationship.
Likewise, /detect consumes operations that are supplied by the UserProfile API
and the GeoLocation API. In this case, the /detect operation is the consumer and the other two are
the suppliers, as shown in Figure 1.
API supply chain views
API hub offers two ways to visualize your API supply chain: a graph view for a visual representation of dependencies and a list view for a tabular display of dependencies. By default, the list view is the primary view.
API supply chain list view
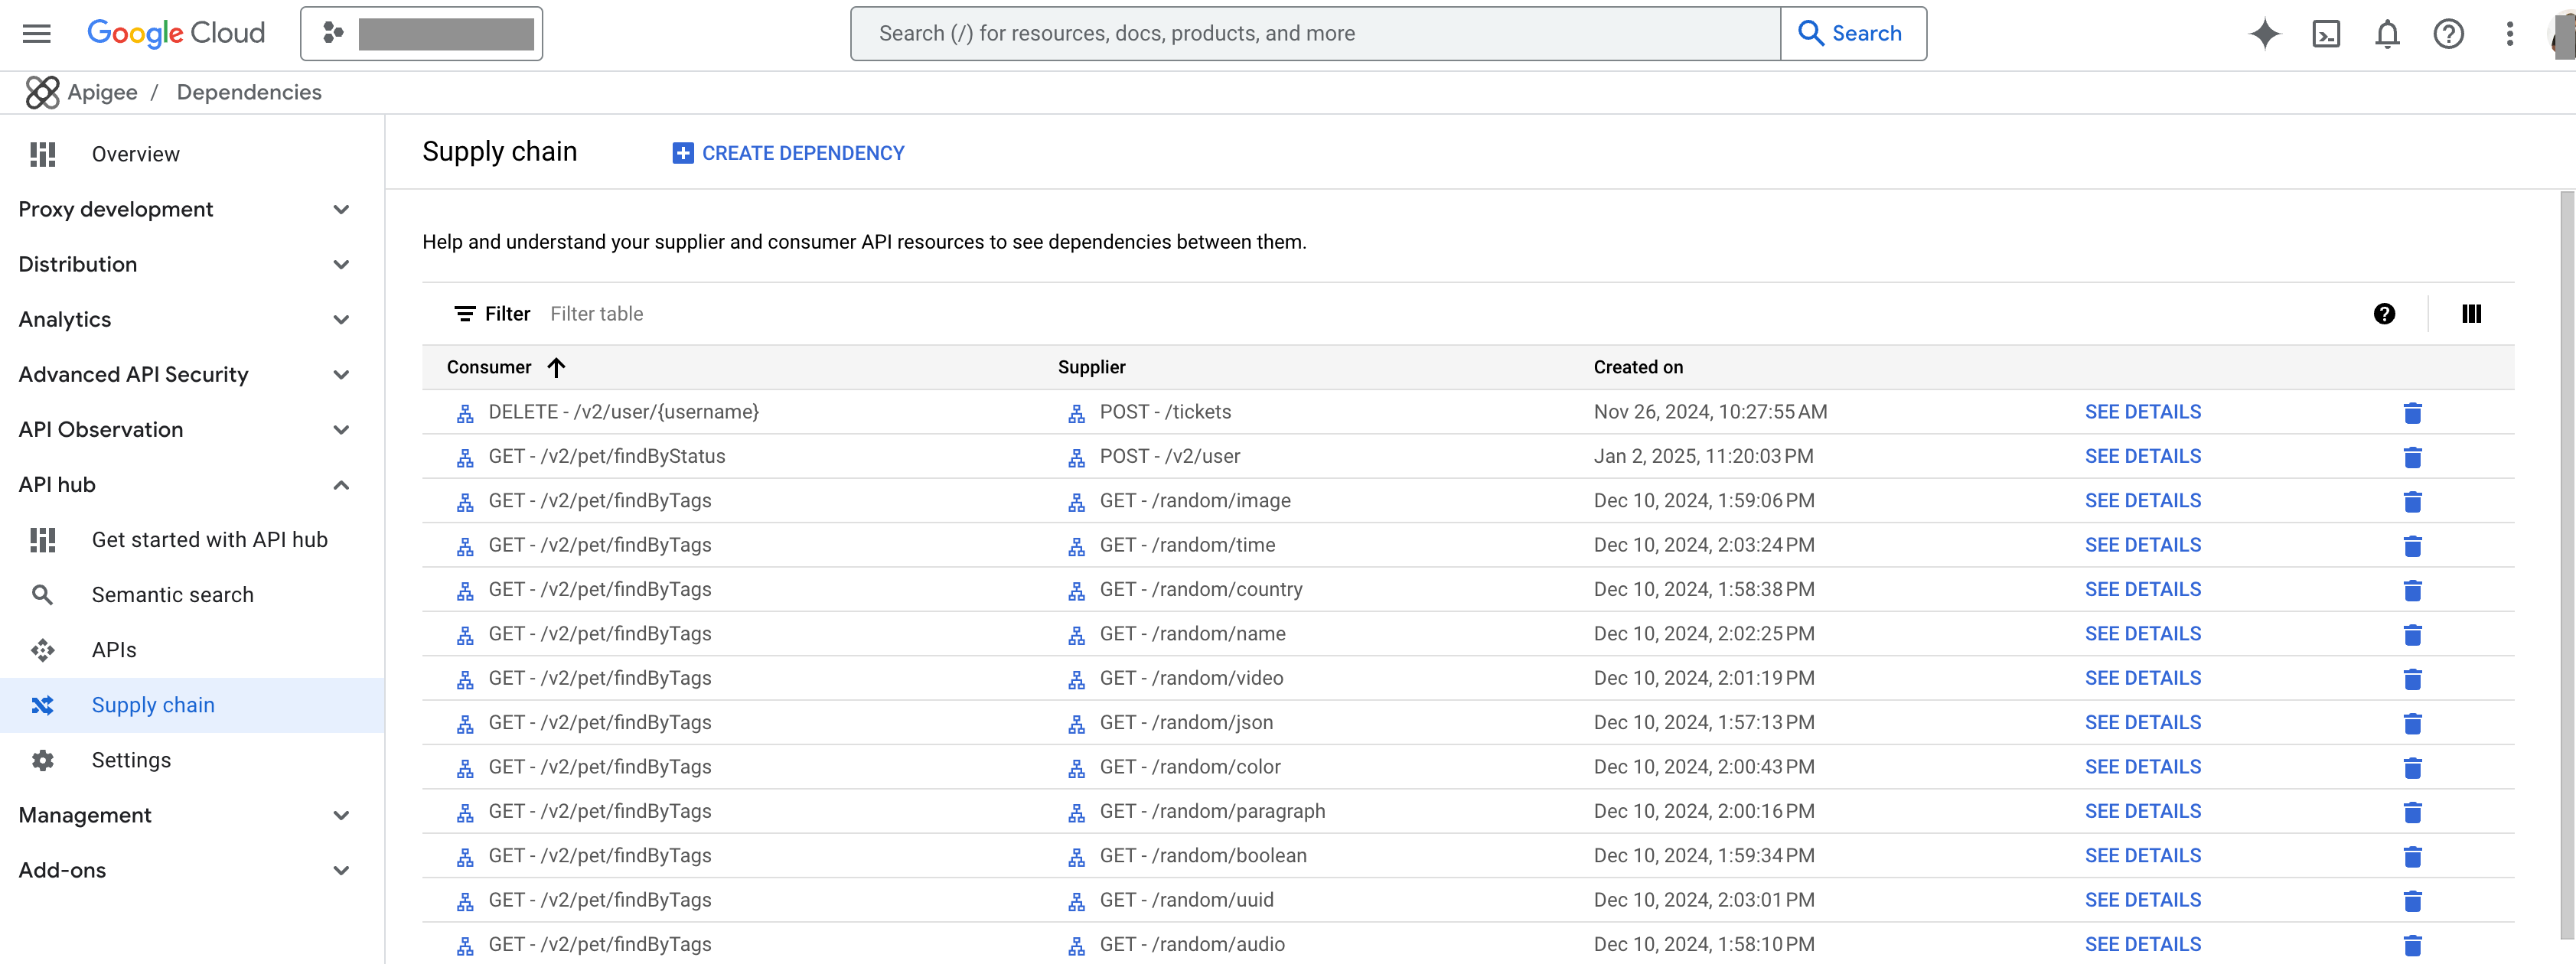
The API supply chain list view provides a tabular view of the dependencies between API hub Operations resources. To view the API supply chain list view, click API supply chain in the left navigation menu. The list view includes the following columns:
- Consumer: The name of the consumer API operation.
- Supplier: The name of the supplier API operation.
- Created on: The date and time when the dependency was created.
In the Filter field, if needed, specify supplier and/or consumer operations to return relevant dependencies. The filter feature lets you find all dependencies linked with specified operations.
The following image shows the API supply chain list view.
API supply chain graph view
The API supply chain graph view is an interactive directed graph, allowing you to explore and understand the dependencies within your API ecosystem.
The graph view consists of the following elements:
- Nodes
- Nodes represent the individual APIs, API versions, and API operations in your API ecosystem. Each node contains labels that indicate the operation or a related identifier.
- Central node: The central node is the starting point of the graph, and it represents the API that you are currently viewing. To re-assign another node as the central node, click the node's menu and select Set as central node.
- Upsteam and downstream nodes: Each node in the API supply chain graph contains the (expand dependencies) and (collapse dependencies) controls. Clicking these controls expands the graph to show the immediate dependencies, allowing you to quickly navigate to the upstream (supplier) and downstream (consumer) dependencies of that node.
- Edges
- Edges, connecting the nodes, represent the dependencies between the APIs, API versions, or API operations. The direction of an edge indicates the flow of dependency, from the supplier to the consumer. The edges are clickable, allowing you to view detailed information about the dependency such as the consumer and supplier details, dependency details, and the user defined attributes.
The following image shows an expanded API supply chain graph with a network of dependencies. For example, a central node labeled POST - /v2/pet is connected to several other nodes. This indicates that the POST - /v2/pet operation has dependencies on other operations (suppliers) and/or is a supplier to other operations (consumers).
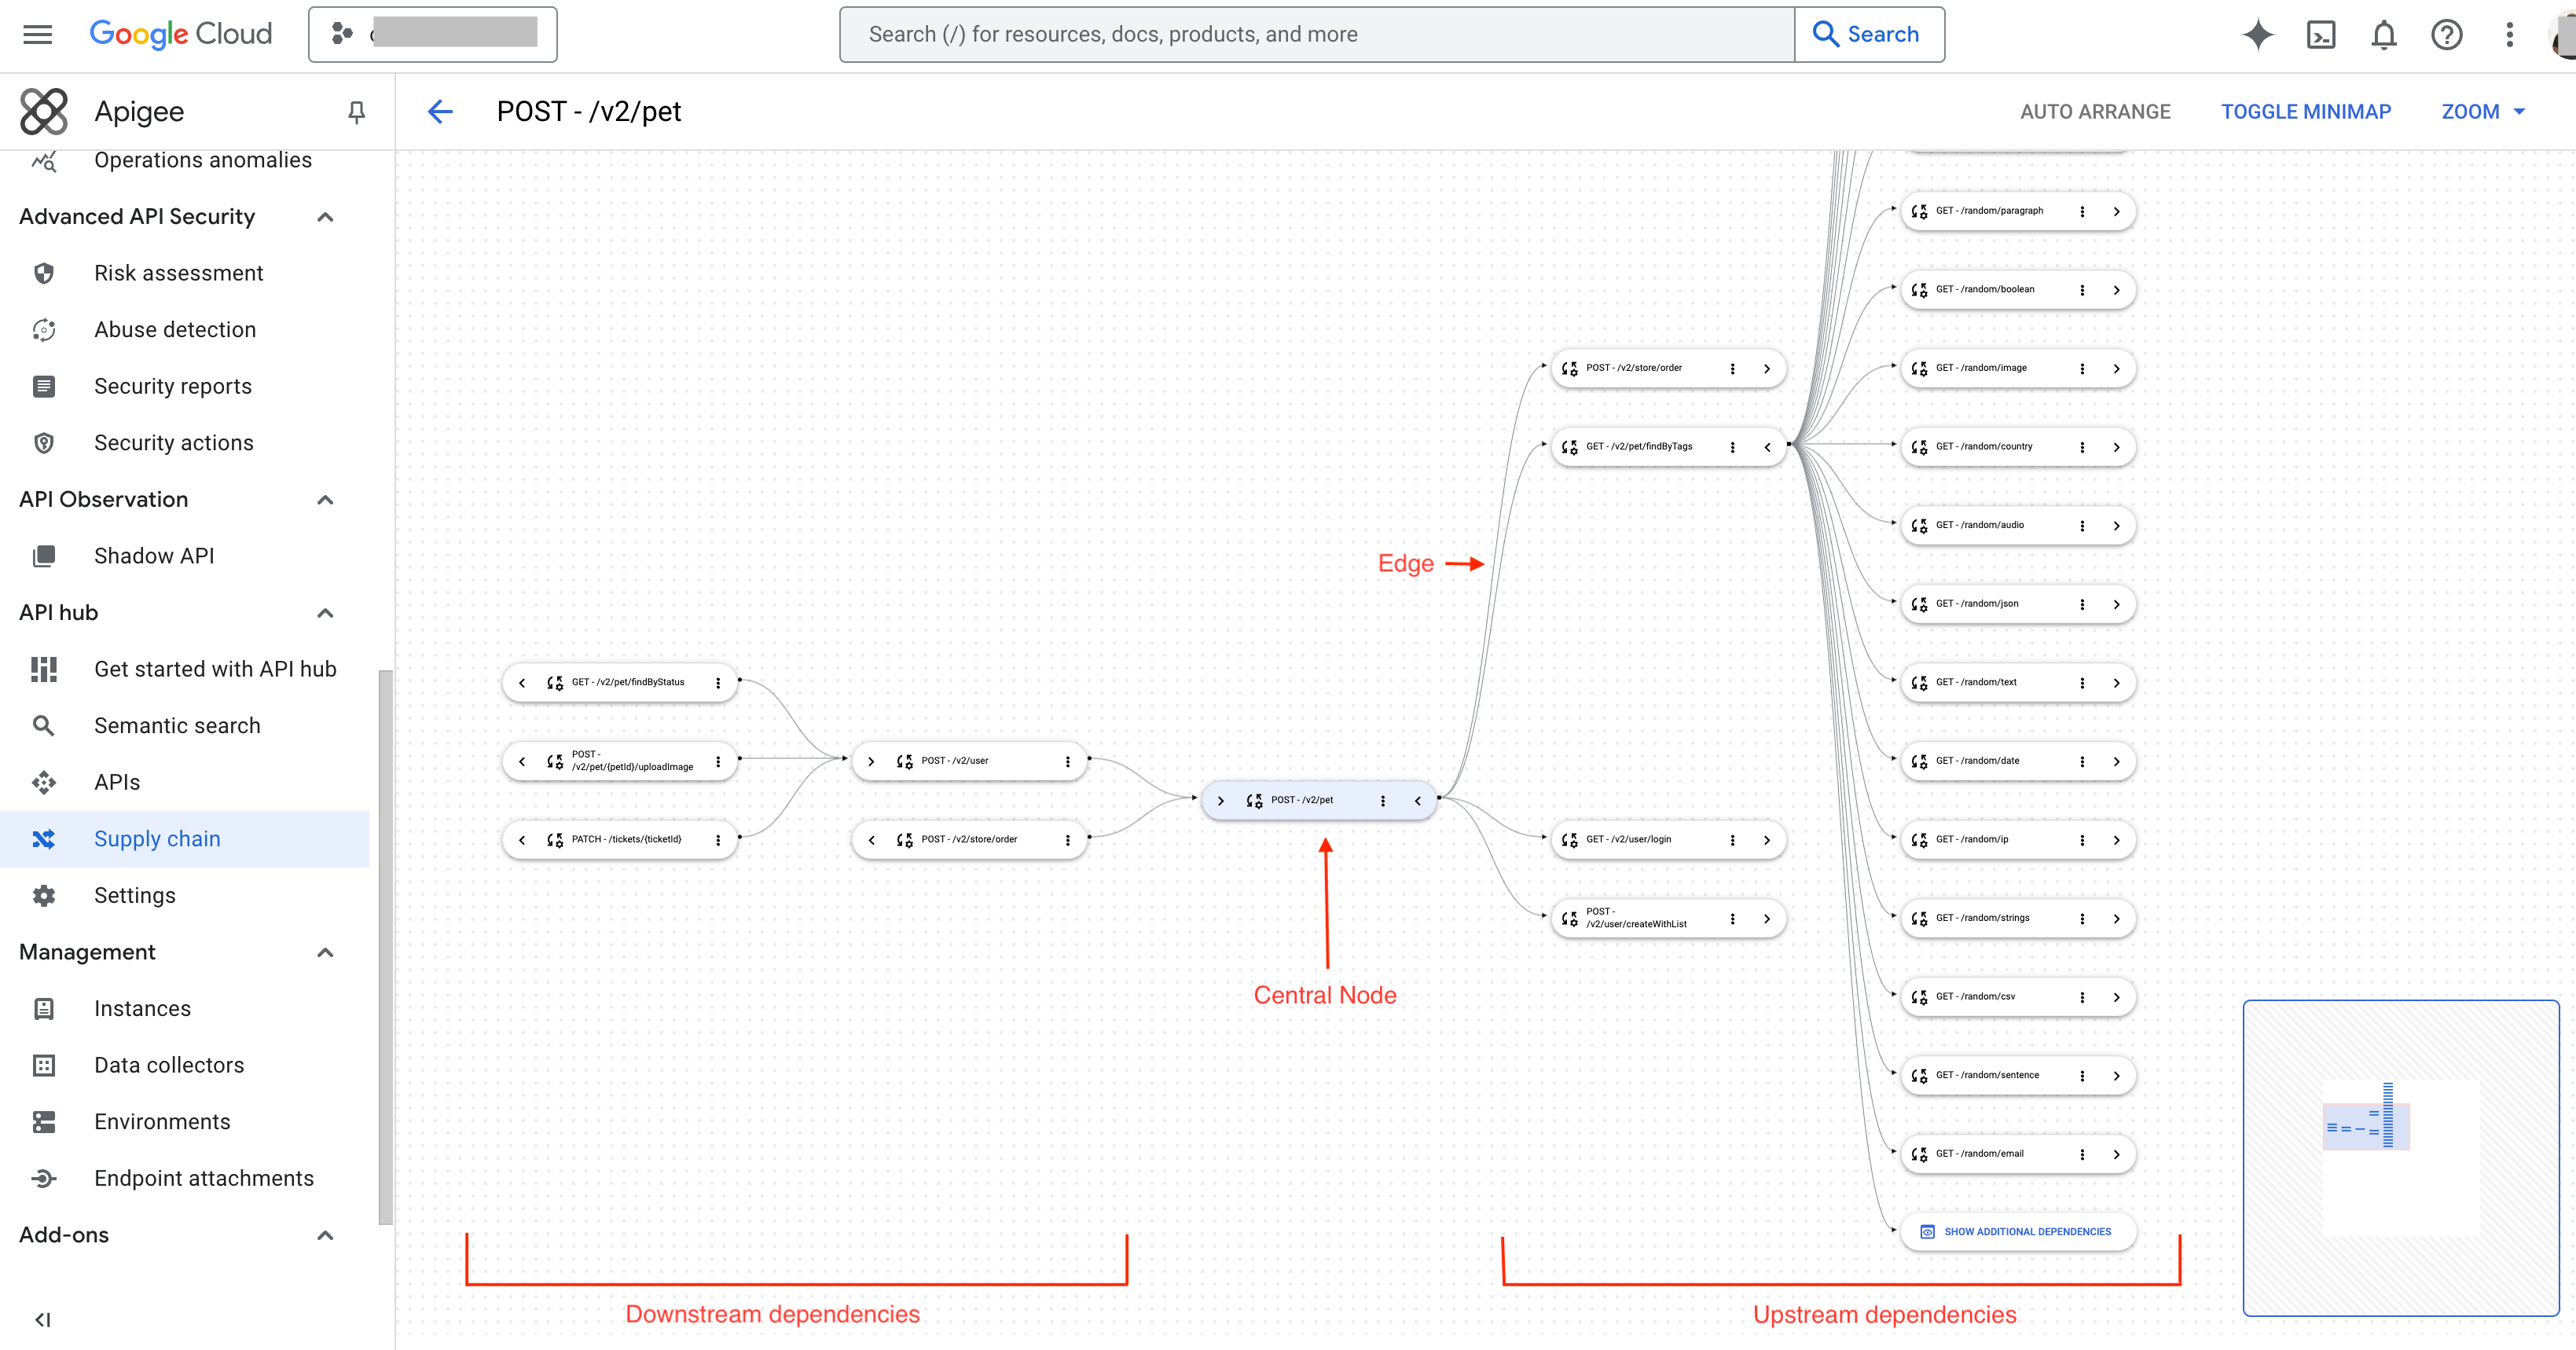
By exploring the graph, you can trace the relationships between this operation and others in your API ecosystem. You can change the central node to another operation to investigate its specific dependencies. You can also use the upstream/downstream controls to quickly expand the graph and see the immediate suppliers and consumers of any given operation.
What's next?
- Learn about how to create a dependency.
- Learn about how to manage dependencies.