This page applies to Apigee and Apigee hybrid.
View
Apigee Edge documentation.

What does this dashboard tell me?
The Proxy Performance dashboard helps you see API proxy traffic patterns and processing times. Use is to visualize how much traffic your APIs generate and how long it takes for API calls to be processed, from the time they are received by Apigee until they are returned to the client app.
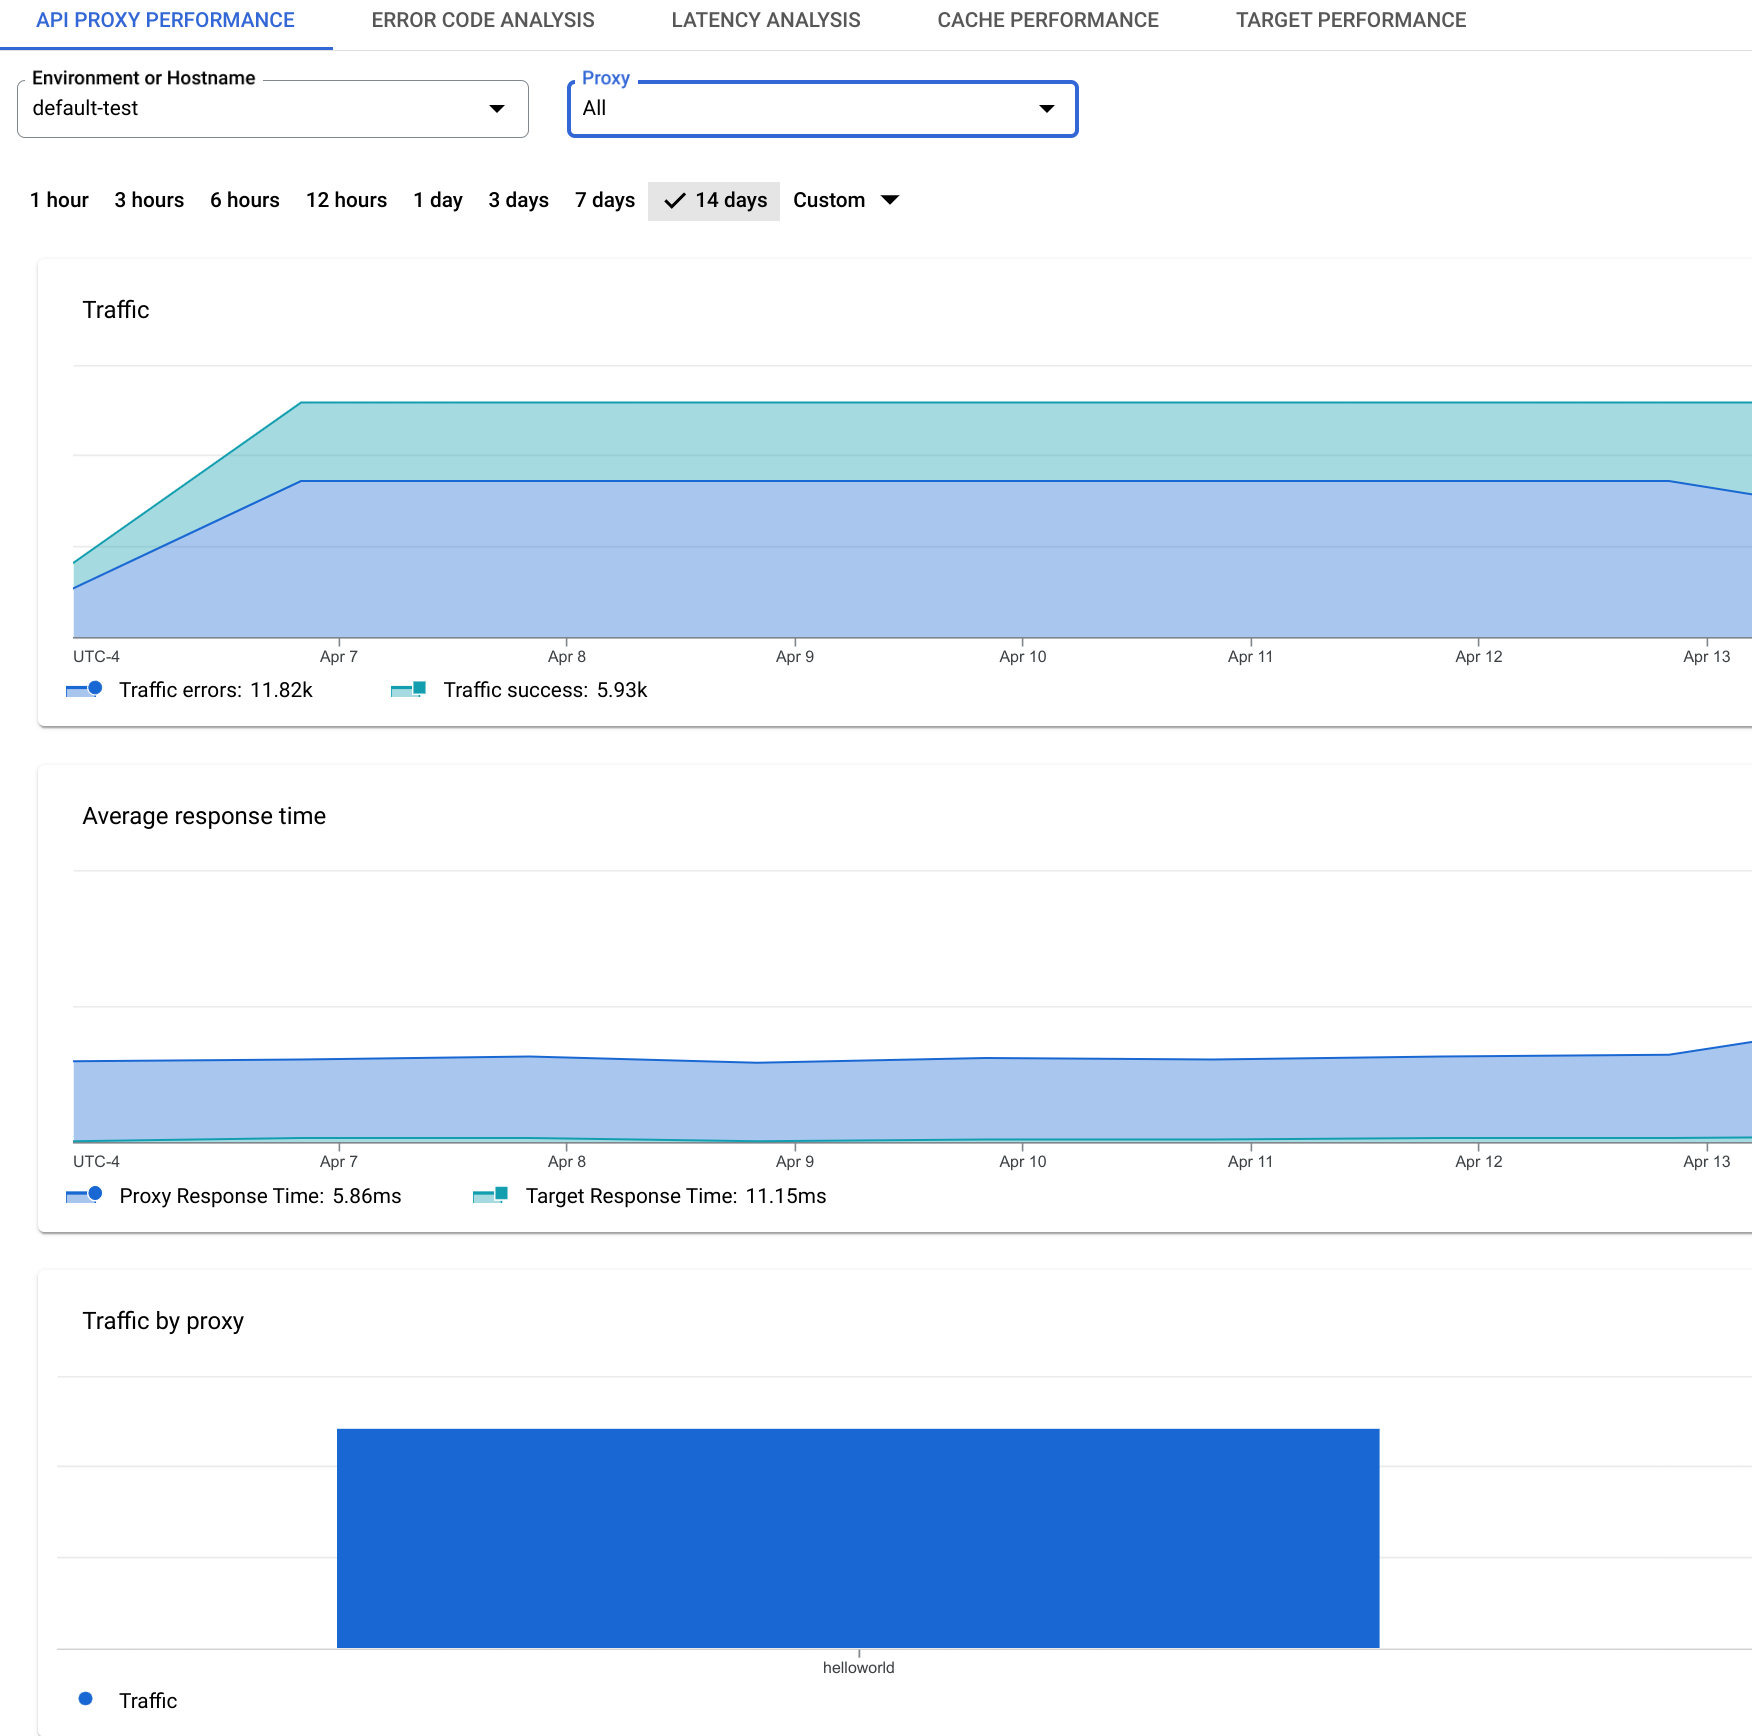
The API Proxy Performance dashboard
To access the Proxy Performance dashboard:
-
In the Google Cloud console, go to the Analytics > API metrics > API Proxy Performance page.
- Select an Environment or Hostname and one or All proxies in the Proxy list. Selecting All shows charts for all proxies including aggregated data for proxies. Selecting a single proxy shows charts with data for that proxy only.
- If desired, change the default time range. For example, you can view data for the last day or the last 14 days.
The API Proxy Performance view is shown. Aggregate metrics for each chart, such as the average transactions per second (Average TPS) are shown to the right of the chart
What does this dashboard measure?
This dashboard includes these charts:
- Average transactions per second (TPS)
- Traffic
- Average Response Time
- Traffic by Proxy
- Average Response Time by Proxy
Average transactions per second (TPS)
| Metric | Description |
|---|---|
| Average TPS | The average number of API requests and resulting responses per second. |
Traffic
| Metric | Description |
|---|---|
| Total Traffic | The total number of API requests received by Apigee for an API environment in an organization. |
| Traffic Success | The total number of requests that resulted in a successful response. Error responses do not count. |
| Traffic Errors | The total number of all API requests that are unsuccessful, that is, the request does not deliver a response as desired by the end user. The count includes both Proxy and Target errors. |
Average Response Time
See also this interesting article on the Apigee Community site: When can the Average Total Response Time be less than the Average Target Response Time?
| Metric | Description |
|---|---|
| Average Response Time |
The average of the Total Response Time measured for all API calls made to an Apigee organization environment. The Total Response Time is the amount of time it takes for an API call to Apigee to return (in milliseconds). Or, put another way, total response time is the time measured from when an entire API call is received on Apigee to the time Apigee begins sending a response back to the client app. This chart measures the average for all proxies. For individual proxies, see the Average Response Time by Proxy chart below. |
| Average Proxy Response Time |
This value is calculated as the average of the Total Response Time minus the Target Response Time for all API calls made to an Apigee organization environment. It's basically a measure of how much time the API calls spend flowing through Apigee itself (in milliseconds). |
| Average Target Response Time |
The average number of milliseconds that it takes from the point the last byte of a request is sent from Apigee to a backend target to the time Apigee receives the last byte of the response. It's basically measuring how much time the API call spends on the target system. |
Average proxy response time is calculated as the difference between the averages of total response time and target response time. The expectation is that total response time is always greater than the target response time. However, there are also calls which are handled by the proxy itself - preflight requests, cached responses, Oauth tokens etc which do not reach the backend system. These "faster" calls by the proxy reduce the average Total Response time without reducing the Target response time. Hence the average total response time may not always be greater than the average target response time which could result in negative values being seen for proxy response time. When you look at larger TPS without zooming in the time scale too much, these exceptions will not hold much weight and hence give you more accurate and actionable data.
You obtain the most meaningful average response data when a large number of requests are collected over a long period of time, rather than from just a few requests collected over a short period of time. If you only observe a small number of requests that come in over a short time period, there's a chance that even one call that does not go to the target will result in a negative average proxy response time. When evaluating average response times, it's best to view longer time frames that have high traffic.
Traffic by Proxy
| Metric | Description |
|---|---|
| <Proxy name> | For the specified API proxy, the number of recorded API requests and responses. |
Average Response Time by Proxy
| Metric | Description |
|---|---|
| <Proxy name> |
For the specified API proxy, the average of the Total Response Time measured for all API calls made to an Apigee environment. The Total Response Time is the amount of time it takes for an API call to Apigee to return (in milliseconds).
Hover over the graph to see the total amount of time spent on the proxy side and the
target side, as well as the average.
|