This page applies to Apigee and Apigee hybrid.
View
Apigee Edge documentation.
![]()
Operations Anomalies overview
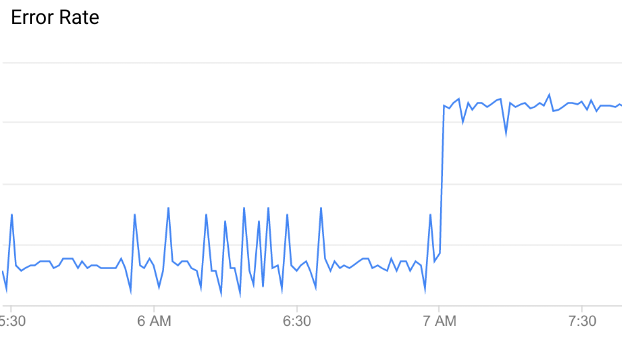
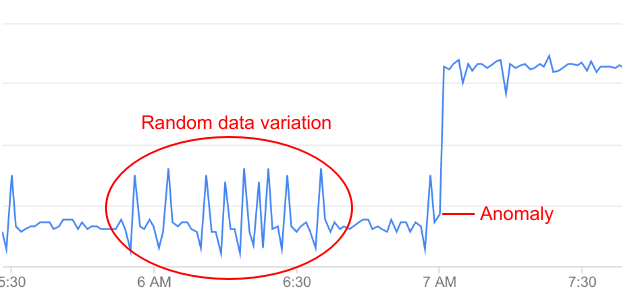
Operations Anomalies identifies unusual or unexpected API data patterns on your APIs, based on recent data patterns. For example, in this graph of API error rate, the error rate suddenly jumps up at around 7 AM. Compared to the data leading up to that time, this increase is unusual enough to be classified as an anomaly.

Not all variations in API data represent anomalies: most are random fluctuations. For example, you can see some minor variations in error rate leading up to the anomaly, but these are not significant enough to be categorized as an anomaly.

Operations Anomalies continually monitors API data and performs statistical analysis to distinguish true anomalies from random fluctuations in the data.
Operations Anomalies automatically detects these anomaly types:
- Increase in HTTP 503 errors at the organization, environment, and region level
- Increase in HTTP 504 errors at the organization, environment, and region level
- Increase in all HTTP 4xx or 5xx errors at the organization, environment, and region level
- Increase in the total response latency for the 90th percentile (p90) at the organization, environment, and region level
A detected anomaly includes this information:
- The metric that caused the anomaly, such as proxy latency or an HTTP error code.
- The severity of the anomaly. The severity can be slight, moderate, or severe, based on its confidence level in the model. A low confidence level indicates that the severity is slight, while a high confidence level indicates that it is severe.
Prerequisites for using Operations Anomalies
To use Operations Anomalies:
- The AAPI Ops add-on must be enabled for your organization. See Enable AAPI Ops in an organization.
- Users of Operations Anomalies must have the required roles for AAPI Ops.
- Users who
investigate anomalies in the dashboard
also need the
roles/logging.viewerrole.
View detected Operations Anomalies
When Operations Anomalies detects an anomaly, it displays the anomaly details in the Operations Anomalies dashboard. You can investigate the anomaly in the API Monitoring dashboards and take appropriate action if necessary. You can also create an alert to notify you if similar events occur in future.
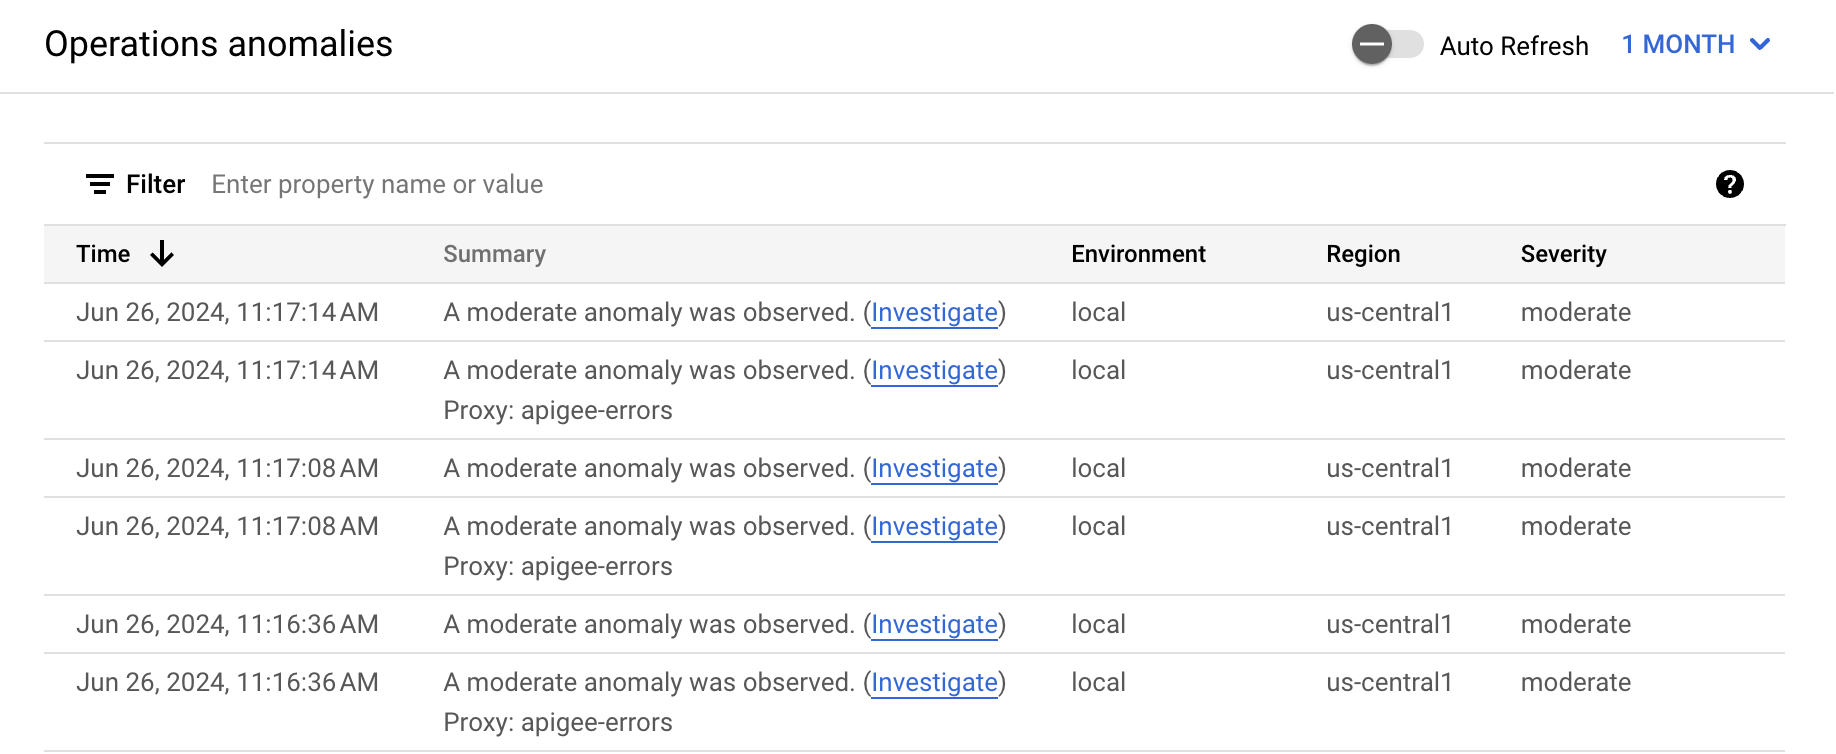
The Operations Anomalies dashboard in the Apigee UI is your primary source of information about detected Operations Anomalies. The dashboard displays a list of recent anomalies.
To open the Operations Anomalies dashboard:
In the Google Cloud console, go to the Analytics > Operations Anomalies page.
- Switch to the organization that you want to monitor.
This displays the Operations Anomalies dashboard.

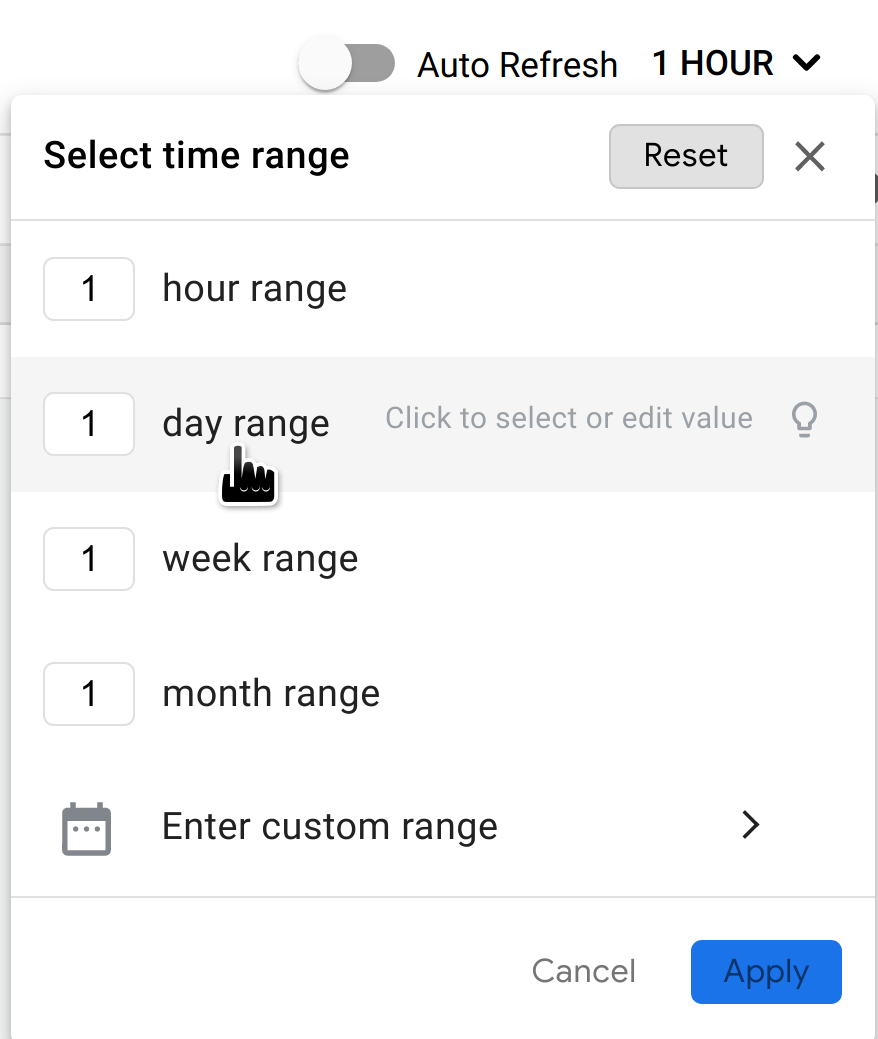
By default, the dashboard shows anomalies that have occurred during the previous hour. If no anomalies have been detected during that time period, no rows are displayed in the dashboard. You can select a larger time range from the time range menu in the top right of the dashboard.

Each row in the table corresponds to a detected anomaly, and displays the following information:
- The date and time of the anomaly.
- A brief summary of the anomaly, including the proxy in which it occurred and the fault code that triggered it.
- The environment in which the anomaly occurred.
- The region where the anomaly occurred.
- The severity of the anomaly event: slight, moderate, or severe. Severity is based on a statistical measure (p-value) of how unlikely it would be for the event to occur by chance (the more unlikely the event, the greater its severity).
You can also investigate an anomaly in the API Monitoring dashboards, which shows various graphs of recent API traffic data.
How anomaly detection works
Anomaly detection involves the following stages:
Train models
Operations Anomalies works by training a model of the behavior of your API proxies from historical time-series data. There is no action required on your part to train the model. Apigee automatically creates and trains models for you from the previous six hours of API data. Therefore, Apigee requires a minimum of six hours of data on an API proxy to train the model before it can log an anomaly.
The goal of training is to improve the accuracy of the model, which can then be tested on historical data. The simplest way to test a model's accuracy is to calculate its error rate—the sum of false positives and false negatives, divided by the total number of predicted events.
Log anomaly events
At runtime, Operations Anomalies compares the current behavior of your API proxies with the behavior predicted by the model. Operations Anomalies can then determine, with a specific confidence level, when an operational metric is exceeding the predicted value. For example, when the rate of 5xx errors exceeds the rate predicted by the model.
When Apigee detects an anomaly, it automatically logs the event in the Operations Anomalies dashboard. The list of events displayed in the dashboard includes all detected anomalies, as well as triggered alerts.
