Apigee hybrid makes debug, analytics, and deployment status data available to you. This data is
collected by a data collection pod which sends it to the management plane so that you can view and
analyze it and set up monitoring and alerts.
About the data
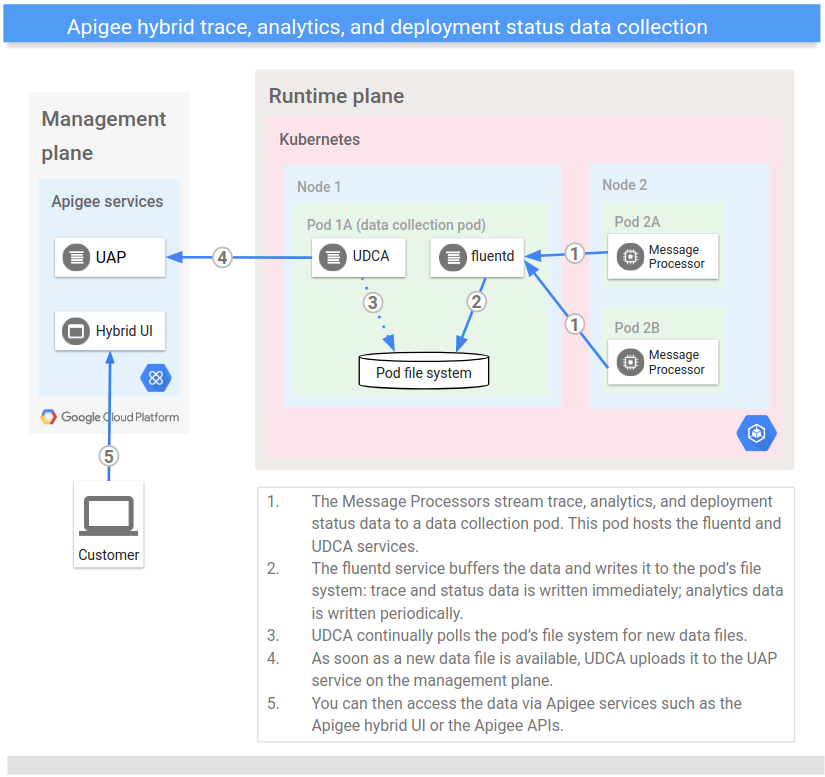
All Message Processor (MP) services in hybrid stream debug (when initiated), analytics,
and deployment status data via
TCP to a data collection pod in the cluster. The data collection pod stores the streamed data on the
pod's file system via a fluentd service.
The UDCA (Universal Data Collection Agent) periodically extracts the stored data and sends it to
the UAP (Unified Analytics Platform) service in the management plane. The UAP processes the incoming
analytics and deployment status data and makes it available to you via the hybrid UI or the
Apigee APIs.
Apigee hybrid implements the data collection pod as a ReplicaSet with a minimum of two
replicas.
The following image shows the debug, analytics, and deployment status data collection process:
Note that the debug, analytics, and deployment status data is not stored in the
same location or accessed in the same way as the logging and metrics data:
Logging and metrics data are stored on your GCP Project and
accessed via a tool such as Cloud Operations or whatever you choose to
use.
Debug, analytics and deployment status data, on the other hand, is
stored in the hybrid management plane and you access it via
Apigee services such as the hybrid UI or Apigee APIs.
The following table summarizes the data collected by the data collection pod:
Type of Data
Dataset Name
Description
Update Frequency
APIs
Analytics
api
API usage data including transactions per second, cache usage,
errors, latencies, request/response sizes, and traffic counts.
Debug session data for API proxies. This data includes the request/response parameters
along with transformations applied to them at policy execution time.
Because of its size, debug data—unlike analytics and deployment status data—is
not collected all the time. Instead, debug data is collected when you initiate a debug
session.
This section describes how to view the debug, analytics, and deployment status data in the Apigee
hybrid UI.
Debug
Debug data for hybrid services is accessible in the same way as Edge debug data, with some
differences such as increased filter support. For more
information, see Debug overview.
Analytics
Analytics data for hybrid services is accessible in the same way
as Edge analytics data. For more information, see
Using the analytics dashboards in
the Edge documentation.
To set how and where debug, analytics, and deployment status data is
collected on the data collection pod, you configure the UDCA
service via its configuration properties. The UDCA properties
include properties that are general to the UDCA as well as
properties that are specific to each dataset.
To configure the UDCA:
Open the overrides.yaml file for editing on your Kubernetes administration machine, as described in
Manage runtime plane components.
Set the values of the UDCA configuration settings. For the UDCA, you can set custom values for
properties such as:
Polling interval
Number of replicas (min and max)
Target CPU percentage (that triggers additional replicas)
For a complete list of UDCA properties that you can customize,
see udca.
Save your changes to the overrides.yaml file.
Apply your changes to your cluster by executing the apigeectl apply command, as
the following example shows:
[[["Easy to understand","easyToUnderstand","thumb-up"],["Solved my problem","solvedMyProblem","thumb-up"],["Other","otherUp","thumb-up"]],[["Hard to understand","hardToUnderstand","thumb-down"],["Incorrect information or sample code","incorrectInformationOrSampleCode","thumb-down"],["Missing the information/samples I need","missingTheInformationSamplesINeed","thumb-down"],["Other","otherDown","thumb-down"]],["Last updated 2025-08-26 UTC."],[[["\u003cp\u003eApigee hybrid collects debug, analytics, and deployment status data from Message Processor services, streaming it to a data collection pod.\u003c/p\u003e\n"],["\u003cp\u003eThe Universal Data Collection Agent (UDCA) extracts stored data from the pod and sends it to the Unified Analytics Platform (UAP) in the management plane for processing.\u003c/p\u003e\n"],["\u003cp\u003eDebug data, unlike analytics and deployment status data, is only collected when a debug session is initiated, due to its size.\u003c/p\u003e\n"],["\u003cp\u003eUsers can view and analyze the collected data through the Apigee hybrid UI or via Apigee APIs.\u003c/p\u003e\n"],["\u003cp\u003eThe UDCA service can be configured via the \u003ccode\u003eoverrides.yaml\u003c/code\u003e file to customize data collection settings such as polling intervals and the number of pod replicas.\u003c/p\u003e\n"]]],[],null,["| You are currently viewing version 1.9 of the Apigee hybrid documentation. **This version is end of life.** You should upgrade to a newer version. For more information, see [Supported versions](/apigee/docs/hybrid/supported-platforms#supported-versions).\n\nApigee hybrid makes debug, analytics, and deployment status data available to you. This data is\ncollected by a data collection pod which sends it to the management plane so that you can view and\nanalyze it and set up monitoring and alerts.\n\nAbout the data\n\nAll Message Processor (MP) services in hybrid stream debug (when initiated), analytics,\nand deployment status data via\nTCP to a data collection pod in the cluster. The data collection pod stores the streamed data on the\npod's file system via a fluentd service.\n\nThe UDCA (Universal Data Collection Agent) periodically extracts the stored data and sends it to\nthe UAP (Unified Analytics Platform) service in the management plane. The UAP processes the incoming\nanalytics and deployment status data and makes it available to you via the hybrid UI or the\n[Apigee APIs](/apigee/docs/reference/apis/apigee/rest).\n\nApigee hybrid implements the data collection pod as a [ReplicaSet](https://kubernetes.io/docs/concepts/workloads/controllers/replicaset/) with a minimum of two\nreplicas.\n\nThe following image shows the debug, analytics, and deployment status data collection process:\n\nNote that the debug, analytics, and deployment status data is not stored in the\nsame location or accessed in the same way as the logging and metrics data:\n\n- *Logging and metrics data* are stored on your GCP Project and accessed via a tool such as Cloud Operations or whatever you choose to use.\n- *Debug, analytics and deployment status data* , on the other hand, is stored in the hybrid management plane and you access it via Apigee services such as the hybrid UI or [Apigee APIs](/apigee/docs/reference/apis/apigee/rest).\n\nThe following table summarizes the data collected by the data collection pod:\n\n| Type of Data | Dataset Name | Description | Update Frequency | APIs |\n|-------------------|--------------|--------------------------------------------------------------------------------------------------------------------------------------------------------------------------------------------------------------------------------------------------------------------------------------------------------------------------------------------------------------------------------------------------------------------------------------------|-----------------------|-----------------------------------------------------------------------------------------------------------------------------------------------------------------------------------------------------------------------------------------------------------|\n| Analytics | `api` | API usage data including transactions per second, cache usage, errors, latencies, request/response sizes, and traffic counts. For more information, see [Apigee Analytics overview](/apigee/docs/api-platform/analytics/analytics-services-overview). | Up to 30 second delay | [Analytics admin API](/apigee/docs/reference/apis/apigee/rest/v1/organizations.environments.analytics.admin) |\n| Deployment Status | `event` | The current deployment status of the API proxy. For more information about how you can see this information, see [View deployment status](/apigee/docs/api-platform/deploy/ui-deploy-overview#viewing-deployment-status). | Immediately | [Deployments API](/apigee/docs/reference/apis/apigee/rest/v1/organizations.deployments) |\n| Debug | `debug` | Debug session data for API proxies. This data includes the request/response parameters along with transformations applied to them at policy execution time. Because of its size, debug data---unlike analytics and deployment status data---is not collected all the time. Instead, debug data is collected when you initiate a debug session. For more information, see [Debug overview](/apigee/docs/api-platform/debug/trace-overview). | Immediately | [Debug session API](/apigee/docs/reference/apis/apigee/rest/v1/organizations.environments.apis.revisions.debugsessions) [Debug session data API](/apigee/docs/reference/apis/apigee/rest/v1/organizations.environments.apis.revisions.debugsessions.data) |\n\n| **TIP:** The *dataset name* is the name by which this type of data is referred to in the UDCA configuration properties. For example, analytics data is configured with the dataset name `api`. As a result, the configuration property that sets the location of the analytics data files is called **api**`DataSubDir`.\n|\n| You can access this data through the Apigee hybrid UI or [Apigee APIs](/apigee/docs/reference/apis/apigee/rest) on the management\n| plane.\n\nView the data in the hybrid UI\n\nThis section describes how to view the debug, analytics, and deployment status data in the Apigee\nhybrid UI.\n\nDebug\n\nDebug data for hybrid services is accessible in the same way as Edge debug data, with some\ndifferences such as increased filter support. For more\ninformation, see [Debug overview](/apigee/docs/api-platform/debug/trace-overview).\n\nAnalytics\n\nAnalytics data for hybrid services is accessible in the same way\nas Edge analytics data. For more information, see\n[Using the analytics dashboards](/apigee/docs/api-platform/analytics/using-analytics-dashboards) in\nthe Edge documentation.\n\nProxy deployment status\n\nFor information on viewing deployment status, see\n[View\ndeployment status](/apigee/docs/api-platform/deploy/ui-deploy-overview#viewing-deployment-status).\n\nConfigure the data collection\n\nTo set how and where debug, analytics, and deployment status data is\ncollected on the data collection pod, you configure the UDCA\nservice via its configuration properties. The UDCA properties\ninclude properties that are general to the UDCA as well as\nproperties that are specific to each dataset.\n\n**To configure the UDCA:**\n\n1. Open the `overrides.yaml` file for editing on your Kubernetes administration machine, as described in [Manage runtime plane components](/apigee/docs/hybrid/v1.3/customize-services).\n2. Set the values of the UDCA configuration settings. For the UDCA, you can set custom values for properties such as:\n - Polling interval\n - Number of replicas (min and max)\n - Target CPU percentage (that triggers additional replicas)\n\n For a complete list of UDCA properties that you can customize,\n see [`udca`](/apigee/docs/hybrid/v1.9/config-prop-ref#udca).\n3. Save your changes to the overrides.yaml file.\n4. Apply your changes to your cluster by executing the `apigeectl apply` command, as the following example shows: \n\n ```\n apigeectl apply -f my-overrides.yaml --org --env env-name\n ```\n | **TIP** : To see the default configuration properties, the UDCA service (under `udca:`) in the [Configuration property reference](/apigee/docs/hybrid/v1.3/config-prop-ref).\n\n For more information about the `apply` command, see\n [Apply the cluster configuration](/apigee/docs/hybrid/v1.9/cli-reference#apply)."]]