This page applies to Apigee and Apigee hybrid.
View
Apigee Edge documentation.

What does this dashboard tell me?
The Target Performance dashboard helps you visualize traffic patterns and performance metrics for API proxy backend targets.
The Target Performance dashboard
To access the Target Performance dashboard:
In the Google Cloud console, go to the Analytics > API metrics > Target Performance page.
The Target Performance view is shown:
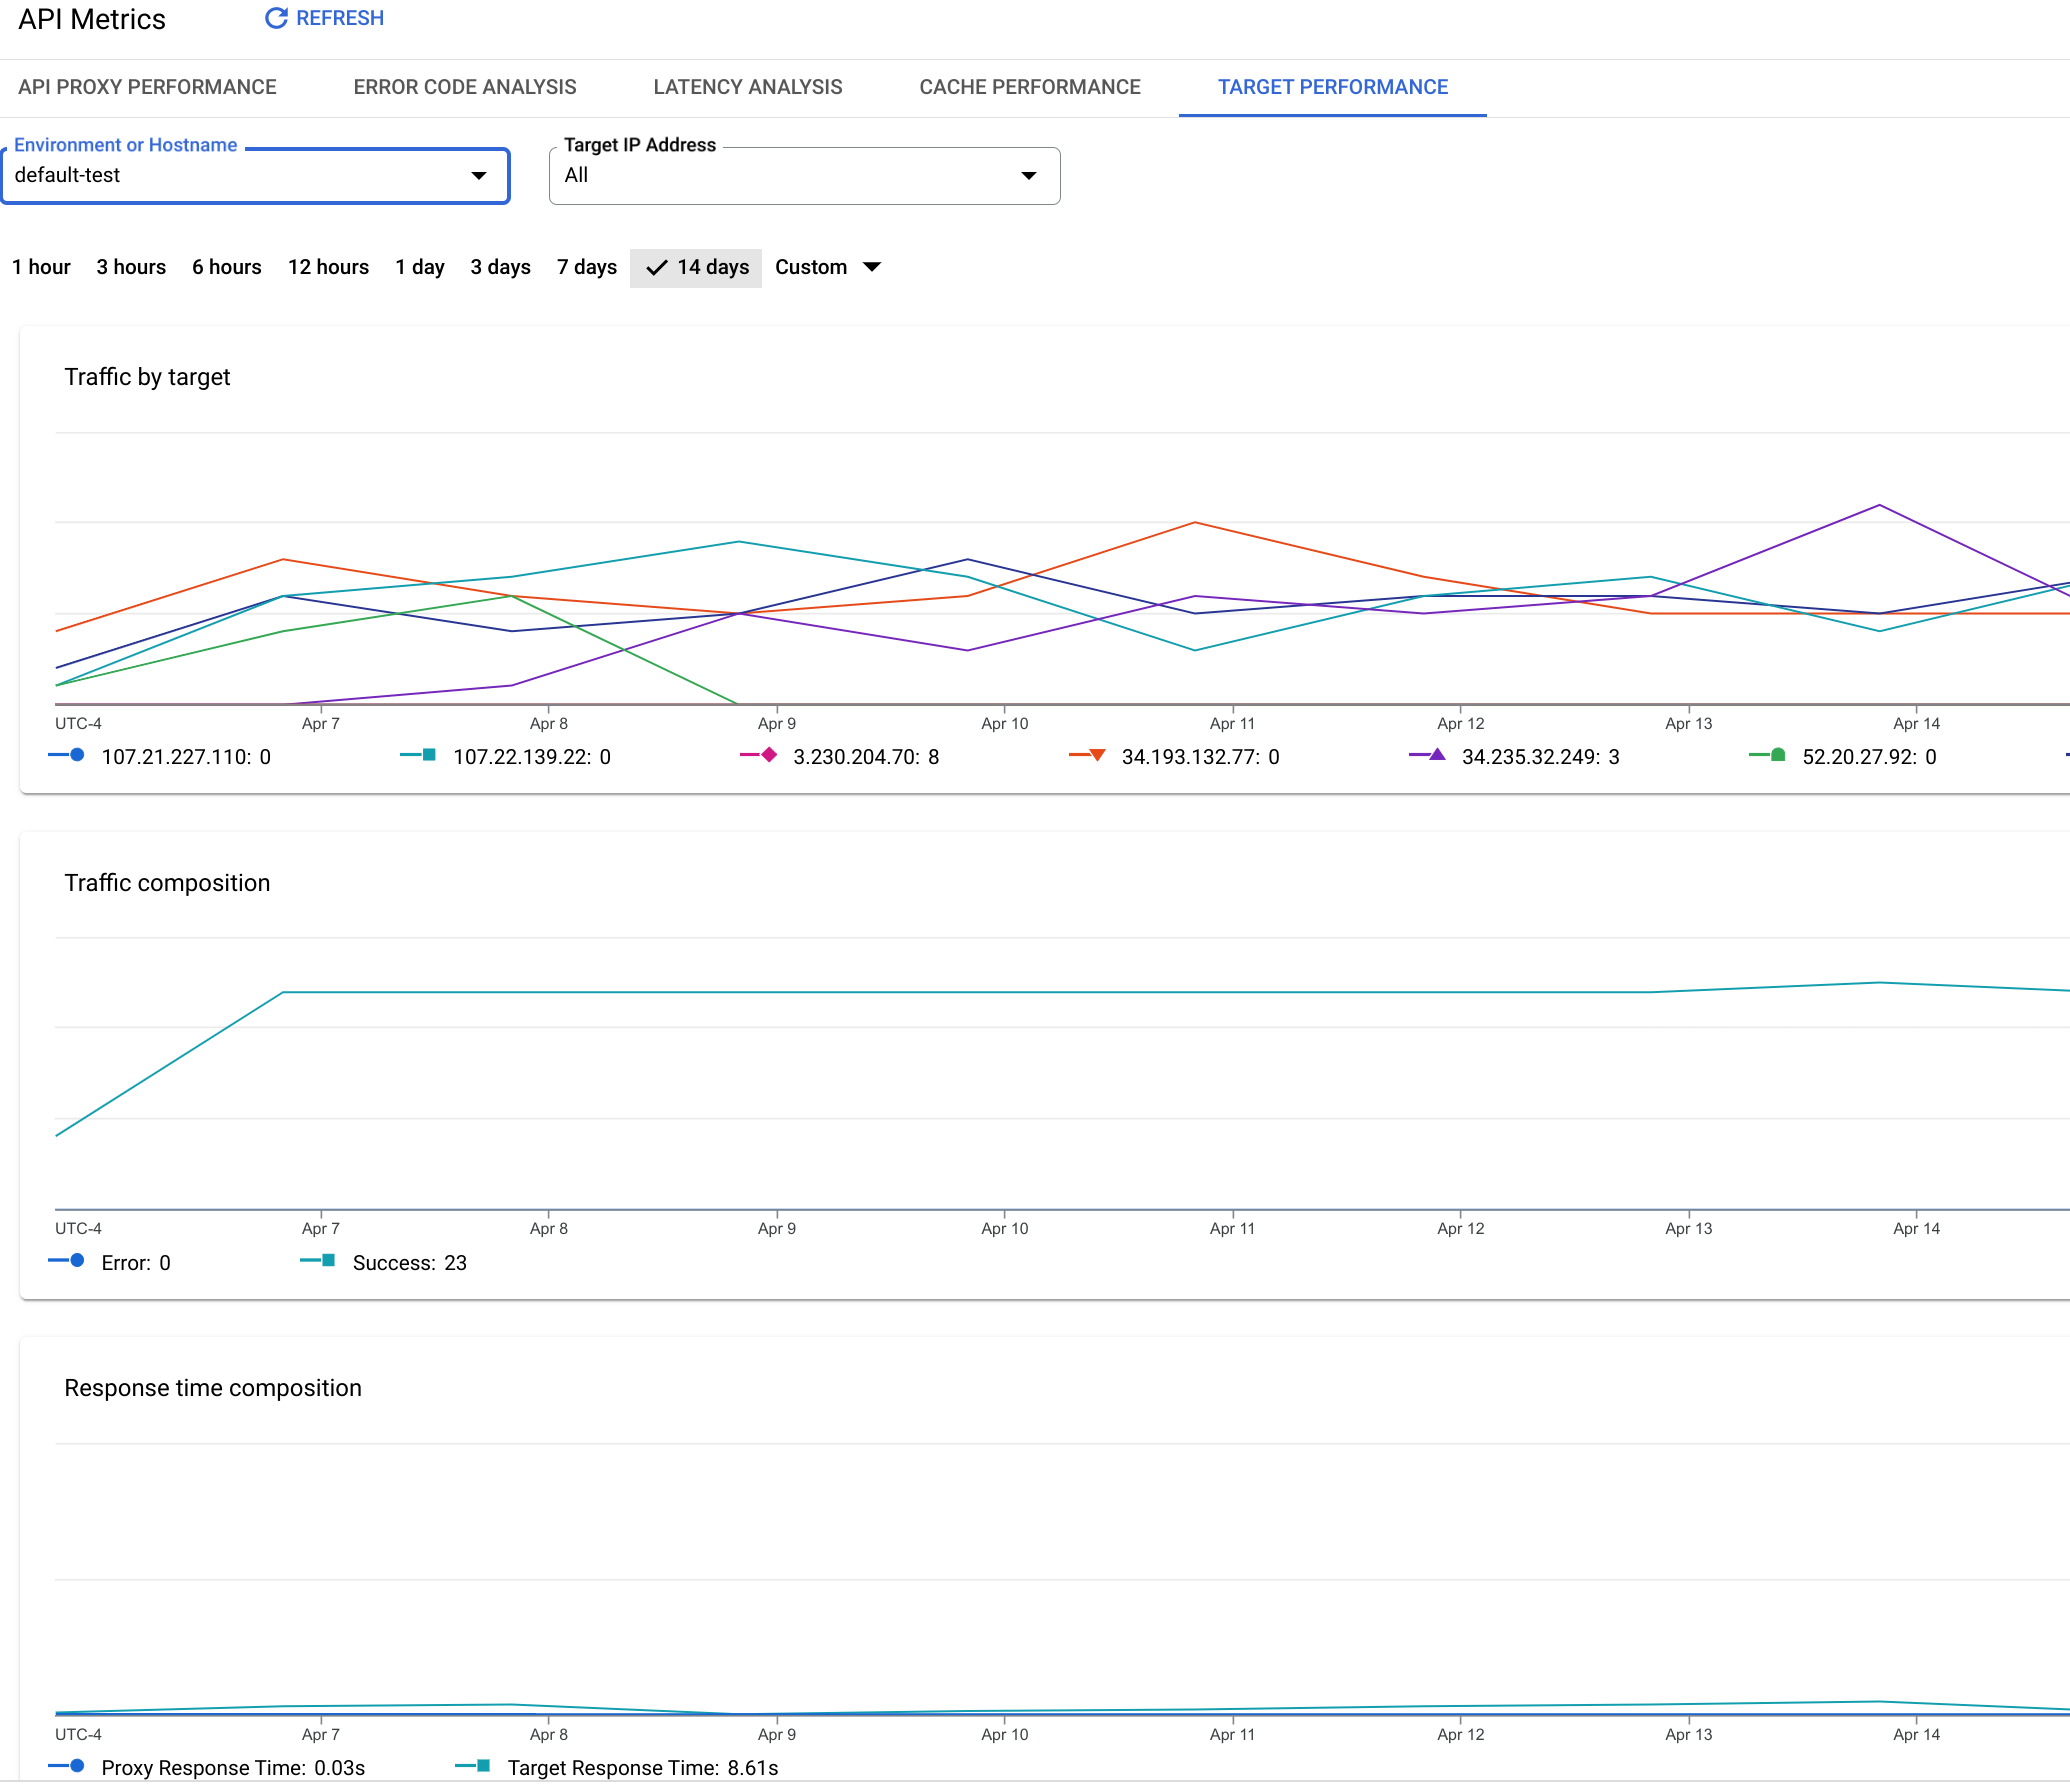
What does this dashboard measure?
Traffic by Target
| Metric | Description |
|---|---|
| All Targets Traffic | Measures the total amount of traffic that passes from Apigee to all backend targets. |
| <Target name> |
Measures the total amount of traffic that passes from Apigee to the specified backend target. |
Traffic
| Metric | Description |
|---|---|
| Total Traffic | Measures the total amount of traffic that passes from Apigee to all backend targets. Same as All Targets Traffic. |
| Errors | The total number of requests to backend targets that resulted in an unsuccessful response. Error responses do not count. |
| Success | The total number of all requests to backend targets that are successful (that do not return an error). |
Response Time
See also this interesting article on the Apigee Community site: When can the Average Total Response Time be less than the Average Target Response Time?
| Metric | Description |
|---|---|
| Average Time |
The average of the Total Response Time measured for all API calls made to an Apigee organization environment. The Total Response Time is the amount of time it takes for an API call to Apigee to return (in milliseconds). Or, put another way, total response time is the time measured from when an entire API call is received on Apigee to the time Apigee begins sending a response back to the client app. |
| Average Target Time |
The average number of milliseconds that it takes from the point the last byte of a request is sent from Apigee to a backend target to the time Apigee receives the last byte of the response. It's basically measuring how much time the API call spends on the target system. |
| Average Proxy Time |
This value is calculated as the Total Response Time minus the Target Response Time. It's basically a measure of how much time the API call spends flowing through Apigee itself (in milliseconds). |
Target Errors
| Metric | Description |
|---|---|
| Total Errors | Measures the total number of errors sent from backend targets to Apigee. |
| 3XX Errors | Measures the total number of HTTP 3XX sent from backend targets to Apigee. |
| 4XX Errors | Measures the total number of HTTP 4XX errors sent from backend targets to Apigee. |
| 5XX Errors | Measures the total number of HTTP 5XX sent from backend targets to Apigee. |
Payload Size
| Metric | Description |
|---|---|
| Total Payload Size | The total payload size for all requests and responses between Apigee and backend targets. |
| Request Payload Size | The total payload size for all requests sent from Apigee to backend targets. |
| Response Payload Size | The total payload size for all responses sent from backend targets to Apigee. |