Dasbor Peristiwa Anomali di UI Apigee adalah sumber informasi utama Anda tentang
anomali API yang terdeteksi. Dasbor menampilkan daftar anomali terbaru.
Sebelum membuka dasbor, pastikan Anda telah diberi
peran yang diperlukan
untuk AAPI Ops.
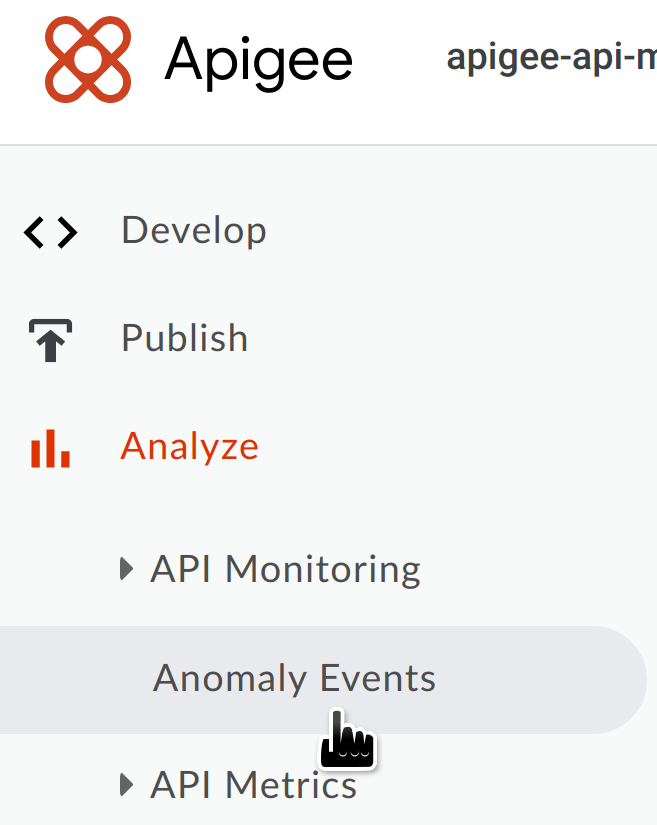
Di panel navigasi, pilih Analyze > Anomaly Events.
Tindakan ini akan menampilkan dasbor Peristiwa Anomali.
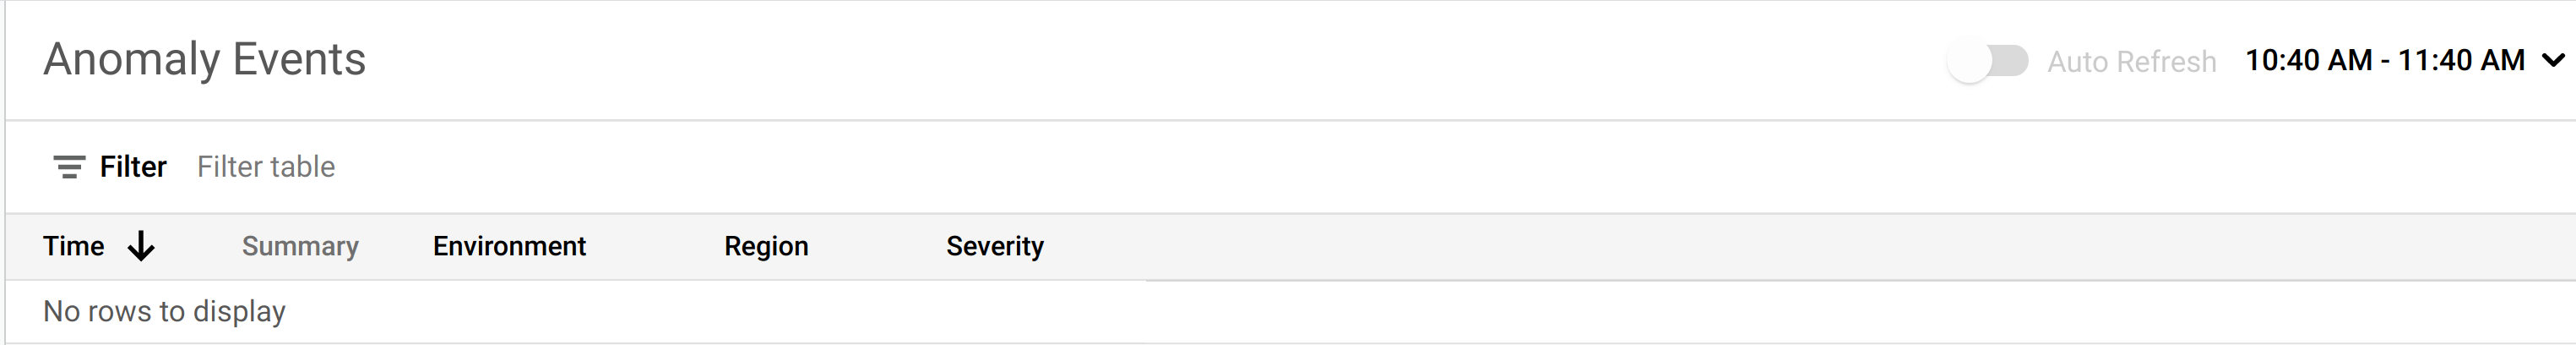
Secara default, dasbor menampilkan anomali yang terjadi selama satu jam sebelumnya.
Jika tidak ada anomali yang terdeteksi selama jangka waktu tersebut, tidak ada baris yang
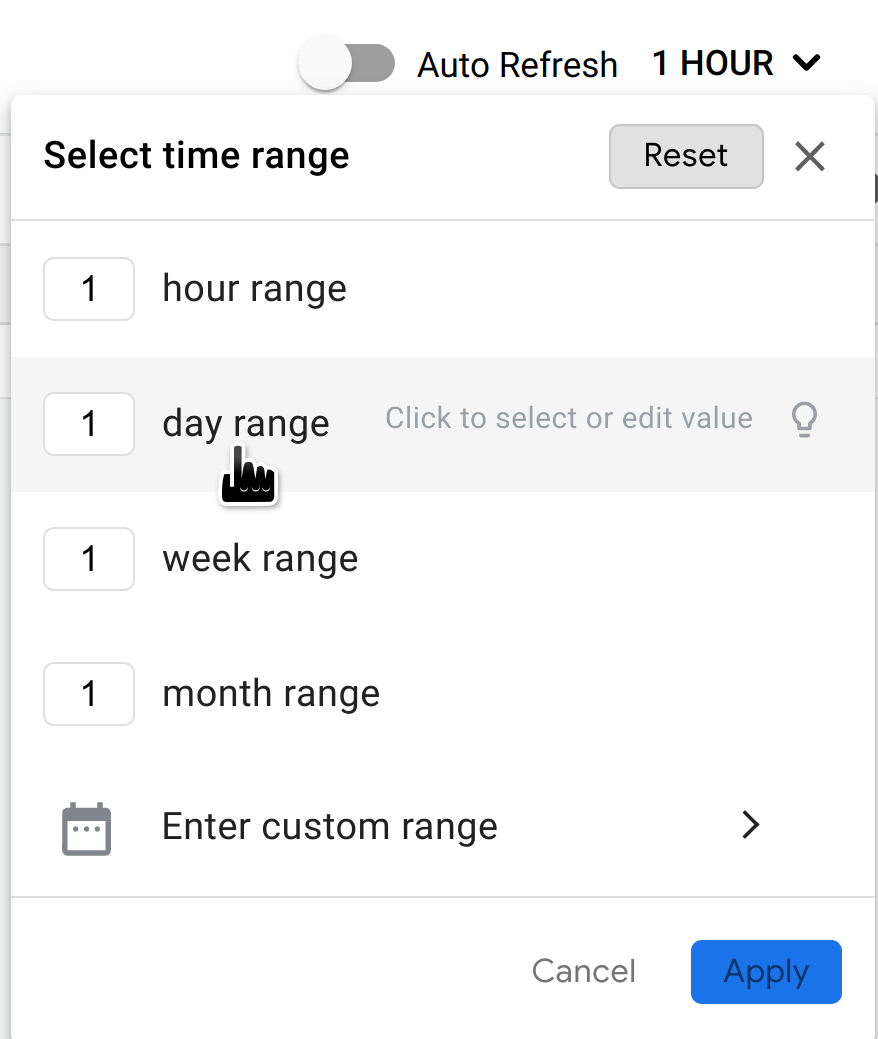
ditampilkan di dasbor. Dalam hal ini, Anda dapat memilih rentang waktu yang lebih besar dari menu rentang waktu di kanan atas dasbor.
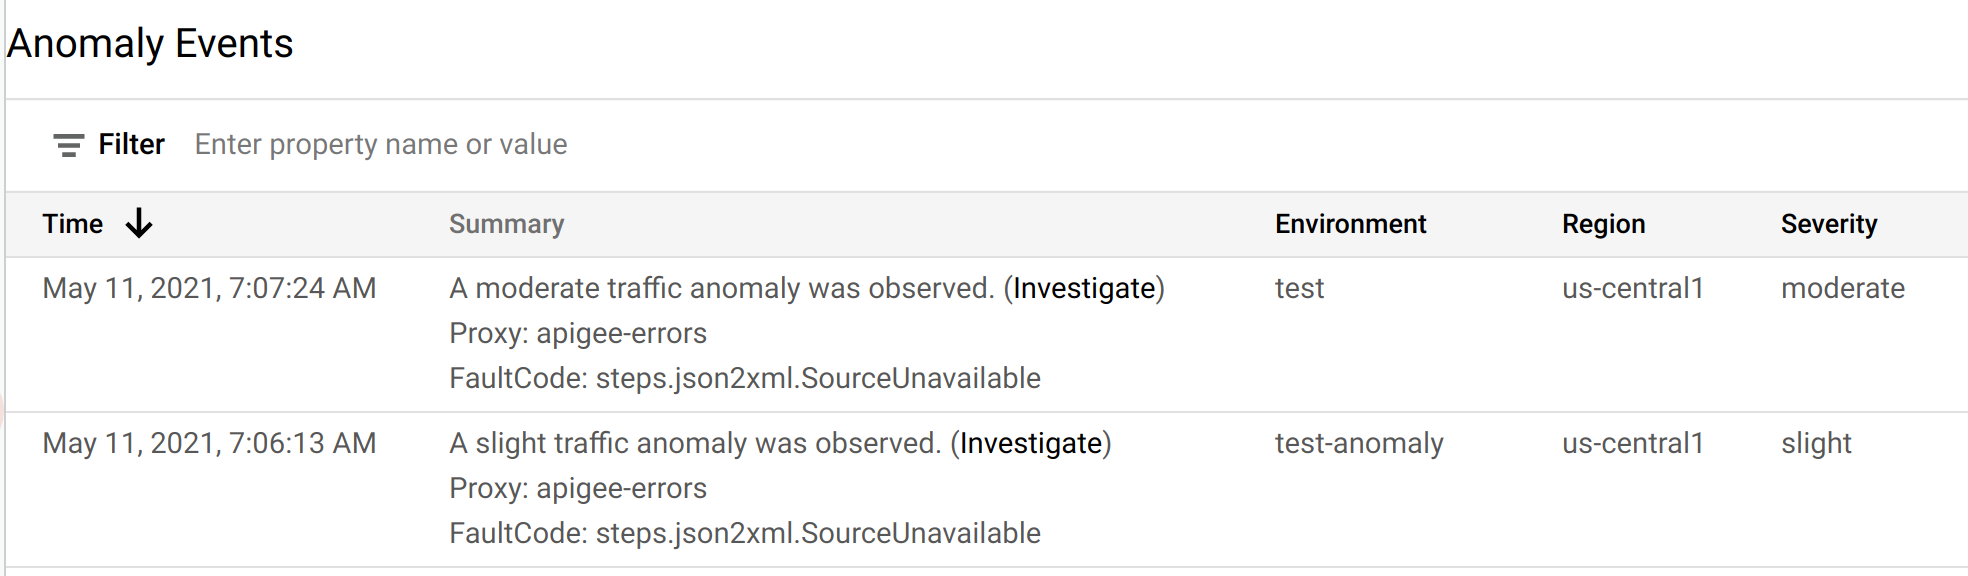
Jika ada anomali dalam rentang waktu ini, anomali tersebut akan ditampilkan dengan cara yang sama seperti yang ditampilkan di bawah.
Setiap baris dalam tabel sesuai dengan anomali yang terdeteksi, dan menampilkan informasi berikut:
Tanggal dan waktu anomali.
Ringkasan singkat tentang anomali, termasuk proxy tempat anomali terjadi dan kode
error yang memicunya.
Lingkungan tempat anomali terjadi.
Wilayah tempat anomali terjadi.
Tingkat keparahan peristiwa anomali: ringan, sedang, atau berat. Tingkat keparahan
didasarkan pada pengukuran statistik (nilai p) tentang seberapa kecil kemungkinan terjadinya
peristiwa secara kebetulan (semakin kecil kemungkinan peristiwa, semakin besar tingkat keparahannya).
Anda dapat menyelidiki anomali lebih lanjut untuk
menentukan tindakan yang harus Anda lakukan sebagai respons, jika ada.
Tempat terbaik untuk memulai penyelidikan adalah di
dasbor Monitoring API, tempat Anda dapat melihat berbagai grafik data traffic API
terbaru. Bagian berikutnya,
Menyelidiki anomali, menjelaskan cara melakukannya.
[[["Mudah dipahami","easyToUnderstand","thumb-up"],["Memecahkan masalah saya","solvedMyProblem","thumb-up"],["Lainnya","otherUp","thumb-up"]],[["Sulit dipahami","hardToUnderstand","thumb-down"],["Informasi atau kode contoh salah","incorrectInformationOrSampleCode","thumb-down"],["Informasi/contoh yang saya butuhkan tidak ada","missingTheInformationSamplesINeed","thumb-down"],["Masalah terjemahan","translationIssue","thumb-down"],["Lainnya","otherDown","thumb-down"]],["Terakhir diperbarui pada 2025-08-18 UTC."],[[["\u003cp\u003eThis page covers anomaly detection in Apigee and Apigee hybrid, focusing on the Anomaly Events dashboard in the Apigee UI.\u003c/p\u003e\n"],["\u003cp\u003eTo view anomalies, users must be subscribed to AAPI Ops and have the \u003ccode\u003eroles/logging.viewer\u003c/code\u003e role, along with other required AAPI Ops roles.\u003c/p\u003e\n"],["\u003cp\u003eThe Anomaly Events dashboard displays recent API anomalies, including details such as the date, time, summary, environment, region, and severity.\u003c/p\u003e\n"],["\u003cp\u003eThe dashboard defaults to showing anomalies from the previous hour, but users can adjust the time range to view anomalies from a different period.\u003c/p\u003e\n"],["\u003cp\u003eDetected anomalies in the dashboard can be further investigated in the API Monitoring dashboards to determine appropriate actions.\u003c/p\u003e\n"]]],[],null,["# Using the Anomaly Events dashboard\n\n*This page\napplies to **Apigee** and **Apigee hybrid**.*\n\n\n*View [Apigee Edge](https://docs.apigee.com/api-platform/get-started/what-apigee-edge) documentation.*\n\n| **Important:** \"Anomaly Detection\" describes the Advanced API Operations Anomaly Detection functionality, which is available in the Classic Apigee UI. This functionality is comparable to the \"Operations Anomalies\" functionality in [Apigee UI in Cloud console](https://console.cloud.google.com/apigee). Both are available at this time. See [Operations Anomalies overview](/apigee/docs/api-platform/analytics/operations-anomalies-overview) for information on the Operations Anomalies functionality.\n\nThe Anomaly Events dashboard in the Apigee UI is your primary source of information about\ndetected API anomalies. The dashboard displays a list of recent anomalies.\n| **Notes:** To view anomalies in the dashboard, you must:\n|\n| - Be subscribed to AAPI Ops. [Contact Apigee](https://cloud.google.com/contact) to learn more.\n| - Be assigned the role `roles/logging.viewer`, in addition to the other [required roles for AAPI Ops](/apigee/docs/aapi-ops#required-roles-for-aapi-ops).\n\nBefore opening the dashboard, make sure you have been assigned the\n[required roles](/apigee/docs/aapi-ops#required-roles-for-aapi-ops)\nfor AAPI Ops.\n\nTo open the anomalies dashboard: \n\n### Apigee in Cloud Console\n\n1. In the Google Cloud console, go to the **Operations anomalies** page.\n\n [Go to Operations anomalies](https://console.cloud.google.com/apigee/analytics/operations-anomalies)\n2. [Switch to\n the organization](/apigee/docs/api-platform/get-started/switch-org) that you want to monitor.\n\nBy default, the dashboard shows anomalies that have occurred during the previous hour.\nIf no anomalies have been detected during that time period, no rows are\ndisplayed in the dashboard. In that case, you can select a larger time range from\nthe time range menu in the top right of the dashboard.\n\nEach row in the table corresponds to a detected anomaly,\nand displays the following information:\n\n- The date and time of the anomaly.\n- A brief summary of the anomaly, including the proxy in which it occurred and the fault code that triggered it.\n- The environment in which the anomaly occurred.\n- The region where the anomaly occurred.\n- The severity of the anomaly event: slight, moderate, or severe. Severity is based on a statistical measure (p-value) of how unlikely it would be for the event to occur by chance (the more unlikely the event, the greater its severity).\n\nYou can further investigate an anomaly to\ndetermine what actions, if any, you should take in response.\nThe best place to start your investigation is in the\nAPI Monitoring dashboards, where you can see various graphs of recent API traffic\ndata. The next section, [Investigating anomalies](/apigee/docs/aapi-ops/investigate-anomalies), describes how to do this.\n\n### Classic UI\n\n1. Sign in to [Apigee UI](https://apigee.google.com).\n\n **Note:** Open the Apigee UI in a new tab if you want to\n follow the steps below.\n2. [Switch to the organization](/apigee/docs/api-platform/get-started/switch-org) that you want to monitor.\n3. In the navigation pane, select **Analyze \\\u003e Anomaly Events** .\n\n\nThis displays the Anomaly Events dashboard.\n\nBy default, the dashboard shows anomalies that have occurred during the previous hour.\nIf no anomalies have been detected during that time period, no rows are\ndisplayed in the dashboard. In that case, you can select a larger time range from\nthe time range menu in the top right of the dashboard.\n\nIf there are anomalies in this time range, they are displayed similarly to the ones shown\nbelow.\n\nEach row in the table corresponds to a detected anomaly,\nand displays the following information:\n\n- The date and time of the anomaly.\n- A brief summary of the anomaly, including the proxy in which it occurred and the fault code that triggered it.\n- The environment in which the anomaly occurred.\n- The region where the anomaly occurred.\n- The severity of the anomaly event: slight, moderate, or severe. Severity is based on a statistical measure (p-value) of how unlikely it would be for the event to occur by chance (the more unlikely the event, the greater its severity).\n\nYou can further investigate an anomaly to\ndetermine what actions, if any, you should take in response.\nThe best place to start your investigation is in the\nAPI Monitoring dashboards, where you can see various graphs of recent API traffic\ndata. The next section, [Investigating anomalies](/apigee/docs/aapi-ops/investigate-anomalies), describes how to do this."]]