Halaman beranda adalah tempat Anda membuat dan mengakses semua aset Looker Studio, yaitu laporan, sumber data, dan eksplorasi. Halaman ini membantu Anda memahami tiga antarmuka pengguna utama Looker Studio.
Keterangan halaman beranda Looker Studio:
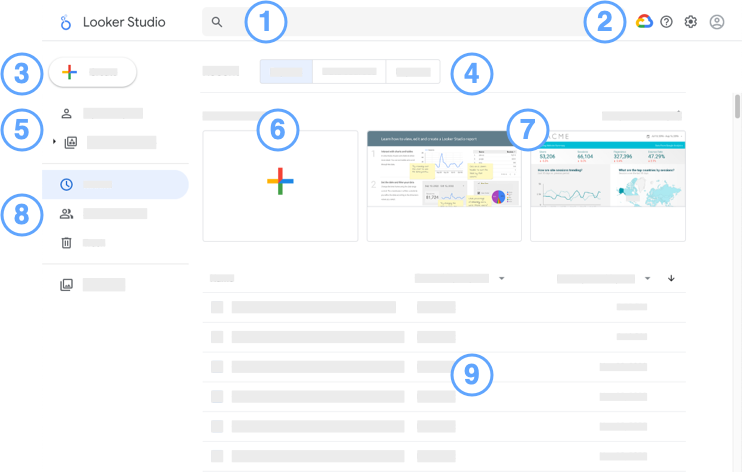
 Kotak input Penelusuran Looker Studio: Temukan aset Looker Studio dengan cepat.
Opsi:
- Ikon
 Google Cloud Platform: Akses konsol Google Cloud .
  Ikon Opsi bantuan: Dapatkan bantuan dan berikan masukan.
 Ikon Setelan pengguna: Melihat setelan pengguna.
 Ikon Akun Google: Kelola Akun Google Anda.
- Ikon
Tombol
 Buat: Buat aset baru (laporan, sumber data, atau eksplorasi).
Tab Jenis aset. Menampilkan laporan, sumber data, atau eksplorasi.
Ruang kerja (Looker Studio).
Buat laporan baru.
Laporan tutorial dan template.
Filter daftar aset untuk menampilkan aset terbaru, termasuk aset yang Anda miliki, aset yang dibagikan kepada Anda, dan aset apa pun di sampah.
Daftar aset. Klik aset untuk melihatnya.
- Di sebelah kanan, gunakan menu tambahan
 aset untuk membagikan, mengganti nama, atau menghapusnya.
 - Urutkan aset menurut nama, pemilik, atau tanggal.
- Di sebelah kanan, gunakan menu tambahan
Memahami seluk-beluk editor laporan
Untuk mengedit laporan, cari laporan di daftar aset, buka aset, lalu di kanan atas, klik ![]() EDIT.
EDIT.
Legenda editor laporan:
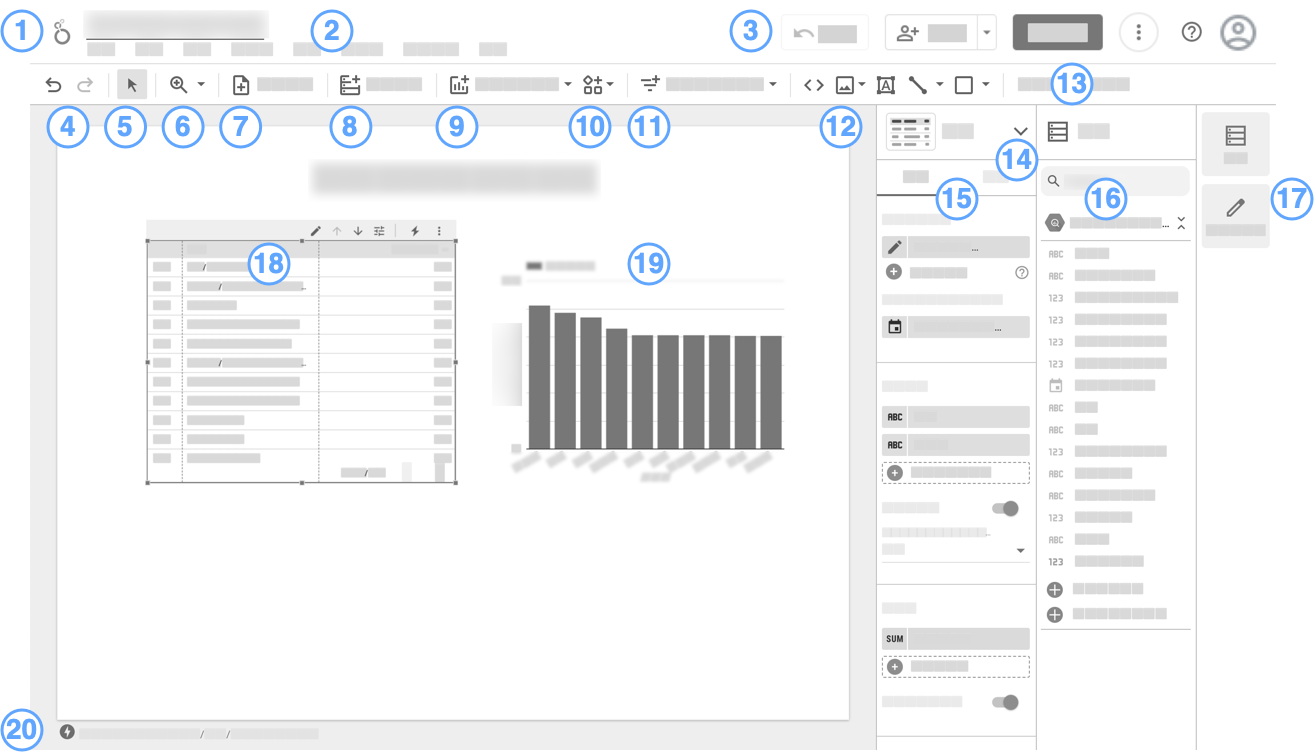
- Logo dan nama laporan. Klik logo untuk kembali ke halaman beranda Looker Studio.
- Panel menu. Banyak fungsi menu juga dapat diakses dengan mengklik kanan komponen.
- (Dari kiri ke kanan)
- Reset
 . Memulihkan laporan ke setelan default-nya.
  Bagikan
 Lihat. Beralih antara mode edit dan tampilan.
- Opsi lainnya
- Bantuan.
- Mengelola Akun Google Anda.
- Reset
- Urungkan | Ulangi

 .
.  Mode pilihan.
 Zoom.
Zoom. Tambahkan halaman.
 Tambahkan data.
 Menambahkan diagram.
 Tambahkan visualisasi komunitas.
 Tambahkan kontrol pelihat interaktif.
 Menambahkan teks, gambar, garis, dan bentuk.
- Buka panel Tema dan Tata letak.
- Pemilih visualisasi. Memungkinkan Anda mengubah jenis visualisasi diagram yang dipilih.
- Panel properti. Memungkinkan Anda menyiapkan dan menata gaya komponen yang dipilih.
- Panel data. Mengakses semua sumber data yang digunakan dalam laporan.
- Pengelola panel. Menyembunyikan atau menampilkan panel Properti dan Data.
- Visualisasi tabel, dipilih.
- Diagram batang, tidak dipilih.
- Indikator BigQuery BI Engine.
Memahami seluk-beluk editor sumber data
Untuk mengedit sumber data yang digunakan laporan Anda, ikuti langkah-langkah berikut:
- Edit laporan.
- Di menu, pilih Aset > Kelola sumber data yang ditambahkan.
- Cari sumber data dalam daftar, lalu klik Edit
 .
.
Legenda editor sumber data:
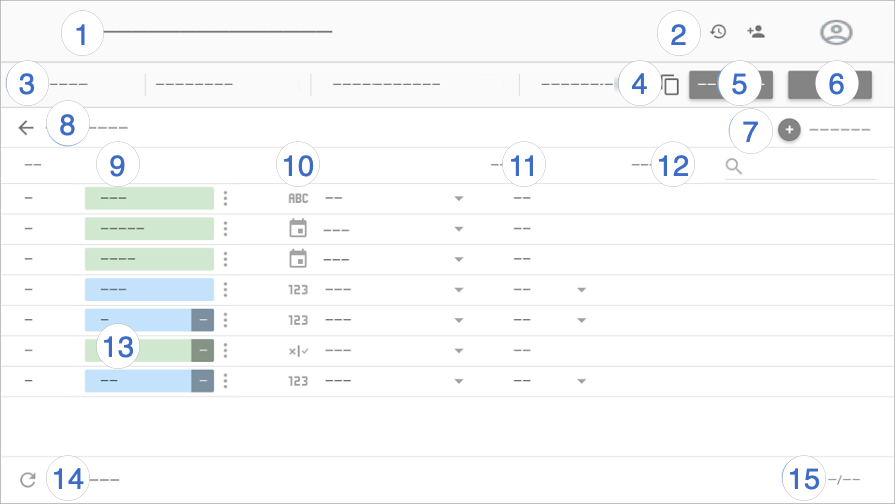
- Nama sumber data. Klik untuk mengubah nama.
- Histori versi. Melihat dan
 memulihkan versi sumber data sebelumnya.
Di sebelah histori versi terdapat tombol Bagikan, yang memungkinkan Anda membagikan sumber data ini kepada orang lain.
memulihkan versi sumber data sebelumnya.
Di sebelah histori versi terdapat tombol Bagikan, yang memungkinkan Anda membagikan sumber data ini kepada orang lain. - Opsi sumber data:
- Kredensial data. Menentukan siapa yang dapat melihat data yang disediakan oleh sumber data ini.
- Keaktualan data. Menyeimbangkan pembaruan data dengan performa laporan.
- Akses visualisasi komunitas. Memungkinkan sumber data ini menyediakan data ke visualisasi komunitas.
- Pengeditan kolom di laporan. Memungkinkan editor laporan mengubah nama kolom dan agregasi, menerapkan fungsi analisis, dan menetapkan opsi tampilan kolom tanpa perlu mengedit sumber data.
- Buat salinan sumber data ini.
- Buat laporan. Buat laporan baru dari sumber data ini.
- Jelajahi. Buat eksplorasi baru dari sumber data ini.
- Tambahkan kolom. Buat kolom kalkulasi, tambahkan kelompok kustom, atau tambahkan grup khusus.
Edit koneksi. Pemilik sumber data dapat menghubungkan kembali sumber data.
Filter menurut alamat email. Menambahkan keamanan tingkat baris ke data Anda.
Kolom. Dimensi muncul dalam chip hijau, metrik dalam chip biru, dan parameter dalam chip ungu. Klik kolom untuk memberinya nama baru. Untuk melakukan tindakan kolom lainnya, klik
Lainnya.Jenis kolom. Menentukan jenis data yang terdapat di kolom. Klik menu drop-down untuk mengubah jenis.
Agregasi. Menentukan bagaimana kolom diringkas. Klik menu drop-down untuk mengubah agregasi. Kolom dengan agregasi OTOMATIS tidak dapat diubah.
Deskripsi. Menambahkan deskripsi ke kolom. Untuk koneksi antara Looker dan Search Ads 360, deskripsi akan otomatis diisi dari sumber data.
Jika opsi gaya Tampilkan deskripsi kolom diaktifkan untuk diagram tabel, pengguna dapat melihat deskripsi kolom dalam tooltip. Tampilkan deskripsi kolom secara otomatis diaktifkan untuk diagram yang terhubung ke sumber data Looker atau Search Ads 360.
Kolom kalkulasi, kelompok kustom, dan grup kustom. Klik fx untuk mengedit formula kolom.
Muat ulang kolom. Klik untuk memperbarui sumber data dengan perubahan struktur apa pun yang dilakukan pada set data pokok.
Jumlah kolom. Menampilkan jumlah kolom di sumber data.