Conversational Analytics is a chat with your data feature powered by Gemini for Google Cloud. Conversational Analytics empowers users with no expertise in business intelligence to ask data-related questions in regular, natural (conversational) language, and go beyond static dashboards. Conversational Analytics is available in Looker Studio as part of a Looker Studio Pro subscription.
Learn how and when Gemini for Google Cloud uses your data.
Supported data sources
Conversational Analytics can connect to the following data sources:
Before you begin
To use Conversational Analytics in Looker Studio, you must meet the following requirements.
- You must be a user under a Looker Studio Pro subscription. Looker Studio Pro licenses are available at no cost to Looker users.
- An administrator must have enabled Gemini in Looker for Looker Studio.
- The Trusted Tester features must be enabled to use Conversational Analytics during the preview period.
For known limitations and a list of key features, see the Conversational Analytics landing page.
Navigate to Conversational Analytics
You can access Conversational Analytics from Looker Studio in the following ways:
- Navigate directly to Conversational Analytics.
- Choose
 Conversational Analytics from the navigation panel of Looker Studio.
 - Choose Conversation from the Create menu of Looker Studio if you are in your Sandbox workspace.
Start a conversation
Sets of questions that you ask about a dataset are organized by conversation. Splitting work into multiple conversations can be useful for organizing lines of inquiry. To create a new conversation, follow these steps:
- Click + Create conversation within Conversational Analytics.
Select the data source that you want to investigate or the data agent that you want to use for your conversation:
Data source: To start a conversation based on an existing data source, select the Data source panel, and then select a data source. To create a new data source, select Connect to data.
Data agent: To start a conversation with an existing data agent, select Agents, and then select a data agent. To create a new data agent, select + Create agent.
To start the conversation, enter your question and press return (Mac) or Enter (PC).
You can return to the conversation from the Recent section.
Ask questions
You can ask questions to get insights from your data. You can use suggested questions as a starting point for exploring data and building familiarity with Conversational Analytics.
Ask questions about a data source
Once you have created a conversation, you can ask questions about the data in the Ask a question field within the conversation.
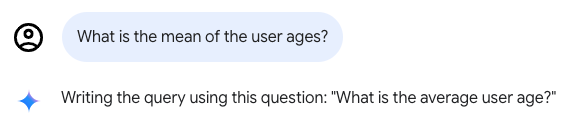
The questions don't need to be in a specific format or use a specific syntax. However, they do need to relate to the data source that you've selected. Conversational Analytics may rephrase your question after you've written a query, and the rephrased question will be displayed in the conversation window following your original question. For example, Conversational Analytics might rephrase the question "What is the mean of user ages?" to "What is the average user age?"
Conversational Analytics will take previous questions and answers into account as you continue the conversation. You can take previous answers and build on them by further refining results or changing the visualization type.
For more guidance on creating questions, see Limitations on questions.
Manage queries within a conversation
When you converse with data, you can manage the conversation by stopping an active query response while it is running or by deleting the most recent question and its response.
Stop a query response
To stop running a query after you've sent a message, click
Stop response. Conversational Analytics stops running the query and displays the following message: The query was cancelled.
Delete the most recent question
To delete the most recent question and its response, follow these steps:
- Hold your cursor over the most recent question, and then click Delete message.
- In the Permanently delete message? dialog, click Delete to permanently delete the question and its response.
Understand query results and calculations
When you ask questions about your data in Conversational Analytics, the response might include a visualization, a data table, or other details, depending on your specific query and the connected data.
In addition to this query response, Conversational Analytics provides the following options for understanding query results and calculations:
- Details about how the answer was calculated
- If available, the option to view additional insights about the response
Determine how an answer was calculated
To see how Conversational Analytics arrived at an answer or created a visualization, click How was this calculated? within the query results.
When you click How was this calculated?, Conversational Analytics displays the following tabs:
Code: Displays the SQL query that was run to generate the result. If you connect Conversational Analytics to a BigQuery table, the Code tab shows the generated BigQuery SQL.
Text: Provides a plain text explanation of the steps that Conversational Analytics took to arrive at the given answer. This explanation includes the raw field names that were used, the calculations that were done, the filters that were applied, the sort order, and other details.
Get additional insights
When Conversational Analytics is able to provide additional data insights about a response, an Insights keyboard_arrow_down button will appear. Click Insights keyboard_arrow_down to see additional information about your query. Insights only analyzes the data that was returned by your prompt and won't run additional queries to fetch additional data. Insights can be a useful source for ideas for follow-up questions to continue the conversation.
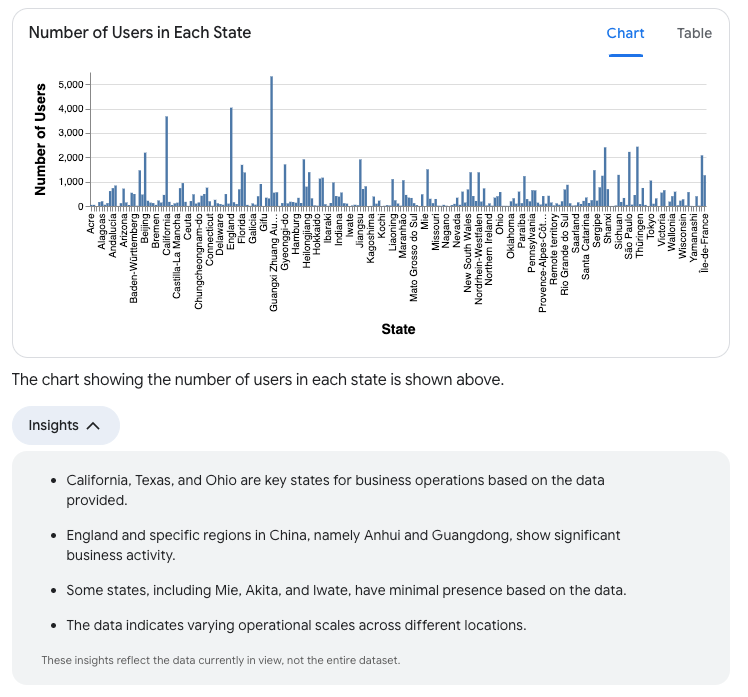
The following is an example of some insights that might be returned by the prompt "How many users are in each state?":
- A general summary of high and low data volume areas. For example:
- "California, Texas, and Ohio are key states for business operations based on the data provided."
- "England and specific regions in China, namely Anhui and Guangdong, show significant business activity."
- "Some states, including Mie, Akita, and Iwate, have minimal presence based on the data."
- An assessment of the variability of the dataset. For example, "The data indicates varying operational scales across different locations."
Manage conversations
You can change the name of conversations, delete conversations, or restore them from the trash folder.
Name a conversation
Conversational Analytics automatically generates a conversation title that is based on your first question and response. To change the generated name, follow these steps:
- Click the title at the top of the conversation page.
- Enter a new conversation name.
- To save your changes, click elsewhere on the page, or press return (Mac) or Enter (PC).
Delete a conversation
To move a conversation to the trash, open the conversation and click Move to trash.
Restore or permanently delete a conversation
To restore or permanently delete a conversation from the trash, follow these steps:
- Within Conversational Analytics, select Trash in the left navigation panel to view the list of conversations that have been moved to the trash.
- In the Trash section, click the name of the conversation that you want to restore or permanently delete.
- In the Are you sure? dialog, select one of the following options:
- Cancel: Cancels the action.
- Restore: Restores the conversation. The conversation can be accessed from the Recent section of the left navigation menu within Conversational Analytics.
- Delete forever: Permanently deletes the conversation.
Search conversations
To search for a specific conversation by title, follow these steps:
- In the Search Conversational Analytics search bar, enter your search query. As you type, a list of conversations with titles that match your search query will appear.
- Select a conversation from the search results to open that conversation.
Connect to data
You can connect to new data sources to use with Conversational Analytics.
Best practices for setting up a data source
Setting up a data source in the ideal manner can help Conversational Analytics provide the most helpful answers. Consider following these best practices when creating a data source:
- You can exclude fields that shouldn't be used for analysis entirely, or hide them in the data source.
- Field descriptions can be added or edited to give context to Conversational Analytics.
- If you are seeing unexpected results, check your data source and confirm that the field types and default aggregation settings are correct.
Connect to Looker data
You start a conversation directly with a Looker Explore or with a data agent that is built with a Looker Explore.
Before you begin
To use a Looker Explore with Conversational Analytics, the Looker connector must be enabled for the Looker instance that you are connecting to within Conversational Analytics. To enable the Looker connector, your Looker instance must meet the prerequisites that are described in Connecting to Looker Studio.
Use a Looker Explore as a data source
Looker Explores appear in the list of available data sources on the Chat with your data page. To use a new Looker Explore as a data source in Conversational Analytics, follow these steps:
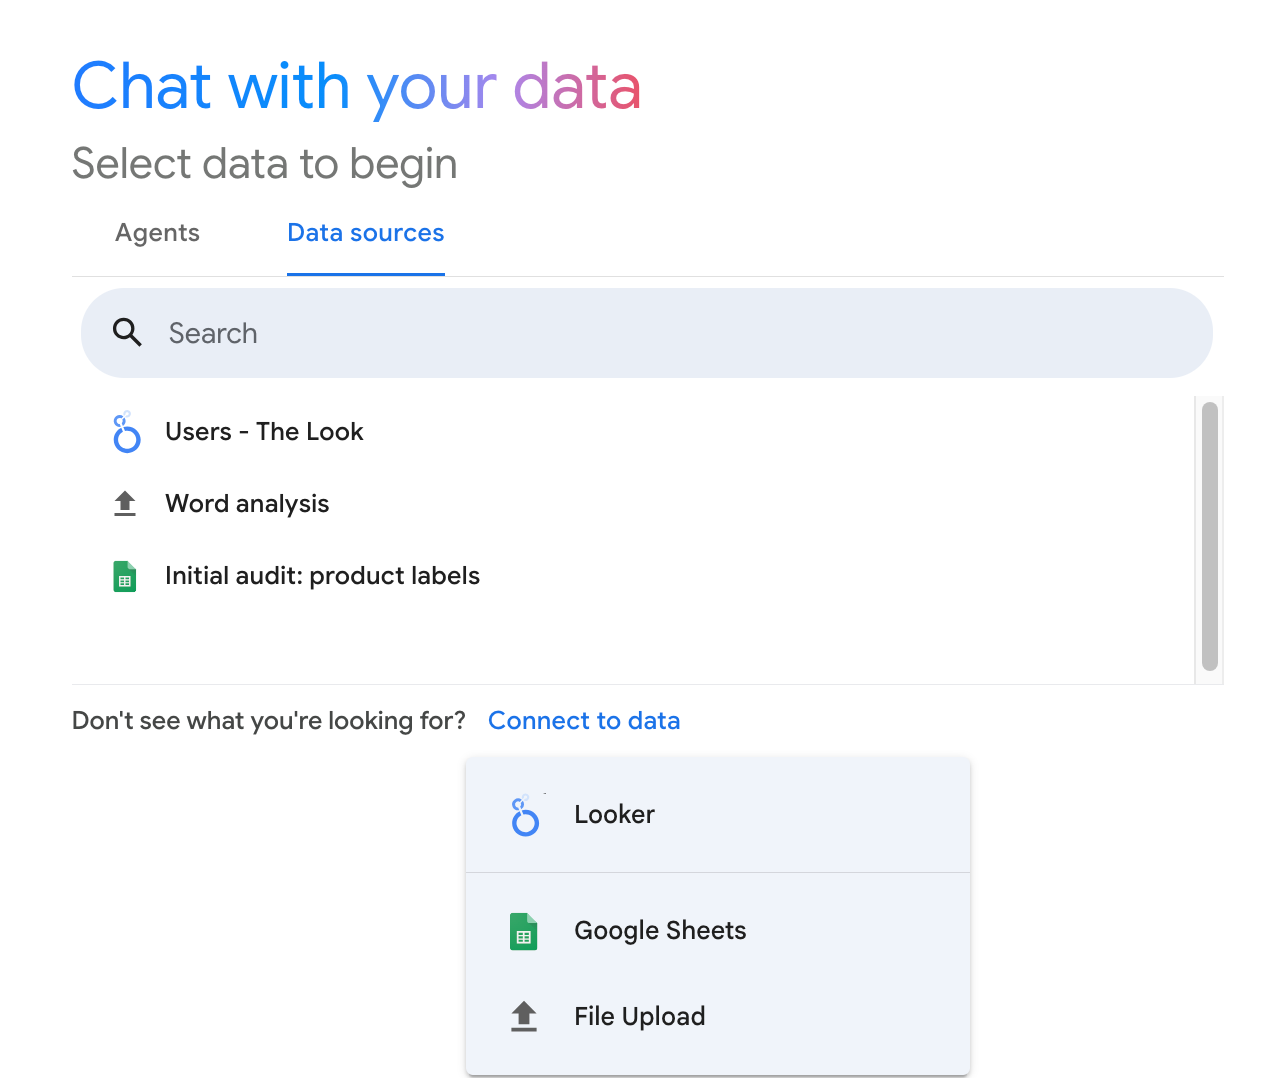
- In Conversational Analytics, on the Chat with your data page, select the Data sources tab.
- Select Connect to data, and then select Looker from the drop-down menu.
In the Connect to a Looker Instance section, in the Enter Looker Instance URL field, enter the URL for your Looker instance. If the instance URL is invalid or doesn't meet the Looker connector requirements, Conversational Analytics displays an error message.
If you're connecting to a Looker instance for the first time, click Connect Looker Account.
If Conversational Analytics displays the Link your Google Account and Looker window, review the information about how Looker Studio will access your Looker account. To link your accounts and proceed, select Agree and continue.
Once you have linked to a Looker instance, select an Explore from the list, and then click Connect to start a conversation.
Converse with a Looker data source
Once you've connected to a Looker Explore, you can ask questions about your Looker data.
When you converse with your data, the collapsible Data panel shows the name of the Looker Explore that is being used by the conversation. The Data panel also provides the following options:
- View fields: View the Explore in Looker in a new browser window by clicking View fields.
- New conversation: Start a new conversation with the Looker Explore that the current conversation is using.
Open in a Looker Explore
To open the query results as an Explore within the connected Looker instance, click Open in Explore within the query results.
Connect to BigQuery data
You can start a conversation directly with a BigQuery table or with a data agent that is built with a BigQuery table.
Before you begin
You must have the following BigQuery Identity and Access Management (IAM) roles and permissions:
- The
bigquery.jobs.createIAM permission on the billing project - The
roles/bigquery.dataViewerIAM role on the project, dataset, or table that is being queried
Use a BigQuery table as a data source
BigQuery data sources appear in the list of available data sources on the Chat with your data page. To use a BigQuery table as a data source with Conversational Analytics, follow these steps:
- In Conversational Analytics, on the Chat with your data page, select the Data sources tab.
- Select Connect to data, and then select BigQuery from the drop-down menu.
In the Select data window, select one of the following tabs to connect to a BigQuery dataset or to browse public datasets.
- Recent Projects: Lists the BigQuery projects that you accessed most recently.
- All Projects: Lists all the BigQuery projects that you have access to.
- Public Datasets: Lists BigQuery public datasets.
- Enter Project ID: Lets you specify the unique project ID for a specific project.
Select a BigQuery project in the Recent Projects or All Projects tab, or enter a project ID in the Enter Project ID tab. Optionally, use the Search Projects search bar to filter the list. (If you're connecting to a public dataset, proceed to the next step.)
The Select data window displays the Datasets tab, or it displays Public Datasets if you're connecting to a public dataset. Select a BigQuery dataset. Optionally, use the Search Datasets search bar to filter the list.
The Select data window displays the Table tab. Select the table that you want to connect to in the Table tab. Optionally, use the Search Tables search bar to filter the list.
Click Connect.
Converse with BigQuery data
Once you've connected to a BigQuery data source, you can ask questions about your BigQuery data.
When you converse with your data, the collapsible Data panel shows the name of the BigQuery table that the conversation is using. The Data panel also provides the following options:
- View fields: View the table in BigQuery in a new browser tab.
- New conversation: Start a new conversation with the BigQuery data that the current conversation is using.
Known limitations for BigQuery data
In addition to the known limitations in Conversational Analytics, Conversational Analytics has the following limitations for working with BigQuery data:
- You can converse with only one BigQuery table at a time. To converse with a different BigQuery table or with a data agent that uses a different BigQuery table, start a new conversation.
- Conversational Analytics doesn't support BigQuery's Flexible Column Names feature.
Additional resources
Conversational Analytics: Query your data in natural language: The landing page for Conversational Analytics contains setup requirements, known limitations, supported question types, and more.
Create and converse with data agents: With data agents, you can customize the AI-powered data querying agent by providing context and instructions that are specific to your data, which helps Conversational Analytics generate more accurate and contextually relevant responses.
Enable advanced analytics with the Code Interpreter: The Code Interpreter within Conversational Analytics translates your natural language questions into Python code and executes that code. Compared to standard SQL-based queries, the Code Interpreter's use of Python enables more complex analysis and visualizations.