Controlling the timeframe of your reports helps you spot trends and focus viewers on specific periods of interest. As an editor, you can configure a report's default timeframe by setting date range properties in the report. You can allow report viewers to override these date range properties by adding a date range control to the report.
To set up a date range in your reports, complete the following steps:
- Select a date range dimension to provide the base date or date and time data.
- Set a default date range filter to set the parameters of the date range.
- Set a comparison date range for component-level date ranges (optional).
You can set date range properties for an individual component, a group of components, a page, or the entire report.
Select a date range dimension
A date range dimension is a field in your data source that contains valid date data. The data in this dimension determines the records that will be selected by the default date range filter. In most cases, Looker Studio automatically selects a date range dimension if one is available in the data source. However, if you have multiple date dimensions in the data source, you might want to change Looker Studio's selection. For example, if your data source has order_date and ship_date dimensions, you might want to change the default select from order_date to ship_date.
To select a date range dimension for a component, follow these steps:
- Edit your report.
- Select a chart or control.
- In the Properties panel, select the SETUP tab.
- In the Data Source section, click Date range dimension, and then use the dimension picker to select a valid date dimension. You can also use a valid date and time dimension, however, the time units are ignored by the date range filter.
Select a report-level date range dimension
To set the date range for the entire report, follow these steps:
- Edit your report.
- Select the File > Report settings menu.
- In the Properties panel, select the SETUP tab.
- In the Data Source section, click Date range dimension, and then use the dimension picker to select a valid date or a valid date and time dimension.
Select a page-level date range dimension
To set the date range dimension for the current page, follow these steps:
- Edit your report.
- Select the Page > Current page settings menu.
- In the Properties panel, select the SETUP tab.
- In the Data Source section, click Date range dimension, and then use the dimension picker to select a valid date or a valid date and time dimension.
Set a default date range filter
A default date range filter determines the default timeframe for a component. To set or change a default date range filter, follow these steps:
- Edit your report.
- Select a chart or control.
- In the Properties panel, select the SETUP tab.
- In the Default date range filter section, choose Auto or Custom.
Set a report-level date range filter
To set a date range filter for the entire report, follow these steps:
- Edit your report.
- Select the File > Report settings menu.
- In the Properties panel, select the SETUP tab.
- In the Default date range filter section, choose Auto or Custom.
Set a page-level date range filter
To set a date range filter for the current page, follow these steps:
- Edit your report.
- Select the Page > Current page settings menu.
- In the Properties panel, select the SETUP tab.
- In the Default date range filter section, choose Auto or Custom.
Auto date range
Choose Auto to accept the default date range setting from the data source connector. The default date range setting varies by connector type. Some connectors, for example, Google Sheets and BigQuery, provide the entire range of dates contained in the underlying dataset. Other connector types limit the default date range. For example, the Ads, Analytics, and YouTube connectors provide the last 28 days by default.
Custom date range
To set up a custom date range filter, click Custom, then click the drop-down menu to open the calendar . The calendar lets you configure two types of custom date ranges: fixed date ranges and rolling date ranges.
Fixed date ranges
Fixed date ranges specify static beginning and ending dates, for example, January 1, 2025 to April 30, 2025. Charts that use a fixed range always show data for the exact dates that you select.
Rolling date ranges
Rolling date ranges are relative to today's date. Rolling date ranges are like a window whose beginning and end dates change as time passes. To specify a rolling date range, select from one of the available preset ranges, such as Today, Yesterday, or Last week (starts Monday).
Click This month > or Last 7 days > to display additional preset options.
Looker Studio defaults to starting the weekly rolling window on Sunday. You can change this to start on Monday by selecting This week (starts Monday) or Last week (starts Monday) in the date options list.
Select the Include today checkbox to include any data that has been collected so far for the current day (if applicable).
Advanced date ranges
To create more complex date filters, use an advanced date range.
Advanced date ranges let you configure custom date periods for both the current date range and the comparison date range. For example, you can create date ranges such as "last 90 days from yesterday" or "last 52 weeks from last week"; or you can compare the "current 30 days to the last 30 days, aligned by day of the week".
To configure an advanced date range, follow these steps:
- Select the component.
- In the Properties panel, select the SETUP tab.
- In the Default date range section, click Custom. Then click the calendar icon .
(To set the default date range filter for a Date range control, select the control and then click the calendar icon .)
- Click Advanced.
- Set the Start date:
- To make the start date a rolling date, select Today.
- To make the start date a specific calendar date, select Fixed.
- To make the start date a date in the past, select Minus.
- To make the start date a date in the future, select Plus.
- Enter the number of date units.
- Specify what date units to use.
- Repeat steps 4-7 for the end date.
- Click APPLY.
Advanced date range examples
Example 1: Last 90 days from yesterday
| Start Date | End Date |
| Today | Today |
| Minus | Minus |
| 90 | 1 |
| Days | Days |
Example 2: Last 30 days from today
| Start Date | End Date |
| Today | Today |
| Minus | Minus |
| 29 | 0 |
| Days | Days |
Example 3: Next two quarters from this quarter
| Start Date | End Date |
| Today | Today |
| Minus | Plus |
| 0 | 2 |
| Quarters | Quarters |
Set a comparison date range
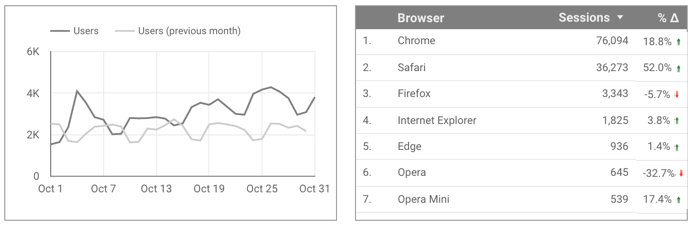
To see how your data looks compared to a previous period, you can set a comparison date range. This option is available in time series charts and tables. In a time series, the comparison data appears as a line of a different color from the current data. In a table, the comparison data is shown as the delta from the current data, with an increase or decrease indicator.
To set a comparison date range, follow these steps:
- Select a time series, a table, an area chart, or a scorecard.
- In the Properties panel, select the SETUP tab.
- Go to the Default Date Range section.
- Under Comparison date range, choose the comparison period.
- Click APPLY.
Note: While viewers and editors can use a Date range control to set the current period for a chart, only report editors can set the comparison date range.
Comparison period examples
Previous period / previous year examples
Assume today's date is January 1, 2019, and the selected period for the chart is Last 7 days:
| Comparison period | Current dates | Comparison dates |
| Previous period | December 25, 2018 to December 31, 2018 | December 18, 2018 to December 24, 2018 |
| Previous year | December 25, 2018 to December 31, 2018 | December 25, 2017 to December 31, 2017 |
| Fixed June 1st, 2018 to June 7, 2018 |
December 25, 2018 to December 31, 2018 | June 1, 2018 to June 7, 2018 |
Now, assume today's date is January 2, 2019:
| Comparison period | Current dates | Comparison dates |
| Previous period | December 26, 2018 to January 1, 2019 | December 19, 2018 to December 25, 2018 |
| Previous year | December 26, 2018 to January 1, 2019 | December 26, 2017 to January 1, 2018 |
| Fixed June 1st, 2018 to June 7, 2018 |
December 26, 2018 to January 1, 2019 | June 1, 2018 to June 7, 2018 |
Advanced date comparison examples
Compare the last 30 days from yesterday to the 30 days prior to that, aligned by day of the week (for example, compare Monday to Monday):
| Current date range | Comparison start date | Comparison end date |
Last 30 days (excluding today)
|
Today | Today |
| Minus | Minus | |
| 58 | 29 | |
| Days | Days |
Compare year to date to two years ago:
| Current date range | Comparison start date | Comparison end date |
| This year (excluding today) | Today | Today |
| Minus | Minus | |
| 2 | 730 | |
| Years | Days |