Halaman ini berlaku untuk Apigee dan Apigee Hybrid.
Lihat dokumentasi
Apigee Edge.

Alat Debug Offline memungkinkan Anda melihat dan menganalisis sesi debug "offline" yang sebelumnya didownload di tampilan Debug di Editor Proxy. Sesi debug tersimpan pada dasarnya adalah "rekaman" sesi debug, dan dapat berguna untuk kasus saat pemecahan masalah dan analisis lebih lanjut diperlukan. UI untuk alat Offline Debug mirip dengan tampilan Debug di Editor Proxy.
Untuk mempelajari UI Alat Debug dan cara mendownload sesi debug, lihat Menggunakan Debug.
Konsol Apigee Cloud
Debug v2 (baru)
Untuk melihat data debug yang didownload menggunakan Debug Offline:
-
Di konsol Google Cloud , buka halaman Proxy development > Offline Debug.
-
Tampilan Debug Offline akan ditampilkan:
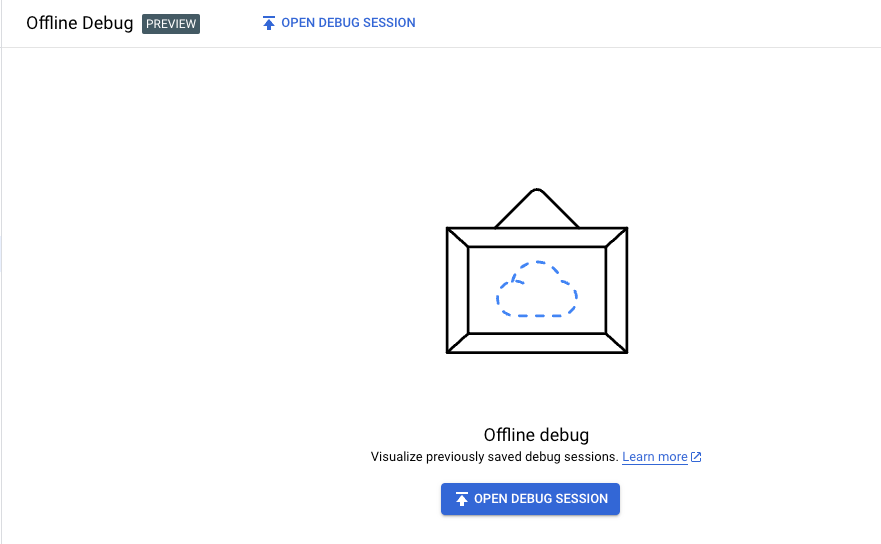
Untuk memuat data ke tampilan Offline Debug, klik Open Debug Session, pilih file sesi debug offline yang sebelumnya didownload dalam format JSON, lalu klik Open.
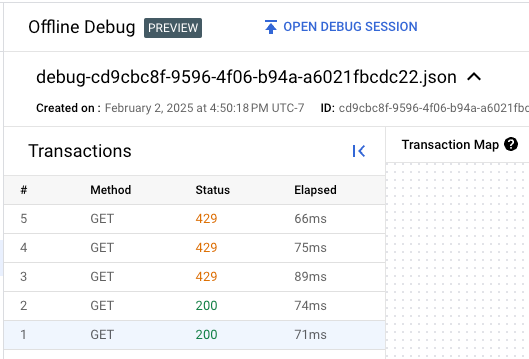
Catatan: Saat Anda mendownload sesi debug di tampilan Debug Proxy Editor, nama file yang didownload memiliki format
debug-{session ID}.json, dengan{session id}adalah ID sesi debug; namun, Anda dapat mengganti nama file jika ingin.UI Apigee memuat data file debug dan menampilkan semua transaksi dalam daftar di panel Transactions.
- Klik baris untuk transaksi di panel Transaksi
untuk menampilkan transaksi di Peta Transaksi.
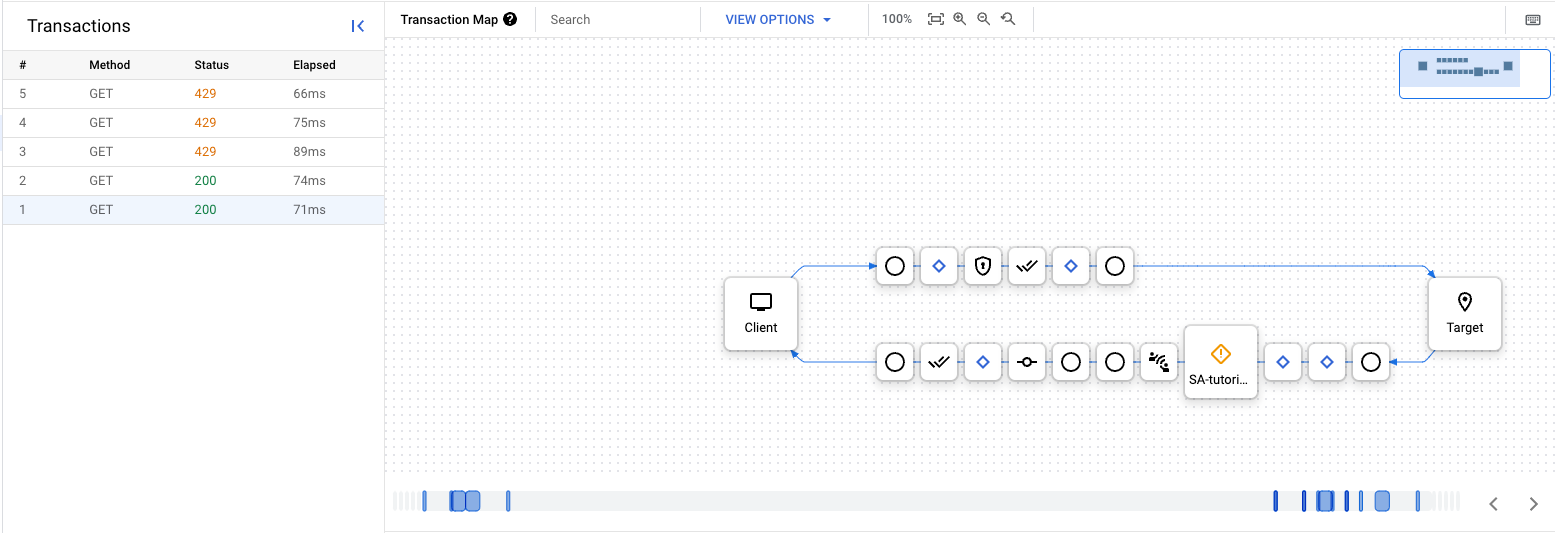
Dari sini, Anda dapat menjelajahi sesi debug seperti yang Anda lakukan untuk sesi debug yang baru dibuat. Lihat Membuat sesi debug untuk mengetahui informasi selengkapnya.
Debug v1
Untuk melihat data debug yang didownload menggunakan Debug Offline:
- Login ke Google Cloud console.
- Pilih API Proxies dari tampilan utama.
Pilih Develop > Offline Debug.
Tampilan Debug Offline akan ditampilkan:
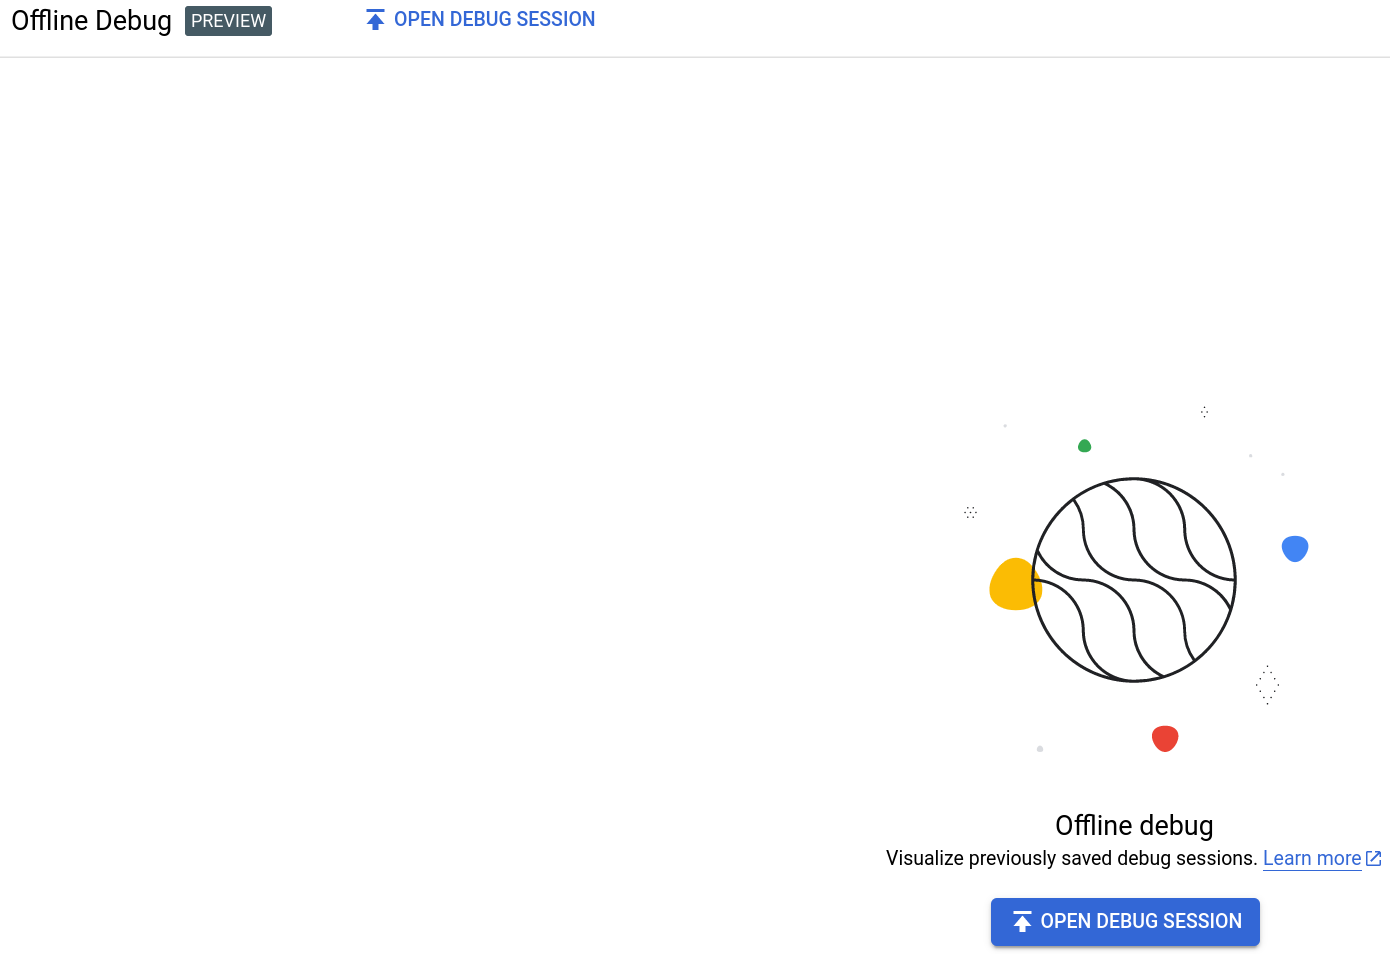
Untuk memuat data ke tampilan Offline Debug, klik tombol Open Debug Session dan pilih file sesi debug offline yang didownload sebelumnya dalam format JSON.
Catatan: Saat Anda mendownload sesi debug di tampilan Debug Editor Proxy, nama file yang didownload memiliki bentuk 'debug-{session ID}.json', dengan {session ID} adalah ID sesi debug. Namun, Anda dapat mengganti nama file jika mau.
UI Apigee memuat data file debug dan menampilkan baris baru untuk transaksi di panel sebelah kiri.
- Klik baris untuk transaksi di panel kiri guna menampilkan diagram Gantt transaksi tersebut dalam diagram Gantt.
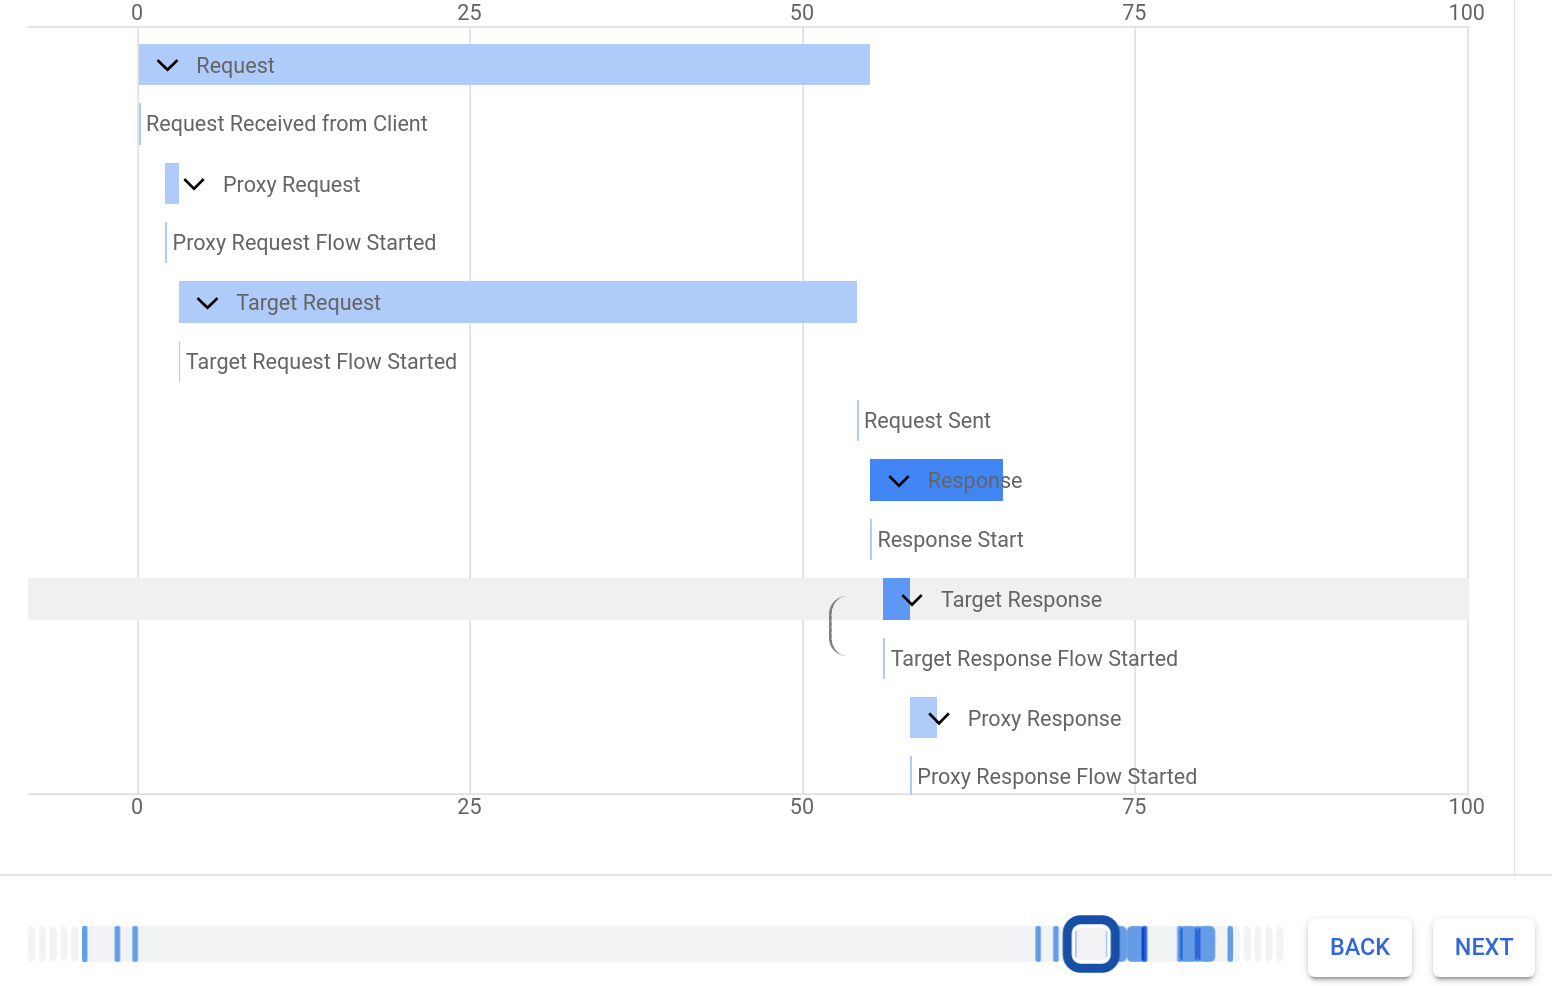
Dari sini, Anda dapat menjelajahi sesi debug seperti yang Anda lakukan di tampilan Debug di Editor Proxy baru. Lihat bagian "Melihat diagram Gantt untuk permintaan dan respons".
UI Klasik
Untuk melihat data debug yang didownload menggunakan Debug Offline:
- Login ke UI Apigee.
- Pilih API Proxies dari tampilan utama.
Pilih Develop > Offline Debug.
Tampilan Debug Offline akan ditampilkan:
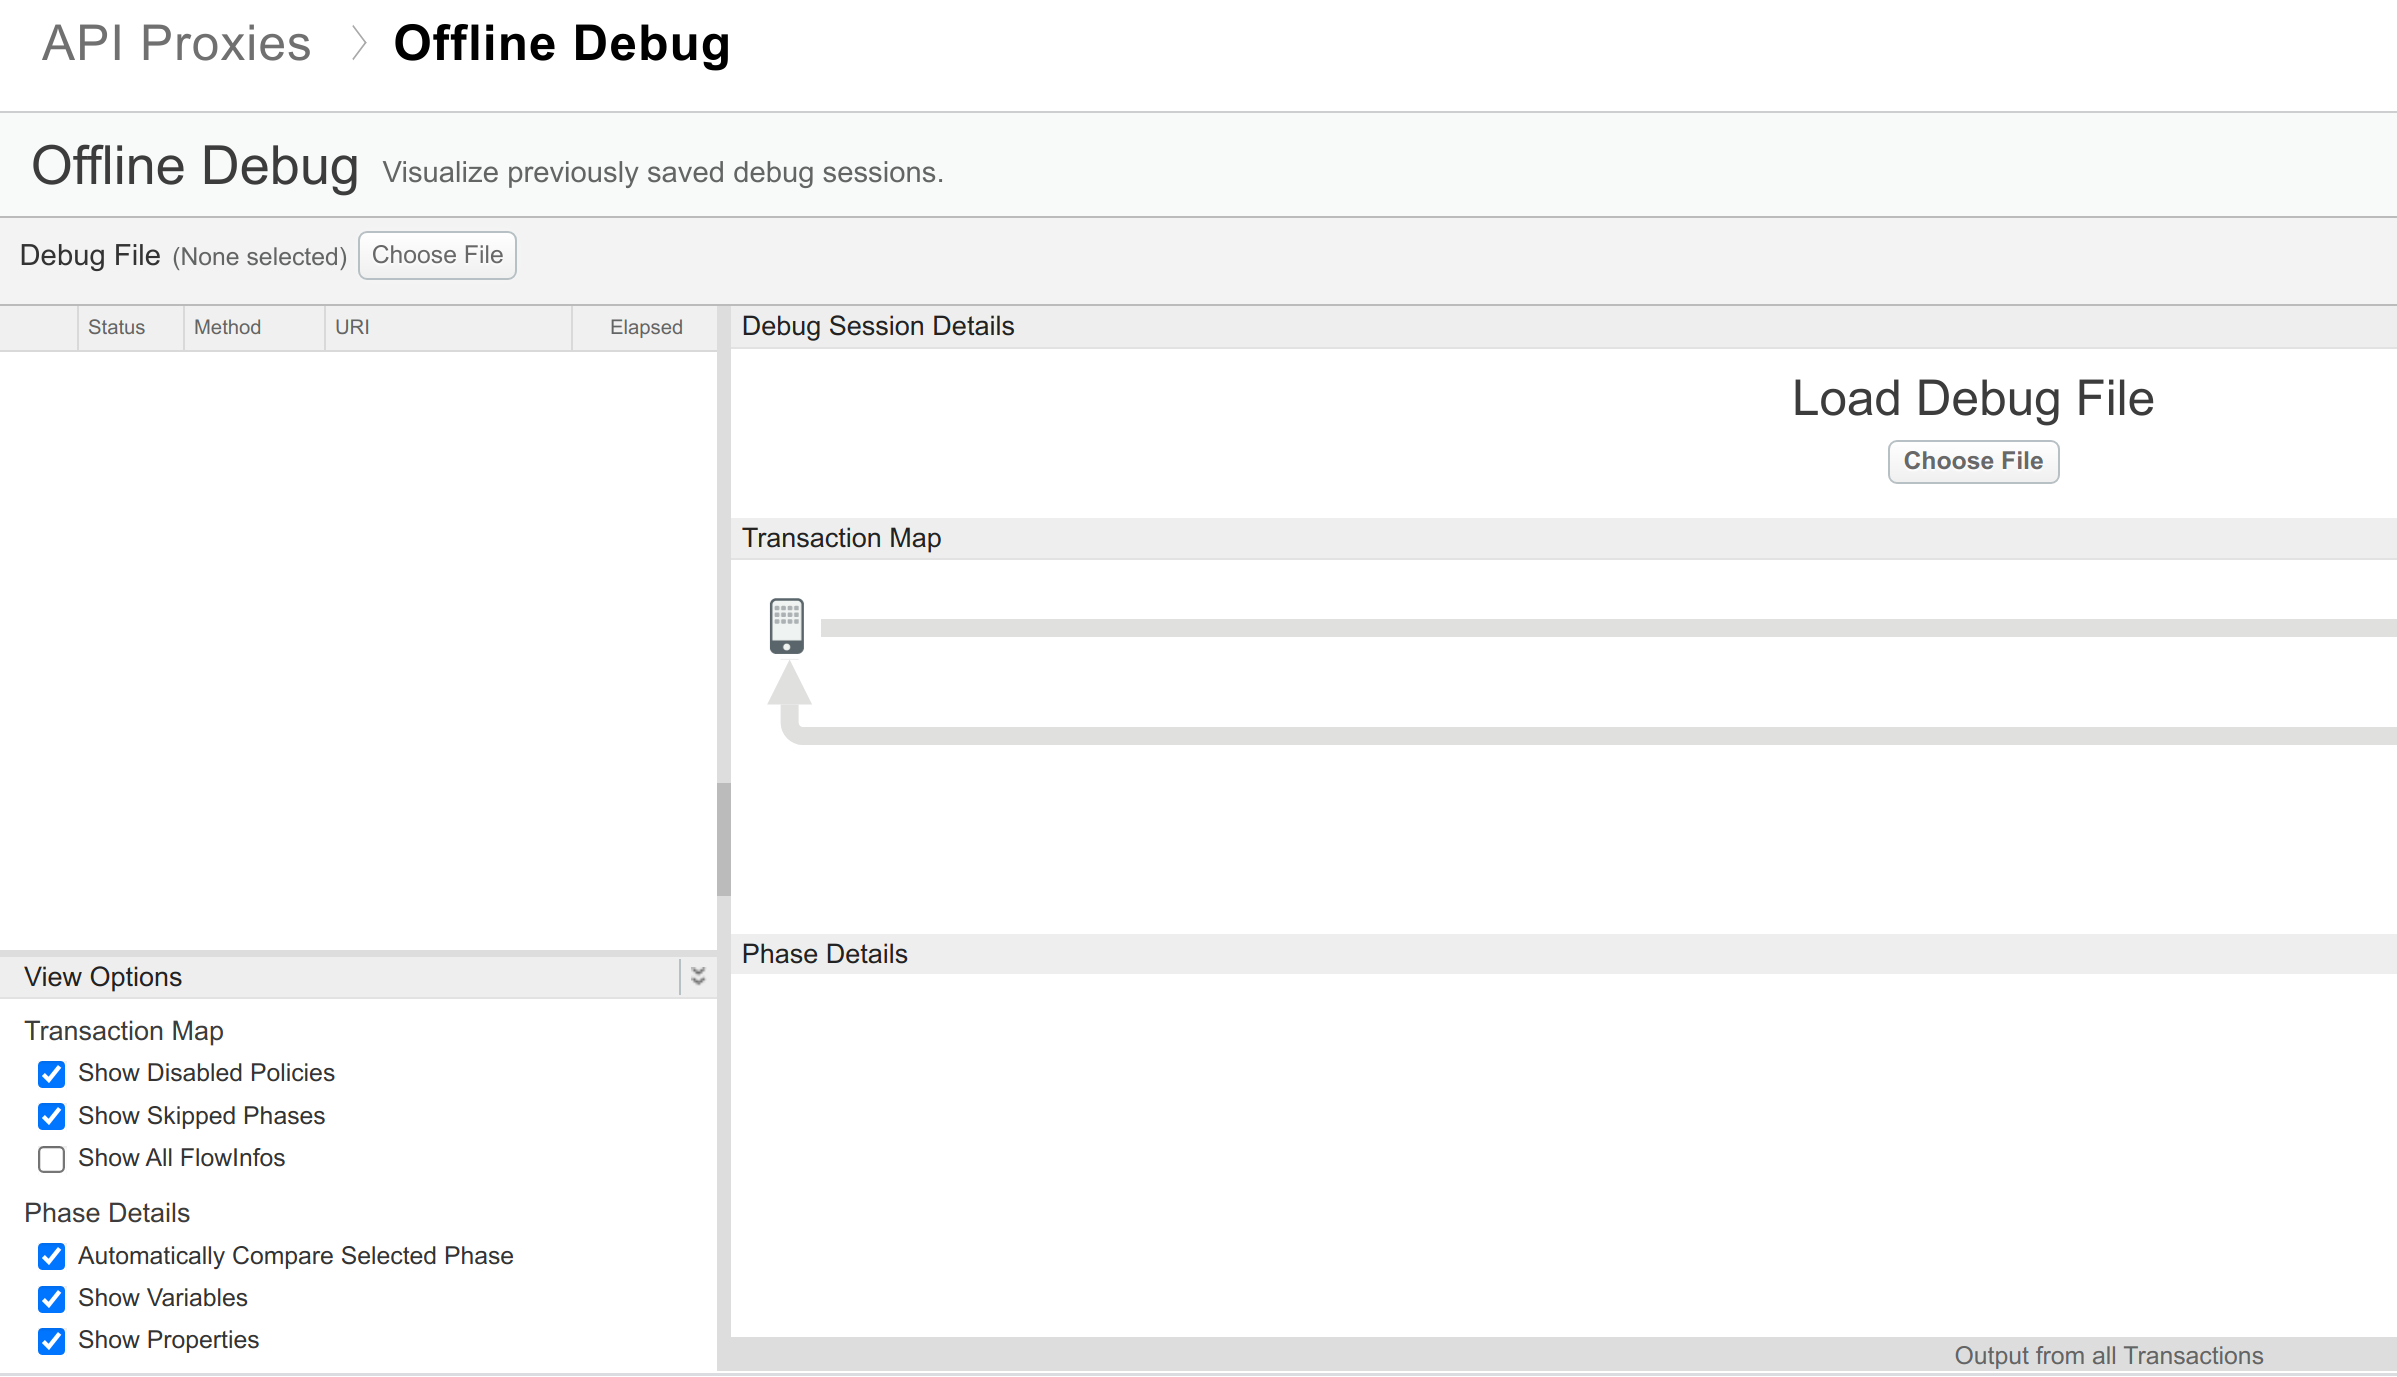
Perhatikan wilayah berikut di tampilan Offline Debug:
- File debug: Menampilkan jenis permintaan. Gunakan area ini untuk berpindah di antara permintaan.
- Opsi Tampilan: Menampilkan opsi konfigurasi, seperti yang dijelaskan dalam Menggunakan Debug.
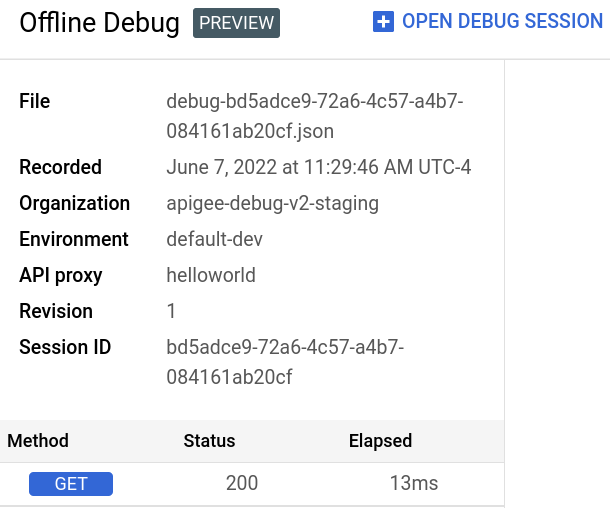
- Detail Sesi Debug: Menampilkan detail tentang sesi debug.
- Peta Transaksi: Menampilkan jalur permintaan melalui proxy API; jalur ini dikenal sebagai peta transaksi; peta ini menampilkan kebijakan yang ditemui dan menunjukkan apakah ada error yang terjadi selama eksekusi kebijakan tersebut.
- Detail Fase: Menampilkan header permintaan untuk permintaan yang saat ini dipilih.
Saat melihat data debug di UI Apigee, Anda dapat mengaktifkan atau menonaktifkan berbagai opsi seperti apakah akan melihat kebijakan yang dinonaktifkan atau variabel dan properti. Untuk mengetahui informasi selengkapnya, lihat Men-debug dengan alat debug.
Untuk memuat data ke tampilan Offline Debug, klik tombol Choose File di panel kiri alat Offline Debug dan pilih file sesi rekaman aktivitas offline yang sebelumnya didownload dalam format JSON.
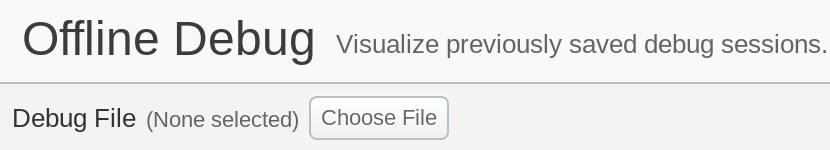
Catatan: Jangan gunakan tombol Pilih File di panel sebelah kanan, karena tidak menerima file JSON.
UI Apigee memuat data file debug dan menampilkannya.