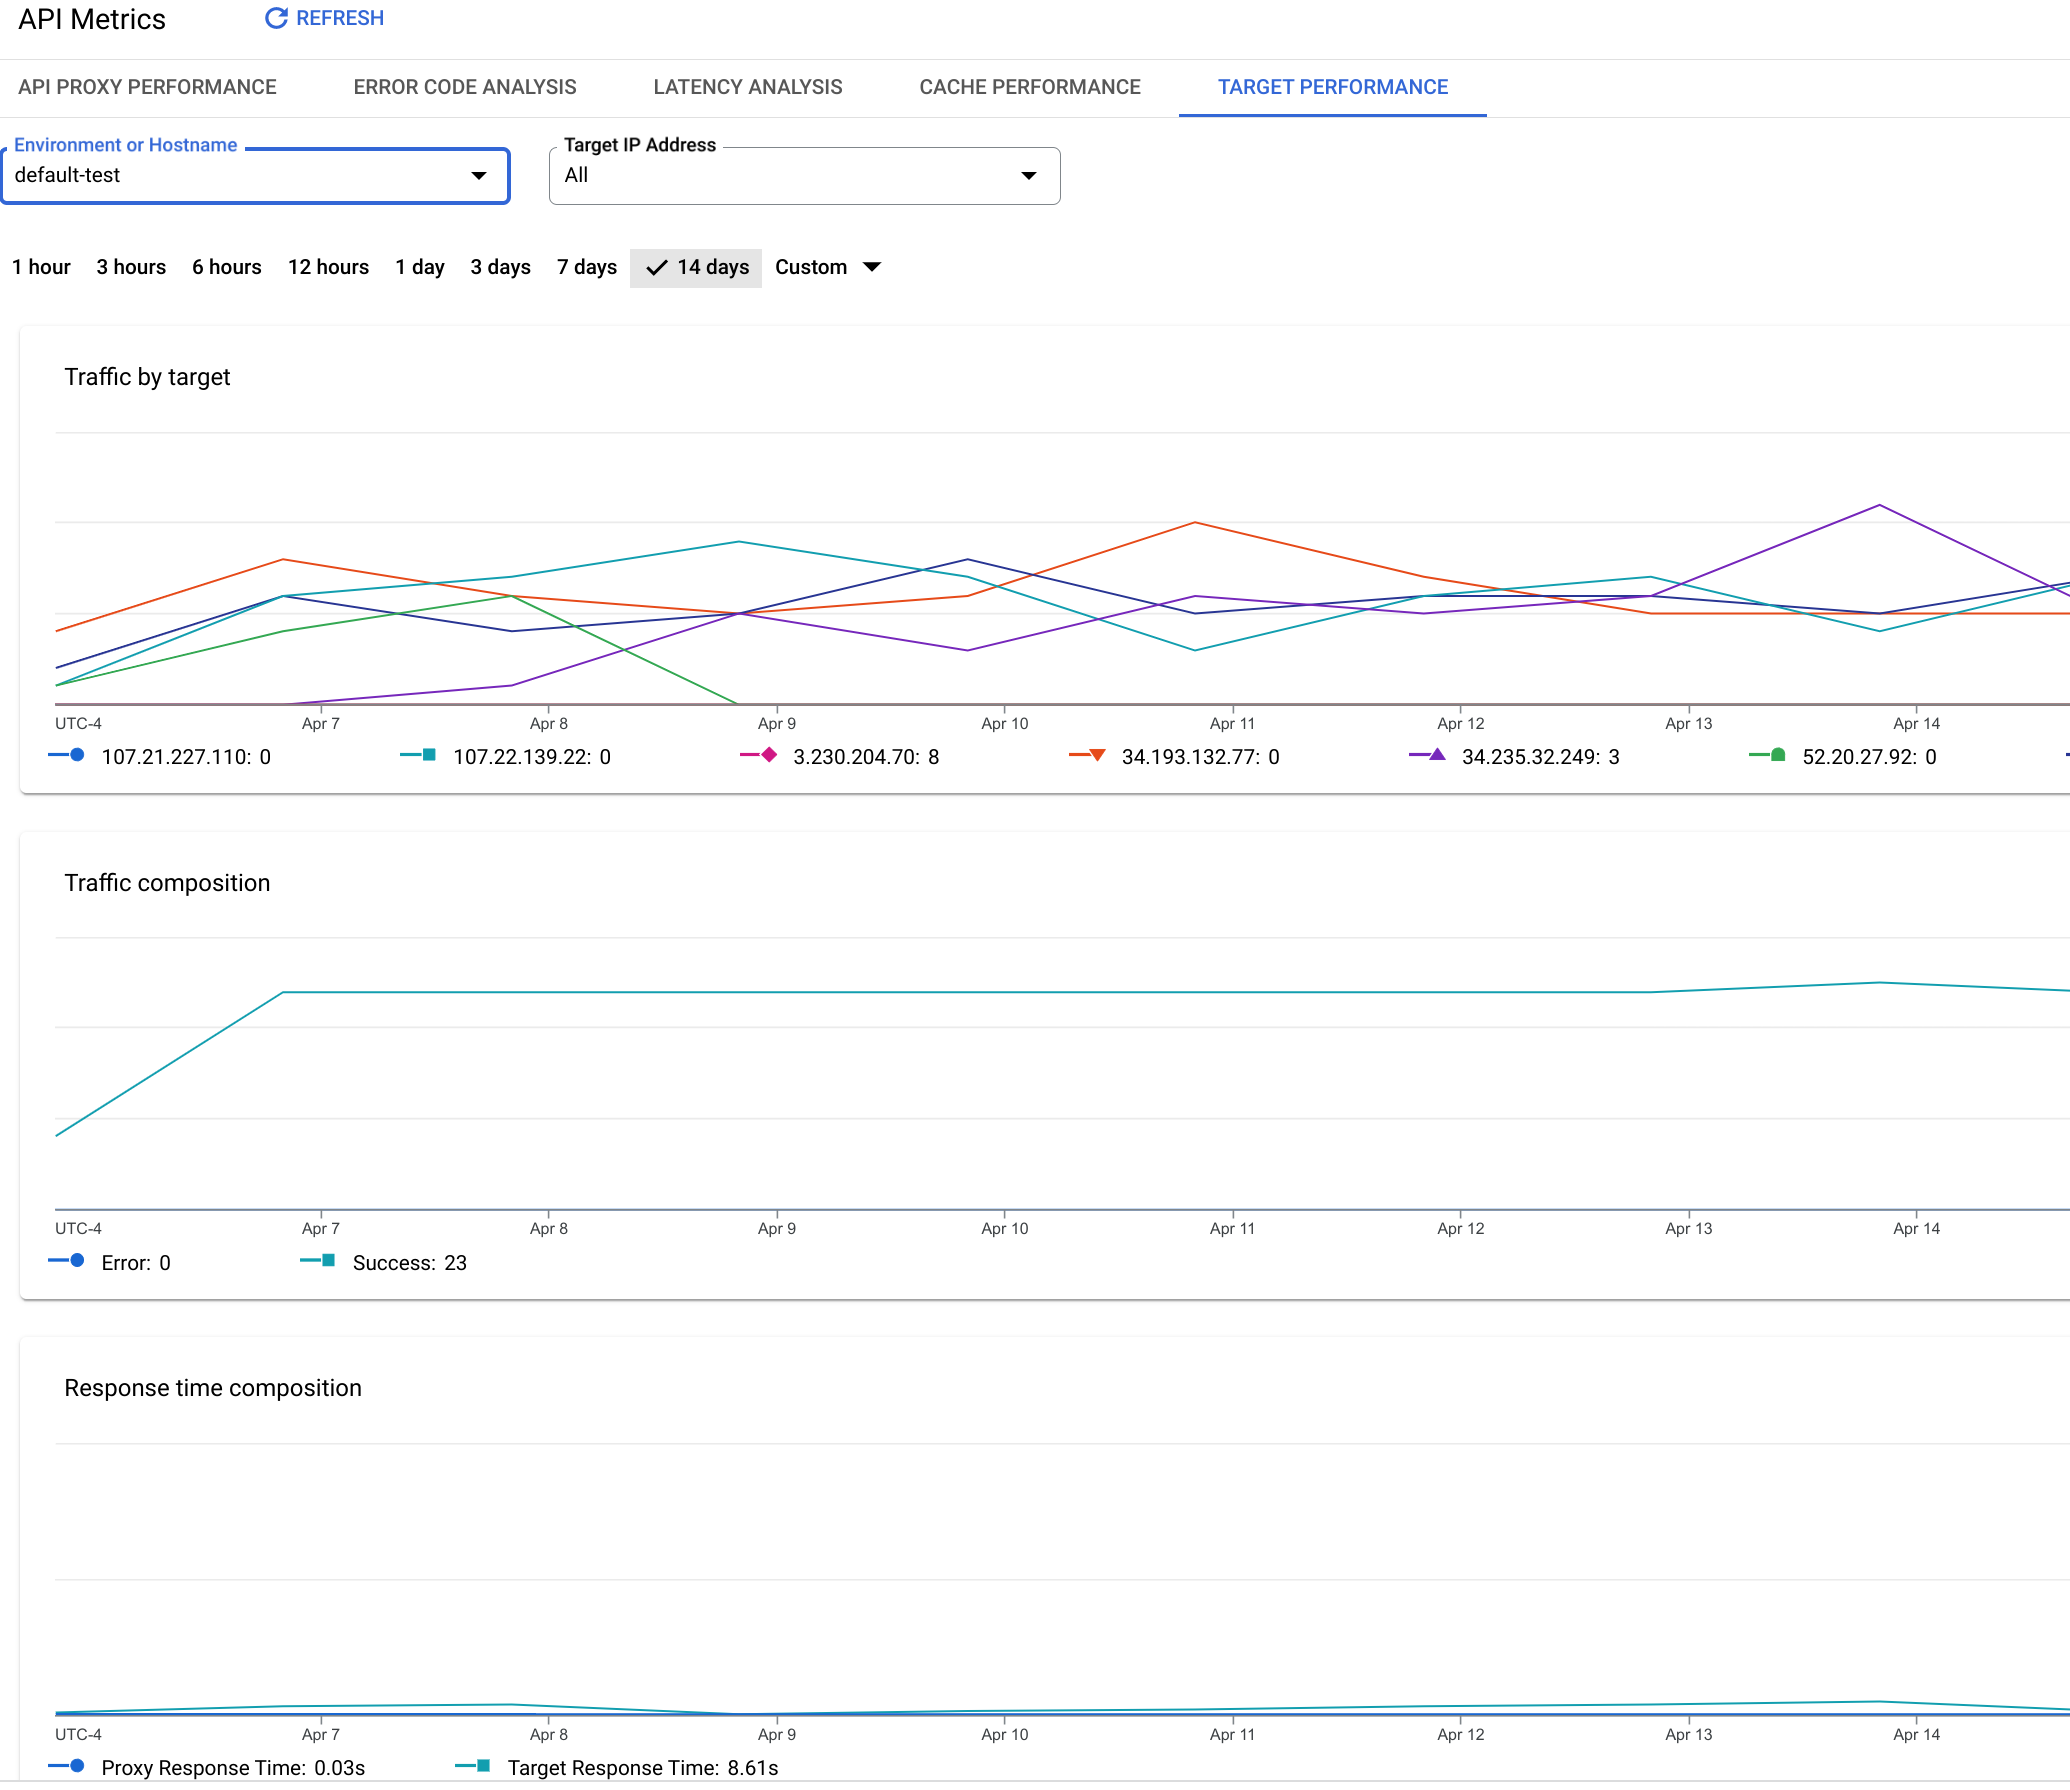
Rata-rata Total Waktu Respons yang diukur untuk semua panggilan API yang dilakukan ke lingkungan organisasi Apigee. Total Waktu Respons adalah jumlah waktu yang diperlukan
panggilan API ke Apigee untuk ditampilkan (dalam milidetik).
Atau, dengan kata lain, total waktu respons adalah waktu yang diukur dari saat seluruh panggilan API diterima di Apigee hingga saat Apigee mulai mengirimkan respons kembali ke aplikasi klien.
Waktu Target Rata-Rata
Jumlah rata-rata milidetik yang diperlukan dari saat byte terakhir permintaan dikirim dari Apigee ke target backend hingga saat Apigee menerima byte terakhir respons.
Pada dasarnya, metrik ini mengukur berapa banyak waktu yang dihabiskan panggilan API pada sistem
target.
Waktu Proxy Rata-Rata
Nilai ini dihitung sebagai Total Waktu Respons dikurangi Target Waktu
Respons.
Pada dasarnya, ini adalah ukuran berapa lama waktu yang dihabiskan panggilan API untuk mengalir melalui Apigee
itu sendiri (dalam milidetik).
Error Target
Metrik
Deskripsi
Total Error
Mengukur jumlah total error yang dikirim dari target backend ke Apigee.
Error 3XX
Mengukur jumlah total HTTP 3XX yang dikirim dari target backend ke Apigee.
Error 4XX
Mengukur jumlah total error HTTP 4XX yang dikirim dari target backend ke Apigee.
Error 5XX
Mengukur jumlah total HTTP 5XX yang dikirim dari target backend ke Apigee.
Ukuran Payload
Metrik
Deskripsi
Total Ukuran Payload
Ukuran total payload untuk semua permintaan dan respons antara Apigee dan target backend.
Ukuran Payload Permintaan
Ukuran total payload untuk semua permintaan yang dikirim dari Apigee ke target backend.
Ukuran Payload Respons
Ukuran total payload untuk semua respons yang dikirim dari target backend ke Apigee.
[[["Mudah dipahami","easyToUnderstand","thumb-up"],["Memecahkan masalah saya","solvedMyProblem","thumb-up"],["Lainnya","otherUp","thumb-up"]],[["Sulit dipahami","hardToUnderstand","thumb-down"],["Informasi atau kode contoh salah","incorrectInformationOrSampleCode","thumb-down"],["Informasi/contoh yang saya butuhkan tidak ada","missingTheInformationSamplesINeed","thumb-down"],["Masalah terjemahan","translationIssue","thumb-down"],["Lainnya","otherDown","thumb-down"]],["Terakhir diperbarui pada 2025-09-04 UTC."],[[["\u003cp\u003eThis page details the Target Performance dashboard, which is available in both Apigee and Apigee hybrid environments, and provides insights into traffic and performance metrics related to API proxy backend targets.\u003c/p\u003e\n"],["\u003cp\u003eThe Target Performance dashboard, accessible via the Apigee UI in Cloud console or the classic Apigee UI, measures key performance metrics including traffic by target, traffic volume, response times, target errors, and payload sizes.\u003c/p\u003e\n"],["\u003cp\u003eData displayed in the dashboard might experience a delay of up to 10 minutes after API calls are made to proxies, therefore not showcasing real time information.\u003c/p\u003e\n"],["\u003cp\u003eThe dashboard tracks various error types, such as 3XX, 4XX, and 5XX errors, originating from backend targets and relayed to Apigee.\u003c/p\u003e\n"],["\u003cp\u003eResponse Time metrics include Average Time (total response time), Average Target Time (time on the target system), and Average Proxy Time (time within Apigee).\u003c/p\u003e\n"]]],[],null,["# Target performance\n\n*This page\napplies to **Apigee** and **Apigee hybrid**.*\n\n\n*View [Apigee Edge](https://docs.apigee.com/api-platform/get-started/what-apigee-edge) documentation.*\n\nWhat does this dashboard tell me?\n---------------------------------\n\nThe **Target Performance** dashboard helps you visualize traffic patterns and performance metrics\nfor API proxy backend targets.\n\n\n| **Note:** **Data delay interval** \n| After API calls are made to proxies, it may take up to **10 minutes** for the data to appear in dashboards, custom reports, and management API calls.\n\n\u003cbr /\u003e\n\nThe Target Performance dashboard\n--------------------------------\n\nTo access the Target Performance dashboard:\n\n\nIn the Google Cloud console, go to the **Analytics \\\u003e API metrics \\\u003e Target Performance** page.\n\n[Go to Target Performance](https://console.cloud.google.com/apigee/analytics/target-performance)\n\nThe **Target Performance** view is shown:\n\nWhat does this dashboard measure?\n---------------------------------\n\n- [Traffic by Target](#trafficbytarget)\n- [Traffic](#traffic)\n- [Response Time](#responsetime)\n- [Target Errors](#targeterrors)\n- [Payload Size](#payloadsize)\n\n### Traffic by Target\n\n### Traffic\n\n### Response Time\n\nSee also this interesting article on the Apigee Community site:\n[When can the Average Total Response Time be less than the Average Target Response Time?](https://community.apigee.com/articles/2695/when-can-the-average-total-response-time-be-less-t.html)\n\n### Target Errors\n\n### Payload Size"]]