La dashboard Rendimento della cache consente di visualizzare a colpo d'occhio il valore della cache delle risposte.
La dashboard ti aiuta a visualizzare i vantaggi della cache delle risposte in termini di minore latenza e carico ridotto sui server di backend.
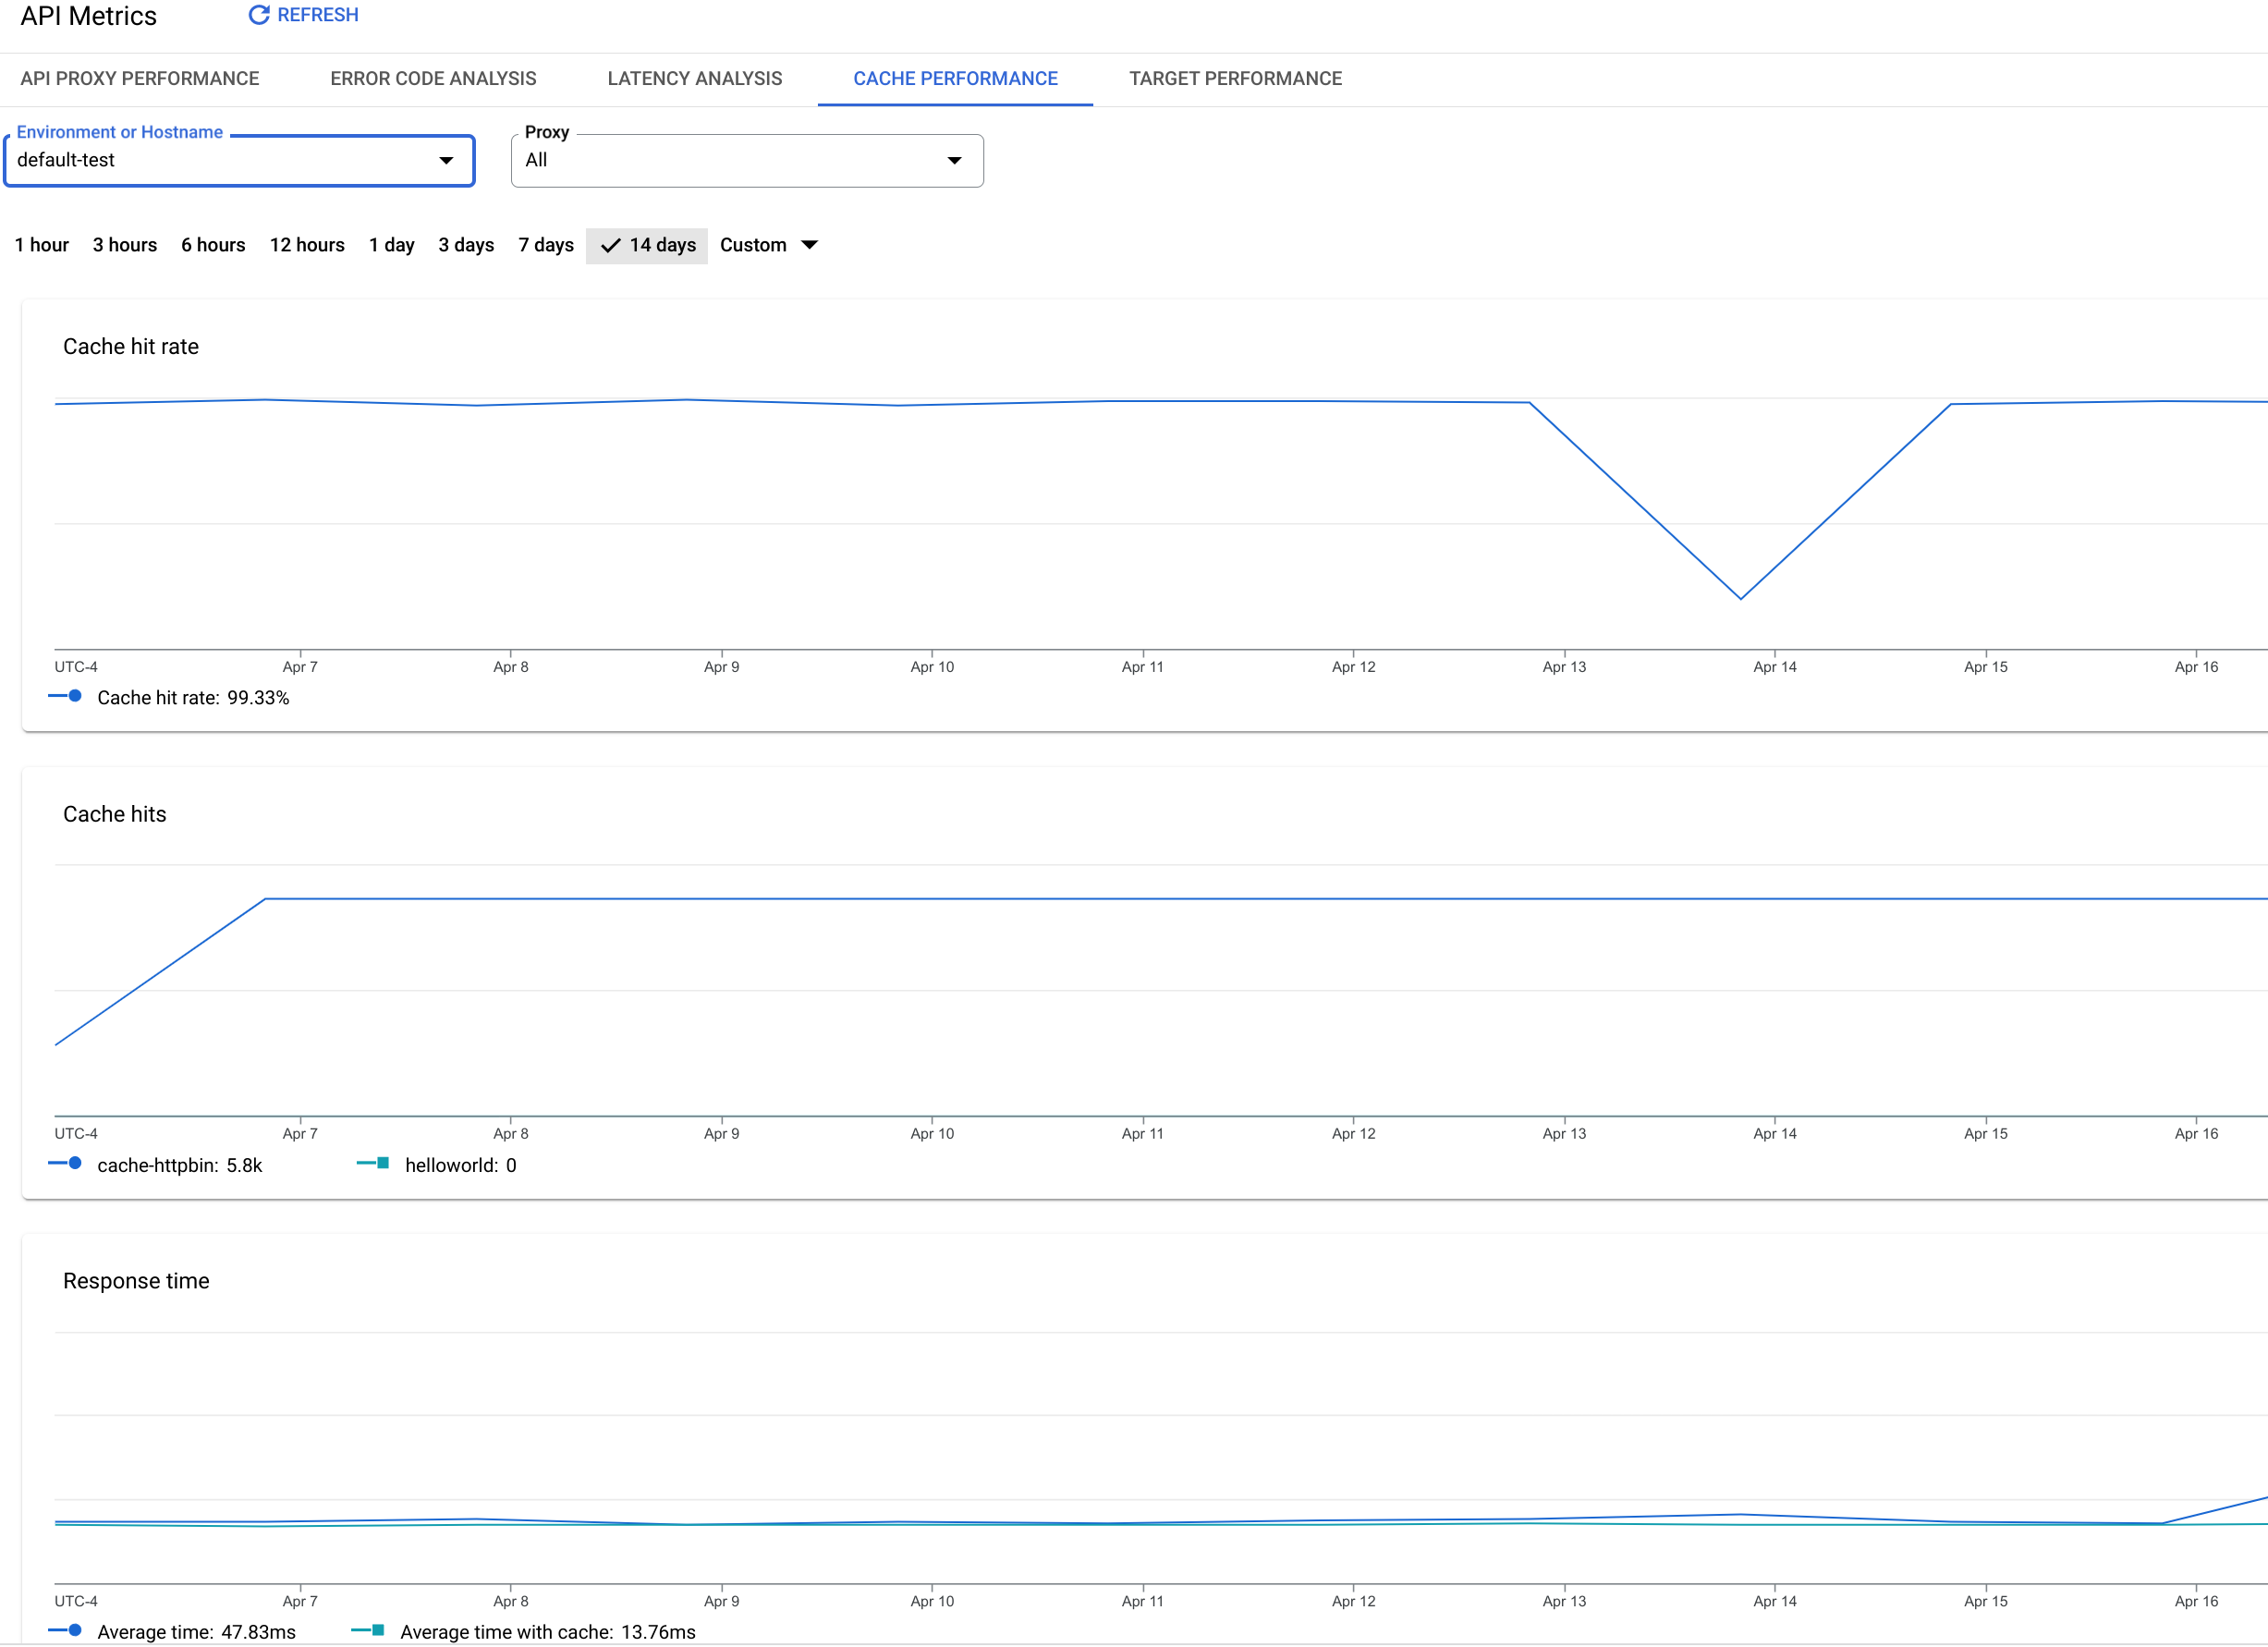
La dashboard Prestazioni della cache
Per accedere alla dashboard sul rendimento della cache:
Nella console Google Cloud , vai alla pagina Analytics > Metriche API > Prestazioni della cache.
[[["Facile da capire","easyToUnderstand","thumb-up"],["Il problema è stato risolto","solvedMyProblem","thumb-up"],["Altra","otherUp","thumb-up"]],[["Difficile da capire","hardToUnderstand","thumb-down"],["Informazioni o codice di esempio errati","incorrectInformationOrSampleCode","thumb-down"],["Mancano le informazioni o gli esempi di cui ho bisogno","missingTheInformationSamplesINeed","thumb-down"],["Problema di traduzione","translationIssue","thumb-down"],["Altra","otherDown","thumb-down"]],["Ultimo aggiornamento 2025-10-19 UTC."],[],[]]