Apigee memungkinkan Anda membuat pemberitahuan yang dipicu oleh pola traffic API tertentu—
misalnya, saat rasio error API
mencapai nilai minimum yang telah ditentukan. AAPI Ops memperluas kemampuan ini dengan
notifikasi anomali, yang dipicu setiap kali Apigee mendeteksi data traffic API
yang tidak biasa. Keuntungan pemberitahuan anomali adalah Anda tidak perlu menentukan kondisi yang tepat
untuk setiap anomali sendiri. AAPI Ops menentukan kondisi anomali yang tepat menggunakan metode statistik,
dan terus memperbaruinya berdasarkan data traffic terbaru.
Dengan menggunakan deteksi anomali, Anda mengizinkan Apigee mendeteksi masalah traffic dan performa, bukan
menentukan kondisi pemberitahuan sendiri.
Saat mendeteksi anomali, AAPI-Ops akan menampilkan peristiwa di dasbor Peristiwa Anomali. Namun, hal ini tidak otomatis memunculkan pemberitahuan untuk
anomali. Jika Anda memeriksa anomali di dasbor dan memutuskan bahwa Anda ingin mendapatkan pemberitahuan tentang peristiwa serupa di masa mendatang, Anda dapat membuat pemberitahuan anomali dan menyiapkan notifikasi, yang akan mengirimkan pesan kepada Anda setiap kali anomali terdeteksi.
Sebelum membuat pemberitahuan anomali, pastikan Anda telah diberi
peran yang diperlukan
untuk AAPI Ops.
Untuk membuat pemberitahuan anomali di dasbor Kebijakan pemberitahuan, lakukan tindakan berikut:
Catatan: Buka dasbor Buat kebijakan pemberitahuan di tab baru jika Anda ingin mengikuti
langkah-langkah di bawah.
Klik TAMBAHKAN KONDISI. Tindakan ini akan membuka jendela baru tempat Anda dapat menambahkan kondisi pemberitahuan.
Opsional: Tambahkan judul untuk
kondisi di kolom Untitled Condition. Kita akan membiarkannya kosong untuk
contoh ini, dalam hal ini kondisi diberi judul default.
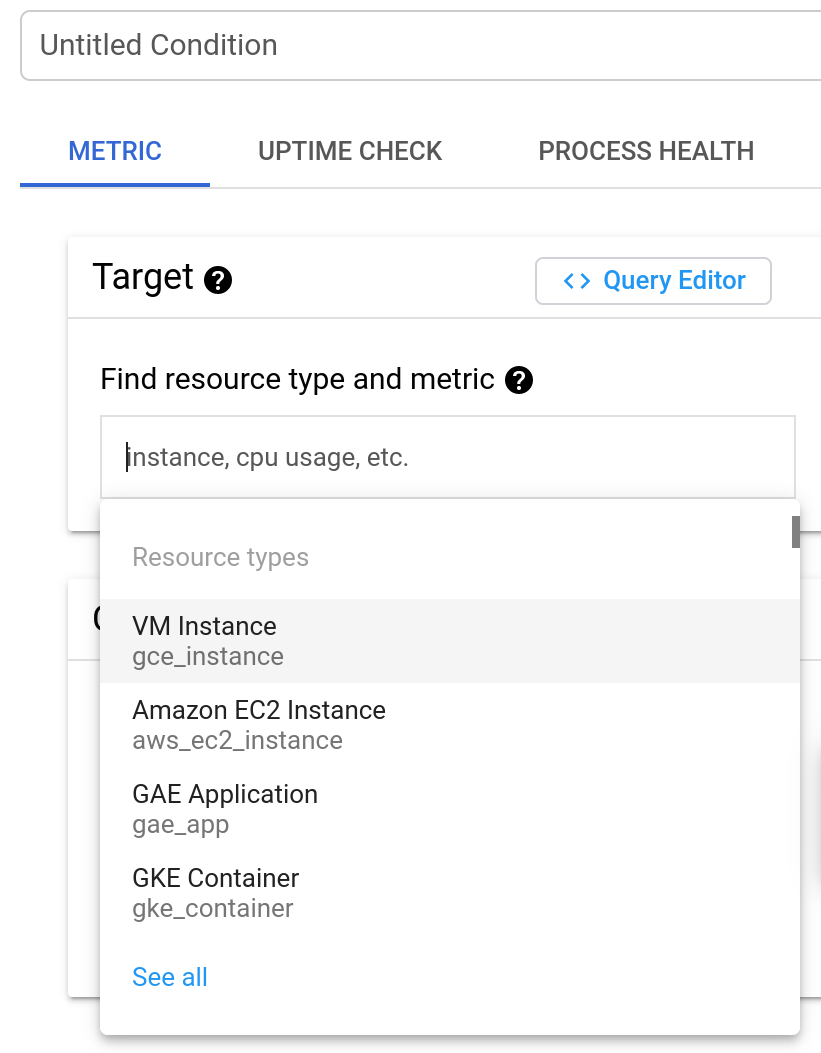
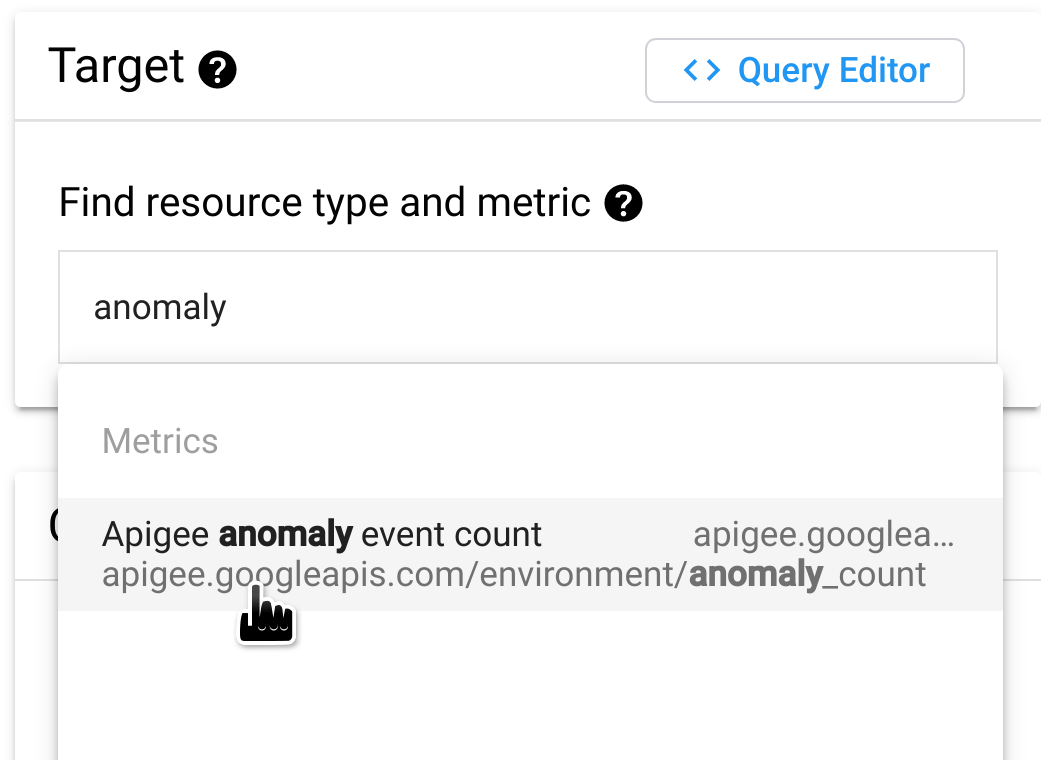
Di kolom Find resource type and metric, ketik
anomaly
lalu pilih Jumlah peristiwa anomali Apigee.
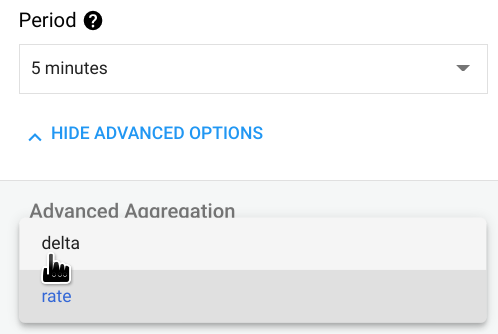
Klik TAMPILKAN SETELAN LANJUTAN dan di panel Advanced Aggregation,
pilih delta di kolom Aligner. Ini menentukan cara data digabungkan selama setiap jangka waktu, yang dapat Anda tetapkan di kolom Period.
Dengan setelan delta, nilai gabungan sama dengan
nilai data akhir dalam jangka waktu dikurangi nilai data awal.
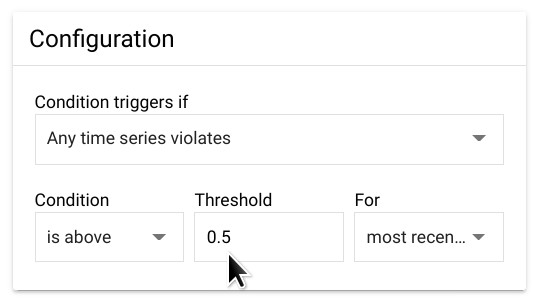
Di panel Configuration, tetapkan Threshold ke 0.5.
(Angka apa pun antara 0 dan 1 akan berfungsi untuk nilai minimum.)
Dengan nilai ini, satu anomali akan melebihi nilai minimum dan memicu pemberitahuan.
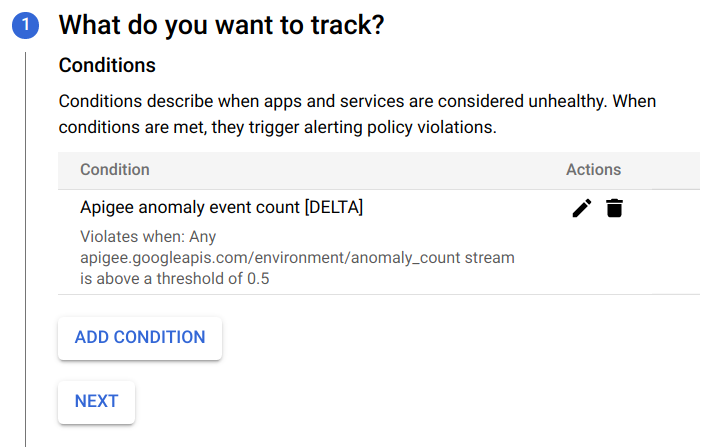
Klik Tambahkan. Tindakan ini akan mengarahkan Anda kembali ke halaman Buat kebijakan pemberitahuan
tempat Anda dapat melihat kondisi yang baru saja dibuat.
Pada tahap ini, Anda dapat memilih untuk:
Klik TAMBAHKAN Kondisi untuk membuat kondisi lain untuk pemberitahuan, atau
Klik BERIKUTNYA untuk melanjutkan ke langkah berikutnya, tempat Anda akan memiliki opsi untuk
membuat notifikasi untuk
pemberitahuan, seperti yang dijelaskan di bagian berikutnya.
Jika Anda tidak ingin membuat notifikasi, klik BERIKUTNYA dua kali tanpa memasukkan apa pun untuk melewati Langkah 2 dan 3.
Klik SIMPAN untuk menyimpan pemberitahuan.
Membuat notifikasi untuk pemberitahuan
Jika ingin segera diberi tahu saat terjadi insiden, Anda dapat membuat notifikasi untuk pemberitahuan. Saat pemberitahuan dipicu, Apigee akan mengirim notifikasi kepada Anda. Anda dapat memilih salah satu saluran berikut untuk menerima notifikasi:
Email
PagerDuty
Slack
Webhook
Untuk membuat notifikasi pemberitahuan:
Jika Anda baru saja membuat pemberitahuan (seperti yang ditunjukkan dalam
contoh sebelumnya) dan saat ini melihat
dasbor Create alerting policy, lanjutkan ke langkah berikutnya.
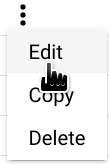
Jika tidak, buka
panel Kebijakan di dasbor Pemberitahuan konsol Cloud, dan di
baris untuk pemberitahuan yang Anda buat, klik ikon tiga titik di akhir
baris, lalu pilih Edit.
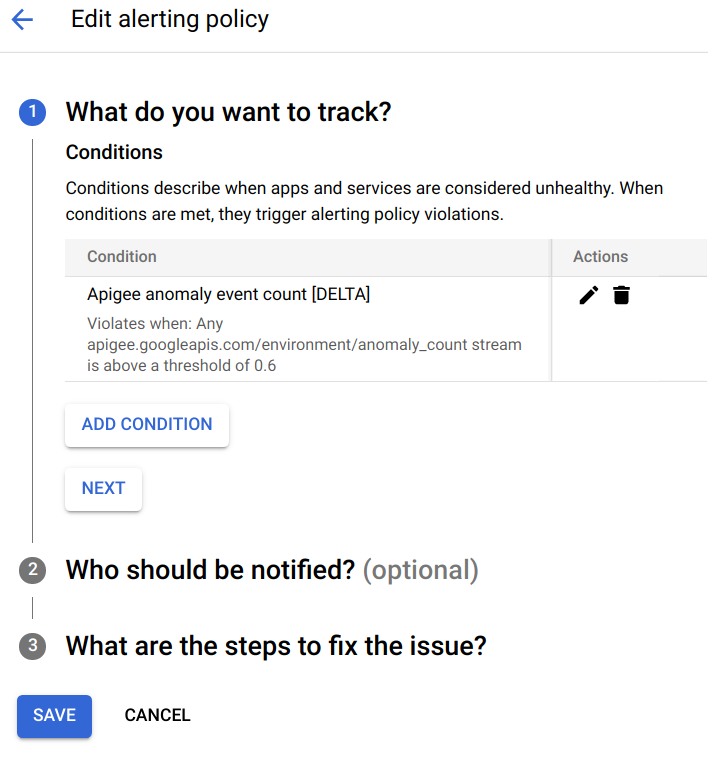
Tindakan ini akan membuka dasbor Edit kebijakan pemberitahuan:
Di bagian Apa yang ingin Anda lacak?, klik BERIKUTNYA.
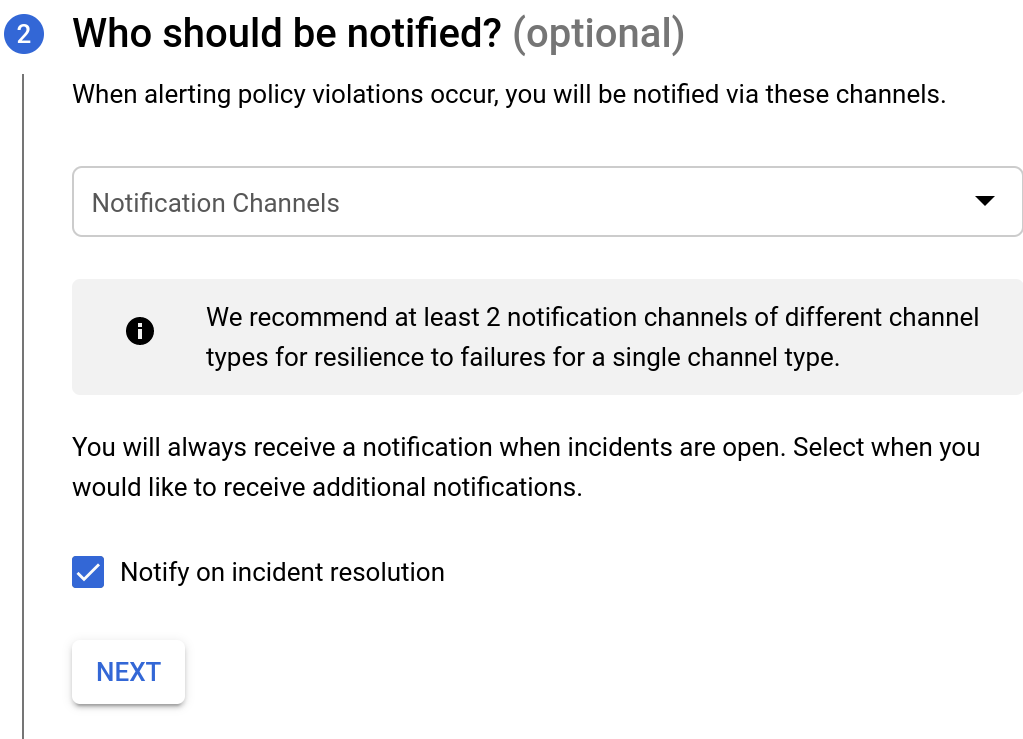
Di bagian Who should be notified, pilih
Notification Channels, tempat Anda dapat memilih dari saluran yang ada untuk menerima
notifikasi.
Jika Anda ingin membuat saluran notifikasi baru, pilih KELOLA SALURAN NOTIFIKASI. Tindakan ini akan membuka dasbor Saluran notifikasi di Cloud Console, tempat Anda dapat menambahkan saluran. Lihat
Membuat dan mengelola saluran notifikasi untuk mengetahui detail selengkapnya.
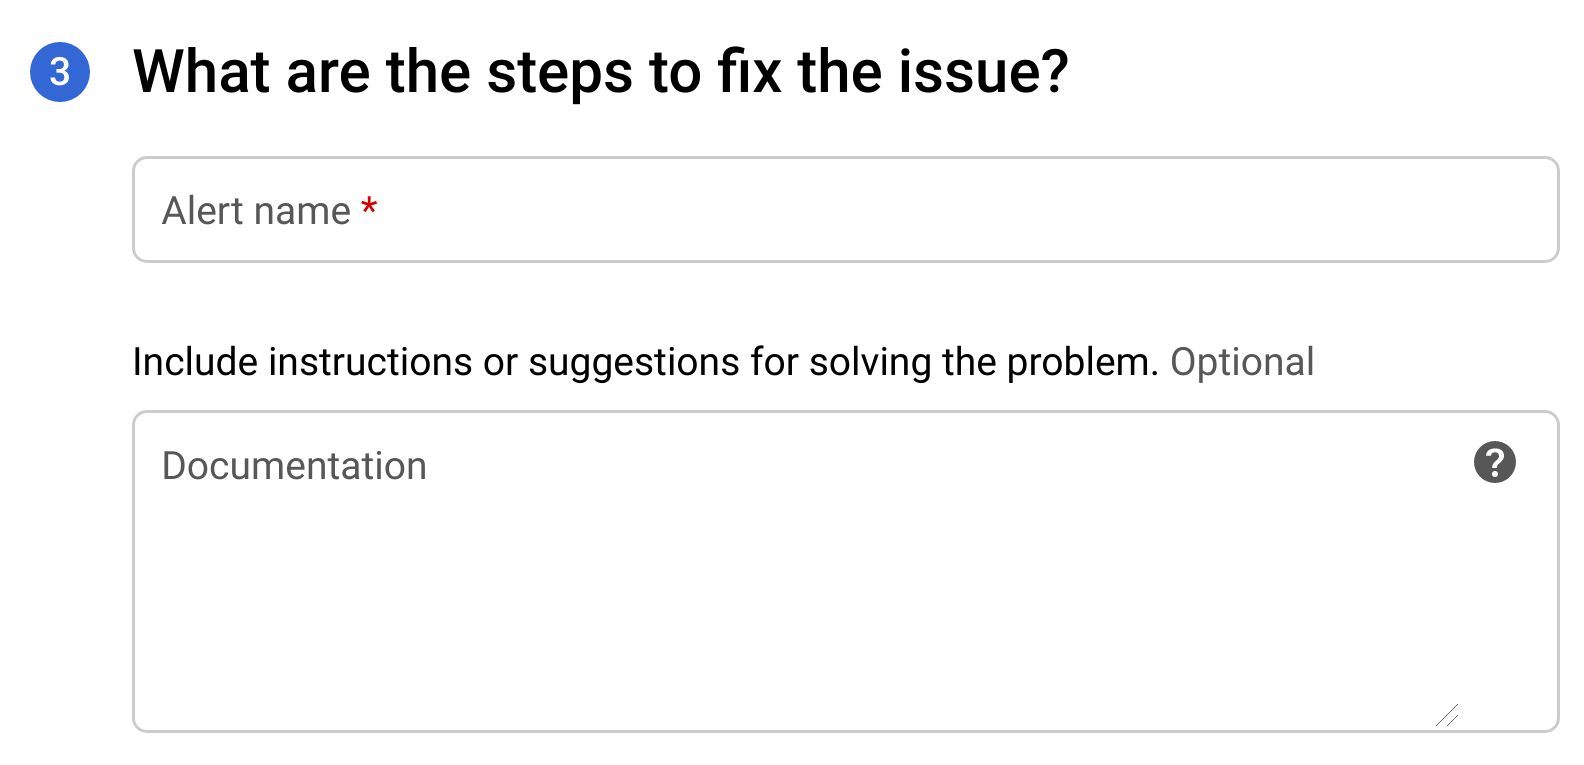
Klik NEXT. Tindakan ini akan menampilkan opsi yang ditampilkan di bawah.
Di kolom Nama pemberitahuan, masukkan nama untuk pemberitahuan.
Di kolom Dokumentasi, masukkan URL untuk halaman web
yang memberikan informasi tentang cara memperbaiki masalah yang menyebabkan pemberitahuan. URL
akan disertakan dalam notifikasi.
Klik Simpan untuk membuat pemberitahuan.
Saat pemberitahuan dipicu, Anda akan menerima notifikasi yang memberikan ringkasan insiden dan waktu terjadinya. Notifikasi ini juga berisi dua link untuk membantu Anda menyelidiki insiden:
[[["Mudah dipahami","easyToUnderstand","thumb-up"],["Memecahkan masalah saya","solvedMyProblem","thumb-up"],["Lainnya","otherUp","thumb-up"]],[["Sulit dipahami","hardToUnderstand","thumb-down"],["Informasi atau kode contoh salah","incorrectInformationOrSampleCode","thumb-down"],["Informasi/contoh yang saya butuhkan tidak ada","missingTheInformationSamplesINeed","thumb-down"],["Masalah terjemahan","translationIssue","thumb-down"],["Lainnya","otherDown","thumb-down"]],["Terakhir diperbarui pada 2025-08-19 UTC."],[[["\u003cp\u003eApigee offers anomaly alerts that automatically detect unusual API traffic patterns without requiring users to manually define specific anomaly conditions.\u003c/p\u003e\n"],["\u003cp\u003eAnomaly detection events are displayed on the Anomaly Events dashboard, and users can choose to set up anomaly alerts with notifications for similar future events.\u003c/p\u003e\n"],["\u003cp\u003eTo create an anomaly alert, users must navigate to the "Create alerting policy" dashboard in the Google Cloud console and select "Apigee anomaly event count" as the metric.\u003c/p\u003e\n"],["\u003cp\u003eUsers can configure notifications for anomaly alerts to be sent via email, PagerDuty, Slack, or webhooks when an anomaly is detected.\u003c/p\u003e\n"],["\u003cp\u003eWhen an anomaly alert is triggered, notifications include links to view the incident in the Cloud console and an API traffic timeline graph in the API Monitoring Investigate dashboard.\u003c/p\u003e\n"]]],[],null,["# Creating anomaly alerts\n\n*This page\napplies to **Apigee** and **Apigee hybrid**.*\n\n\n*View [Apigee Edge](https://docs.apigee.com/api-platform/get-started/what-apigee-edge) documentation.*\n\nApigee enables you to create alerts that are triggered by specific API traffic patterns---\nfor example, when an API's\nerror rate reaches a predetermined threshold. AAPI Ops extends this capability with\n*anomaly alerts*, which are triggered whenever Apigee detects unusual API traffic\ndata. The advantage of anomaly alerts is that you don't have to define the exact conditions\nfor each anomaly yourself. AAPI Ops determines the right anomaly conditions using statistical methods,\nand constantly updates them based on recent traffic data.\nUsing anomaly detection, you let Apigee detect traffic and performance issues, rather than\npredetermining the alert conditions yourself.\n| **Important:** \"Anomaly Detection\" describes the Advanced API Operations Anomaly Detection functionality, which is available in the Classic Apigee UI. This functionality is comparable to the \"Operations Anomalies\" functionality in [Apigee UI in Cloud console](https://console.cloud.google.com/apigee). Both are available at this time. See [Operations Anomalies overview](/apigee/docs/api-platform/analytics/operations-anomalies-overview) for information on the Operations Anomalies functionality.\n\nWhen AAPI-Ops detects an anomaly, it displays the event in the Anomaly Events\ndashboard. However, it doesn't automatically raise an alert for\nthe anomaly. If you examine an anomaly in the dashboard and decide you want to be alerted about\nsimilar event in future, you can create an anomaly alert\nand set up a notification, which sends you a message whenever the anomaly is detected.\n\nBefore creating an anomaly alert, make sure you have been assigned the\n[required roles](/apigee/docs/aapi-ops#required-roles-for-aapi-ops)\nfor AAPI Ops.\n\nTo create an anomaly alert in the Alerting policy dashboard, do the following:\n\n1. Open the\n [Create alerting policy](https://console.cloud.google.com/monitoring/alerting/policies/create?) dashboard in the Google Cloud console.\n\n **Note:** Open the Create alerting policy dashboard in a new tab if you want to follow\n the steps below.\n2. Click **ADD CONDITION** . This opens a new window where you can add the alert condition.\n\n\n3. Optional: Add a title for the condition in the **Untitled Condition** field. We'll leave it blank for this example, in which case the condition is given a default title.\n4. In the **Find resource type and metric** field, type\n\n ```\n anomaly\n ```\n\n and then select **Apigee anomaly event count**.\n5. Click **SHOW ADVANCED SETTINGS** and in the **Advanced Aggregation** pane,\n select **delta** in the **Aligner** field. This specifies how the data is\n aggregated over each time period, which you can set in the **Period** field.\n With the **delta** setting, the aggregated value equals the\n final data value in the time period minus the initial data value.\n\n6. In the **Configuration** pane, set the **Threshold** to **0.5**.\n (Any number between 0 and 1 will work for the threshold.)\n With this value, a single anomaly exceeds the threshold and triggers the alert.\n\n7. Click **Add** . This takes you back to the **Create alerting policy** page\n where you can see the condition you just created.\n\nAt this point you can choose to either:\n\n- Click **ADD Condition** to create another condition for the alert, or\n- Click **NEXT** to go to the next step, where you will have the option to [create a notification for the\n alert](#creating-a-notification-for-an-alert), as described in the next section.\n\nIf you don't want to create a notification, click **NEXT** twice\nwithout entering anything to bypass Steps 2 and 3.\n\nClick **SAVE** to save the alert.\n\nCreating a notification for an alert\n------------------------------------\n\nIf you want to be notified immediately when an incident occurs, you can create\na notification for the alert. When the alert is triggered, Apigee sends you\na notification. You can choose any of the following channels to receive\nthe notification:\n\n- Email\n- PagerDuty\n- Slack\n- Webhooks\n\n| **Note:** Currently, to receive a notification, you must add **org** to the **Group by** field in the alert. This requirement will be removed in a future release.\n\nTo create a notification for an alert:\n\n1. If you just created the alert (as shown in the\n preceding example) and are currently viewing the\n **Create alerting policy** dashboard, skip to the next step.\n\n Otherwise, open the\n [**Policies** pane](https://console.cloud.google.com/monitoring/alerting/policies) in the Cloud console Alerting dashboard, and in\n the row for the alert you created, click the three dots icon at the end\n of the row and select **Edit**.\n\n This opens the **Edit alerting policy** dashboard:\n2. In the **What do you want to track?** section, click **NEXT**.\n\n3. In the **Who should be notified** section, select\n **Notification Channels**, where you can choose from existing channels for receiving\n notifications.\n\n If you want to create a new\n notification channel, select **MANAGE NOTIFICATION CHANNELS** . This\n opens the Notification channels dashboard in the Cloud console, where you can\n add channels. See\n [Create and manage notification channels](https://cloud.google.com/monitoring/support/notification-options) for more details.\n4. Click **NEXT**. This displays the options shown below.\n\n5. In the **Alert name** field, enter a name for the alert.\n6. In the **Documentation** field, enter the URL for a web page that provides information on how to fix the issue that caused the alert. The URL will be included in the notification.\n7. Click **Save** to create the alert.\n\nWhen an alert is triggered, you will receive a notification\nproviding a summary of the incident and when it occurred. The notification\nalso contains two links to help you investigate the incident:\n\n- **VIEW INCIDENT**: View the incident in the Cloud console.\n- **VIEW IN APIGEE** : View a timeline graph of API traffic and related data tables in the [API Monitoring Investigate dashboard](/apigee/docs/api-monitoring/investigate)."]]