This page applies to Apigee and Apigee hybrid.
This page describes the API resource insights available for each API resource in API hub. These insights are collected and analyzed using the API insights feature in API hub. For more information about API insights, see API insights overview.
Before you begin
Assign the following IAM roles to your principal account:
- API hub API Insights Viewer (
roles/apihub.apiInsightsViewer) - API hub Viewer (
roles/apihub.viewer)
View insights
The Insights tab on the API details page provides api-centric insights, enabling you to understand API usage patterns and adoption for a particular API. You can filter the insights based on the deployment name.
The following insights are available for each API resource:
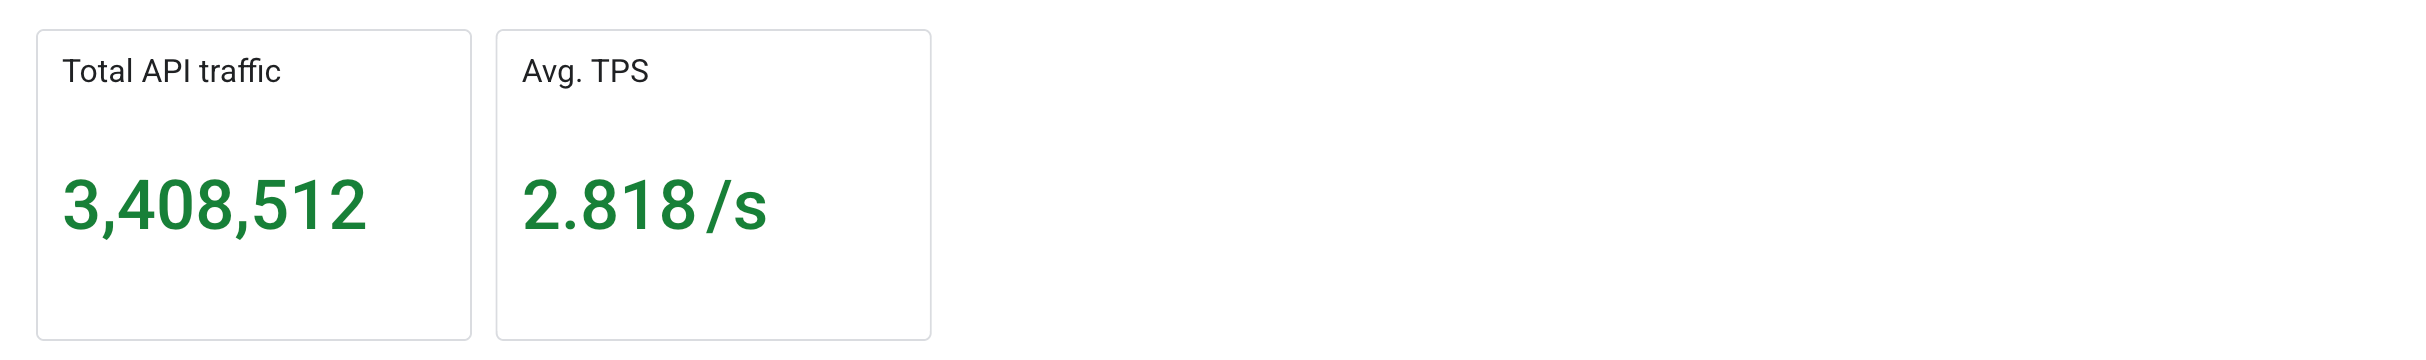
- Summary scorecards: the following metric scorecards are displayed to provide a quick overview of the API traffic and performance data:
- Total API traffic: the total number of API calls in the selected time period.
- Avg TPS: the average number of transactions processed per second in the selected time period.
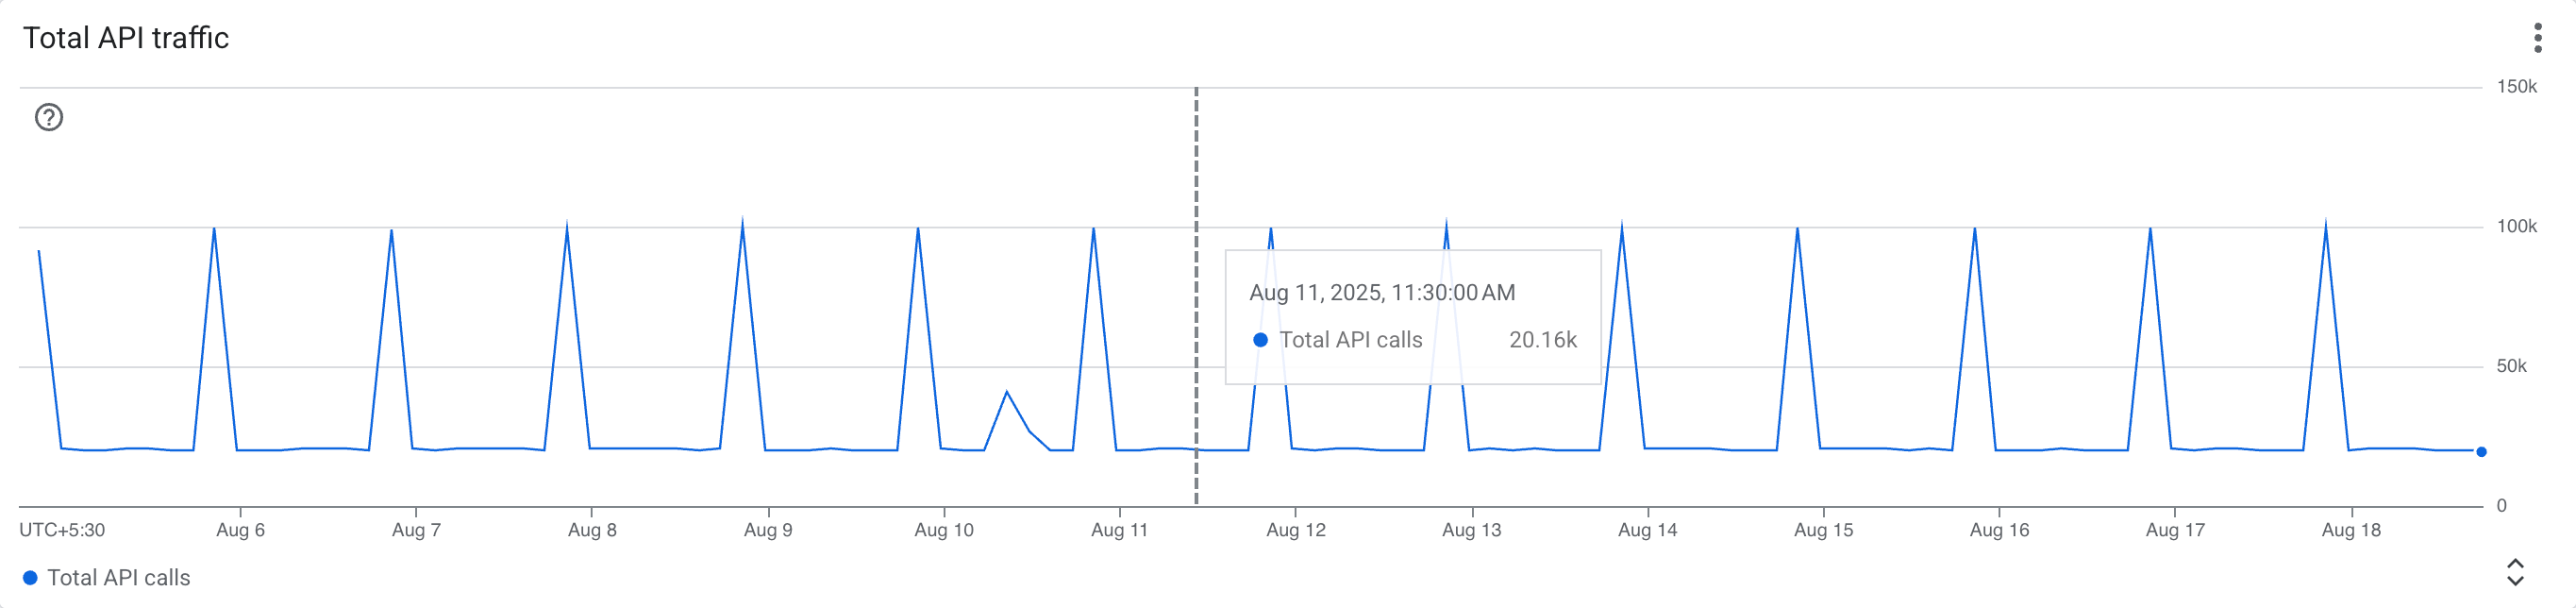
- Total API traffic: displays a time-series graph of the total number of API calls in the selected time period.
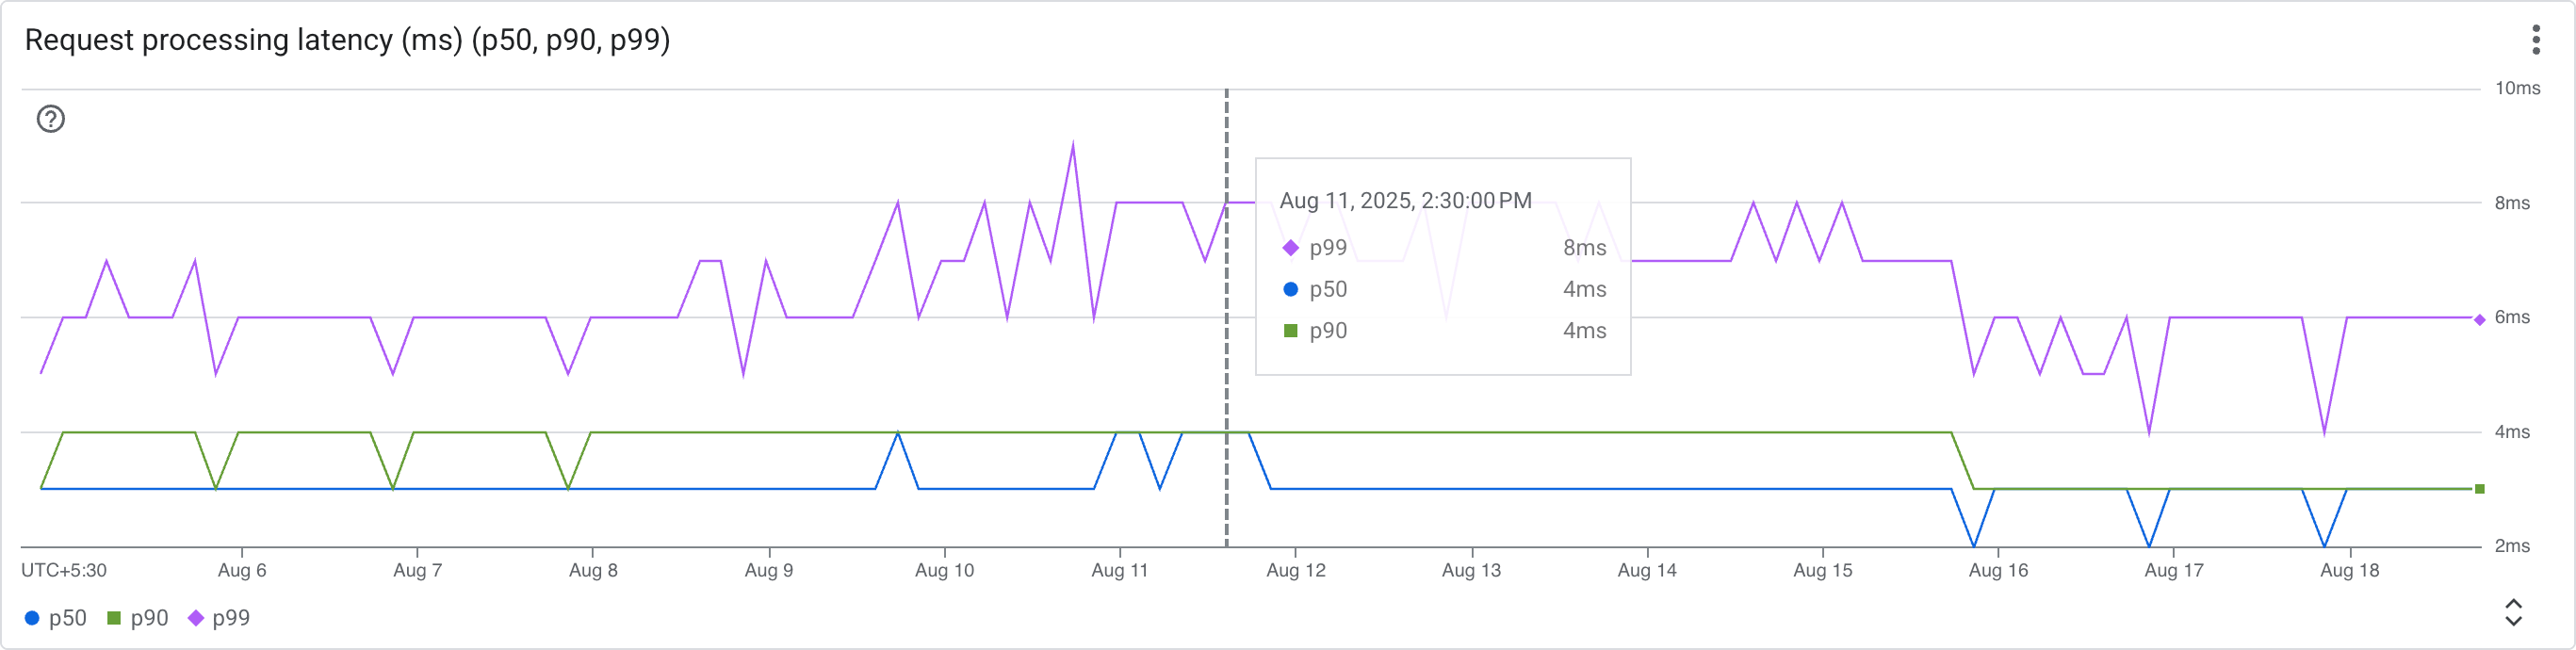
- Request processing latency (ms) (p50, p90, p99): displays percentiles (p50, p90, p99) of the latency specifically during the request processing phase in milliseconds for APIs in the selected time period.
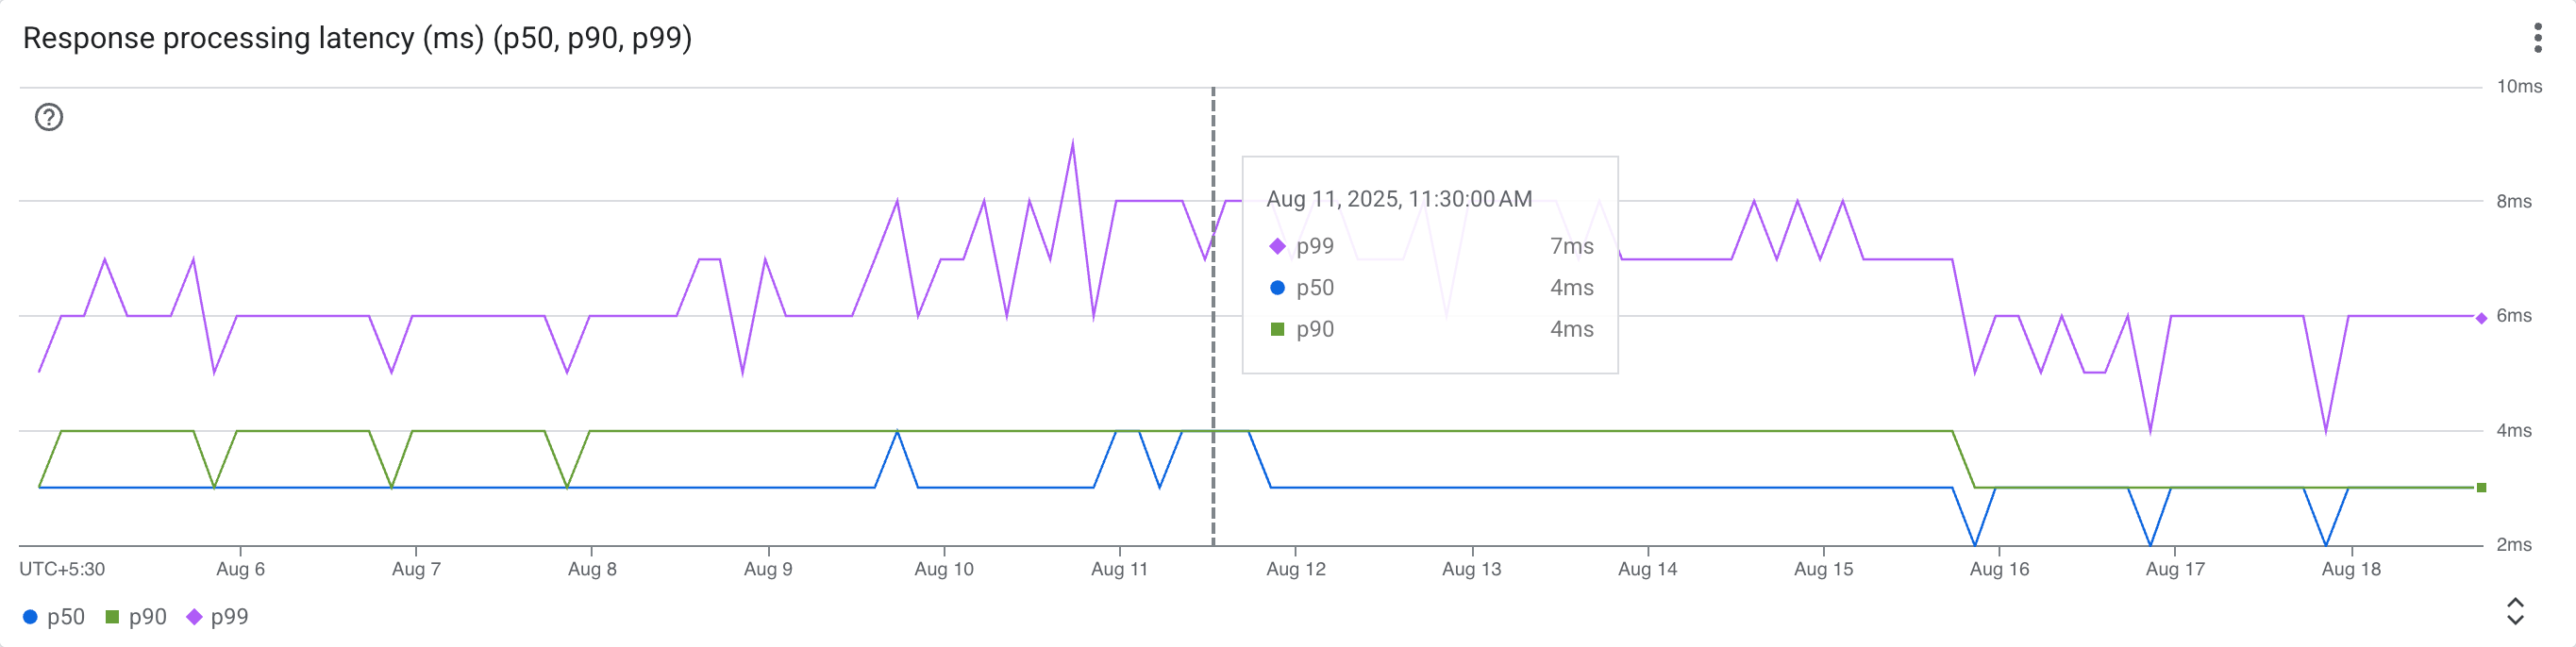
- Response processing latency (ms) (p50, p90, p99): displays percentiles (p50, p90, p99) of the latency specifically during the response processing phase in milliseconds for APIs in the selected time period.
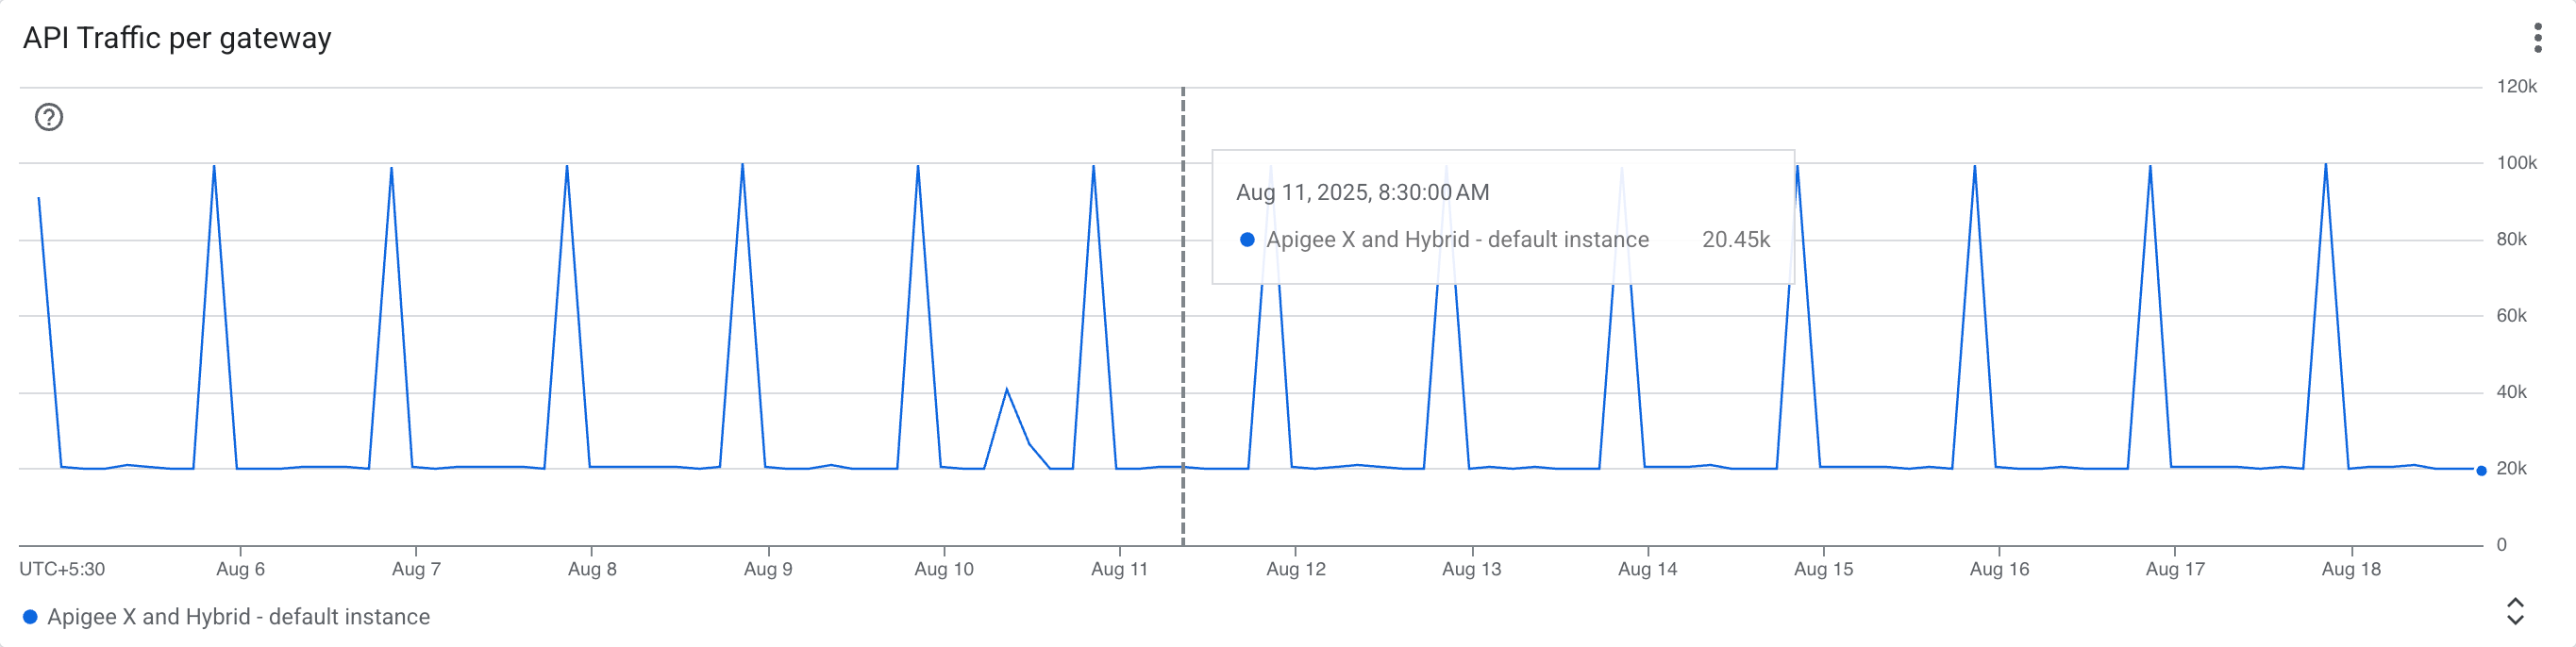
- API traffic per gateway: displays a time-series graph of the total number of API calls for each gateway in the selected time period.
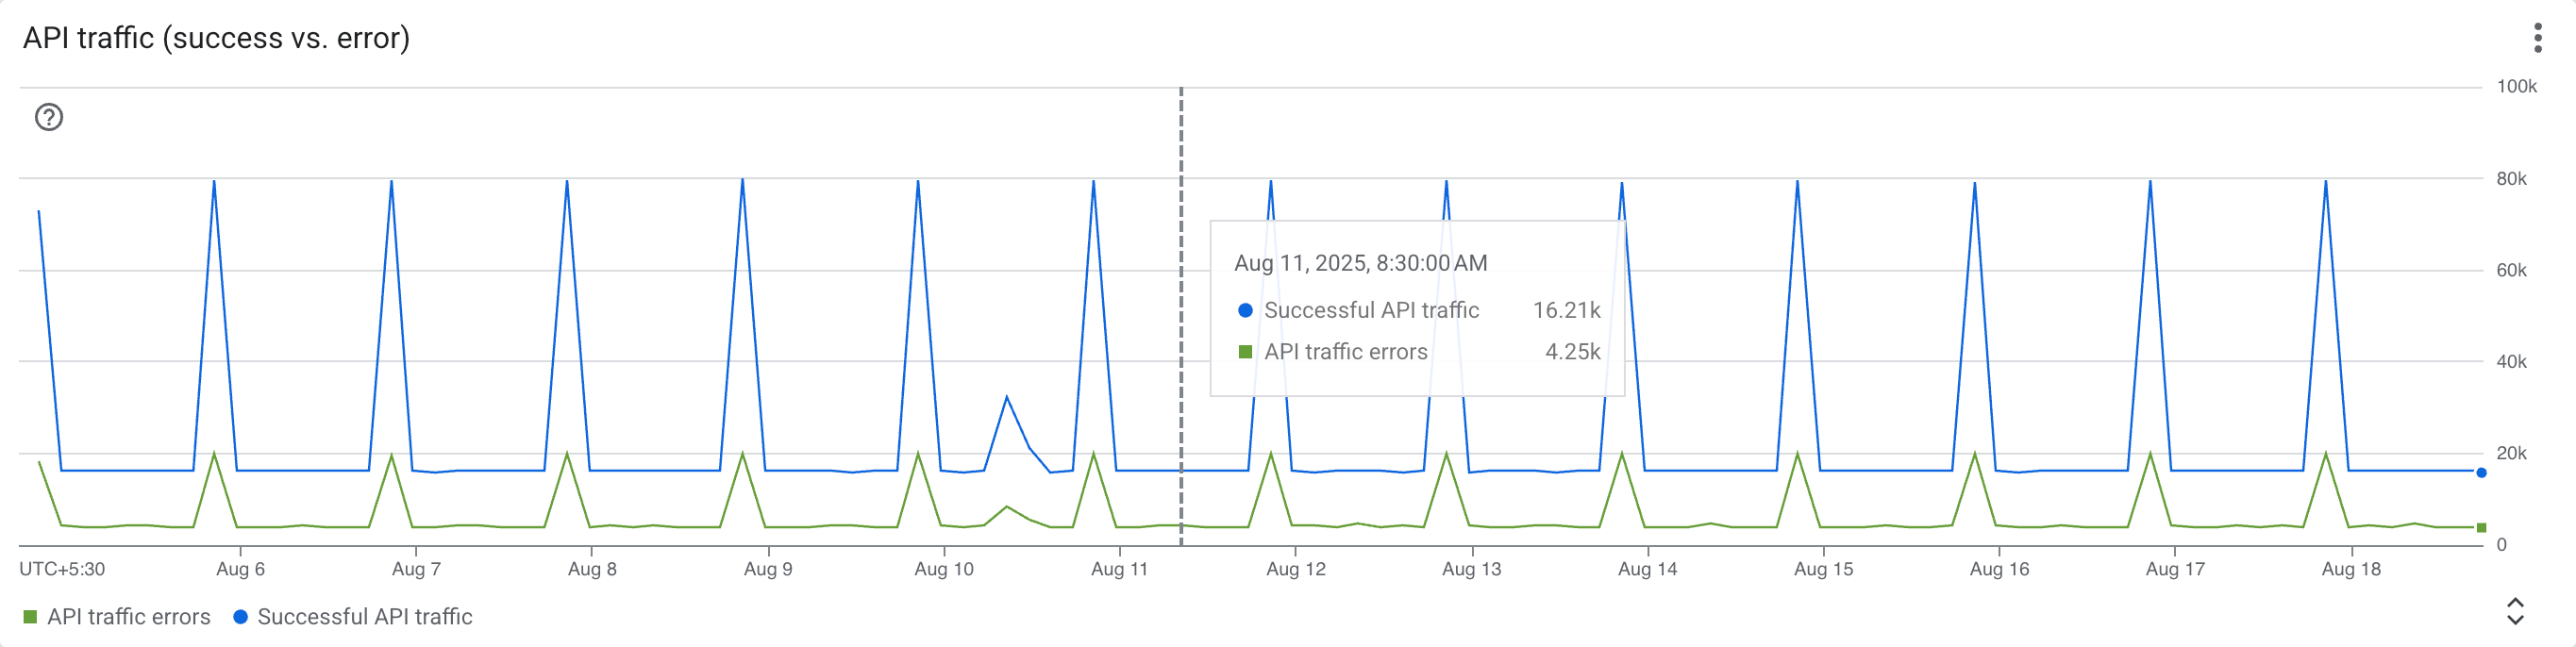
- API traffic (success vs. error): displays a time-series graph comparing successful API calls to error calls in the selected time period.
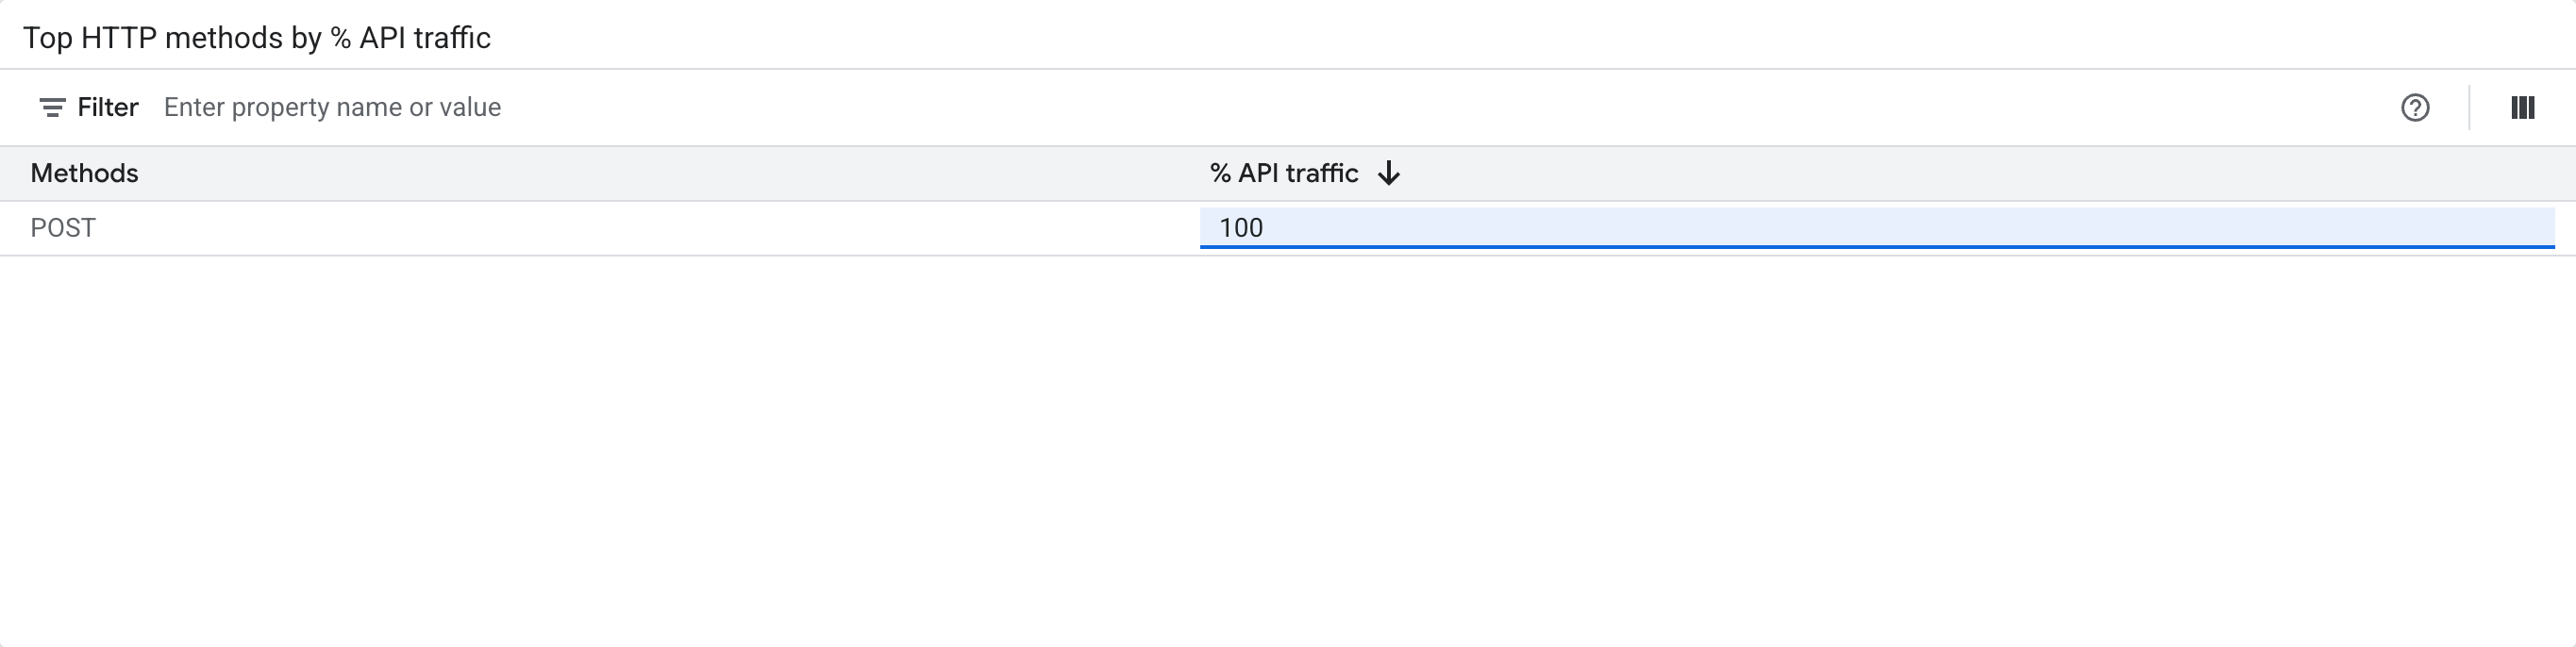
- Top HTTP methods by % API traffic: shows the HTTP methods used and the percentage of calls for each method.
Limitations
- API insights doesn't support data ingestion for custom plugins.
- API hub doesn't support REST APIs for the API insights feature.
- API insights doesn't support exporting metric data to other Google Cloud services such as BigQuery, Cloud Storage, or Looker Studio.
- Time-series charts and tables are limited to displaying the top 50 API resources.
Considerations
- If the data volume is too large for a selected time range, or if you have a high number of resources (such as APIs, deployments, plugin instances, or target IPs), the UI might not be able to display the data. Consider selecting smaller time ranges for better results and keeping your resources below 1000.
What's next
- Learn more about API insights overview.
- Learn more about API insights dashboards.