A Apigee híbrida disponibiliza para você dados de status de depuração, análise e implantação. Esses dados são
coletados por um pod de coleta de dados que os envia ao plano de gerenciamento para que seja possível visualizá-los, analisá-los e
configurar o monitoramento e os alertas.
Sobre os dados
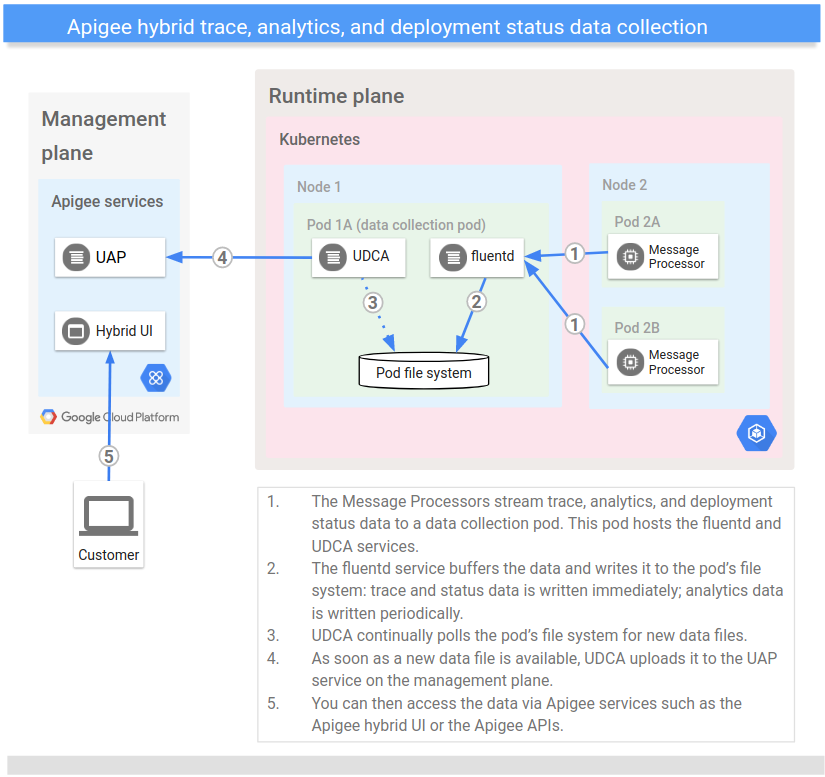
Todos os serviços do Processador de mensagens (MP, na sigla em inglês) nos dados de status de depuração
de stream híbrido (quando iniciado), análise e implantação por
TCP para um pod de coleta de dados no cluster. O pod de coleta de dados armazena os dados transmitidos no
sistema de arquivos do pod por meio de um serviço fluentd.
O UDCA (Universal Data Collection Agent) extrai periodicamente os dados armazenados e os envia para o
serviço UAP (Unified Analytics Platform) no plano de gerenciamento. O UAP processa os dados recebidos
de status de análise e implantação e os disponibiliza na IU híbrida ou nas
APIs Apigee.
A Apigee híbrida implementa o pod de coleta de dados como um ReplicaSet com no mínimo duas
réplicas.
A imagem a seguir mostra o processo de coleta de dados de status de depuração, análise e implantação:
Os dados de status de depuração, análise e implantação não são armazenados no
mesmo local ou acessados da mesma forma que os dados de geração de registros e métricas:
Os dados de geração e registros e métricas são armazenados no projeto do GCP e
acessados por meio de uma ferramenta, como o Stackdriver, ou a que você
escolher.
Os dados de status de depuração, análise e implantação, por outro lado, são
armazenados no plano de gerenciamento híbrido, e você os acessa nos
serviços da Apigee, como a IU híbrida ou as APIs Apigee.
Na tabela a seguir, resumimos os dados coletados pelo pod de coleta de dados:
Tipo de dados
Nome do conjunto de dados
Descrição
Frequência de atualização
APIs
Análise
api
Dados de uso da API, incluindo transações por segundo, uso de cache,
erros, latências, tamanhos de solicitações/respostas e contagens de tráfego.
Depurar os dados da sessão para proxies de API. Esses dados incluem os parâmetros de solicitação/resposta com transformações aplicadas
no momento da execução da política.
Devido ao tamanho, os dados de depuração, diferentemente dos dados de status de análise e implantação, não são
coletados o tempo todo. Em vez disso, eles são coletados quando você inicia uma sessão de
depuração.
Nesta seção, descrevemos como visualizar os dados de status de depuração, análise e implantação na IU da Apigee
híbrida.
Depuração
Os dados de depuração para serviços híbridos podem ser acessados da mesma maneira que os dados de depuração do Edge, com algumas
diferenças, como maior suporte ao filtro. Para mais
informações, consulte Visão geral da depuração.
Análise
Os dados de análise para serviços híbridos podem ser acessados da mesma maneira
que os dados de análise do Edge. Para mais informações, consulte
Como usar os painéis de análise na
documentação do Edge.
Para definir como e onde os dados de status de depuração, análise e implantação são
coletados no pod de coleta de dados, configure o serviço UDCA
nas propriedades de configuração. As propriedades do UDCA
incluem tanto as gerais do UDCA quanto as
específicas de cada conjunto de dados.
[[["Fácil de entender","easyToUnderstand","thumb-up"],["Meu problema foi resolvido","solvedMyProblem","thumb-up"],["Outro","otherUp","thumb-up"]],[["Difícil de entender","hardToUnderstand","thumb-down"],["Informações incorretas ou exemplo de código","incorrectInformationOrSampleCode","thumb-down"],["Não contém as informações/amostras de que eu preciso","missingTheInformationSamplesINeed","thumb-down"],["Problema na tradução","translationIssue","thumb-down"],["Outro","otherDown","thumb-down"]],["Última atualização 2025-08-28 UTC."],[[["\u003cp\u003eThis document details how Apigee hybrid collects debug, analytics, and deployment status data from Message Processor services via a dedicated data collection pod, then sends it to the management plane for analysis and monitoring.\u003c/p\u003e\n"],["\u003cp\u003eData is collected by a data collection pod, stored temporarily on the pod's file system, and then periodically extracted by the UDCA (Universal Data Collection Agent) and sent to the UAP (Unified Analytics Platform) service.\u003c/p\u003e\n"],["\u003cp\u003eApigee hybrid offers three types of data: analytics, which includes API usage data with a 30-second delay; deployment status, which shows the current status of API proxies in real-time; and debug, which captures detailed session data upon initiation, all of which are accessible via the hybrid UI or Apigee APIs.\u003c/p\u003e\n"],["\u003cp\u003eThe UDCA configuration properties, such as polling interval and replica settings, can be customized by modifying the \u003ccode\u003eoverrides.yaml\u003c/code\u003e file, which affects how data is collected.\u003c/p\u003e\n"],["\u003cp\u003eVersion 1.2 of this Apigee hybrid documentation is end of life, thus you should upgrade to a newer version for the latest features and support.\u003c/p\u003e\n"]]],[],null,["# Debug, analytics, and deployment status data collection\n\n| You are currently viewing version 1.2 of the Apigee hybrid documentation. **This version is end of life.** You should upgrade to a newer version. For more information, see [Supported versions](/apigee/docs/hybrid/supported-platforms#supported-versions).\n\nApigee hybrid makes debug, analytics, and deployment status data available to you. This data is\ncollected by a data collection pod which sends it to the management plane so that you can view and\nanalyze it and set up monitoring and alerts.\n\nAbout the data\n--------------\n\nAll Message Processor (MP) services in hybrid stream debug (when initiated), analytics,\nand deployment status data via\nTCP to a data collection pod in the cluster. The data collection pod stores the streamed data on the\npod's file system via a fluentd service.\n\nThe UDCA (Universal Data Collection Agent) periodically extracts the stored data and sends it to\nthe UAP (Unified Analytics Platform) service in the management plane. The UAP processes the incoming\nanalytics and deployment status data and makes it available to you via the hybrid UI or the\n[Apigee APIs](/apigee/docs/reference/apis/apigee/rest).\n\nApigee hybrid implements the data collection pod as a [ReplicaSet](https://kubernetes.io/docs/concepts/workloads/controllers/replicaset/) with a minimum of two\nreplicas.\n\nThe following image shows the debug, analytics, and deployment status data collection process:\n\nNote that the debug, analytics, and deployment status data is not stored in the\nsame location or accessed in the same way as the logging and metrics data:\n\n- *Logging and metrics data* are stored on your GCP Project and accessed via a tool such as Stackdriver or whatever you choose to use.\n- *Debug, analytics and deployment status data* , on the other hand, is stored in the hybrid management plane and you access it via Apigee services such as the hybrid UI or [Apigee APIs](/apigee/docs/reference/apis/apigee/rest).\n\nThe following table summarizes the data collected by the data collection pod:\n\n| **TIP:** The *dataset name* is the name by which this type of data is referred to in the UDCA configuration properties. For example, analytics data is configured with the dataset name `api`. As a result, the configuration property that sets the location of the analytics data files is called **api**`DataSubDir`.\n|\n| You can access this data through the Apigee hybrid UI or [Apigee APIs](/apigee/docs/reference/apis/apigee/rest) on the management\n| plane.\n\nView the data in the hybrid UI\n------------------------------\n\nThis section describes how to view the debug, analytics, and deployment status data in the Apigee\nhybrid UI.\n\n### Debug\n\nDebug data for hybrid services is accessible in the same way as Edge debug data, with some\ndifferences such as increased filter support. For more\ninformation, see [Debug overview](/apigee/docs/hybrid/v1.2/trace).\n\n### Analytics\n\nAnalytics data for hybrid services is accessible in the same way\nas Edge analytics data. For more information, see\n[Using the analytics dashboards](/apigee/docs/api-platform/analytics/using-analytics-dashboards) in\nthe Edge documentation.\n\n### Proxy deployment status\n\nFor information on viewing deployment status, see\n[View deployment status](/apigee/docs/hybrid/v1.2/ui-deploy-overview#view-deployment-status).\n\nConfigure the data collection\n-----------------------------\n\nTo set how and where debug, analytics, and deployment status data is\ncollected on the data collection pod, you configure the UDCA\nservice via its configuration properties. The UDCA properties\ninclude properties that are general to the UDCA as well as\nproperties that are specific to each dataset.\n\n**To configure the UDCA:**\n\n1. Open the `overrides.yaml` file for editing on your Kubernetes administration machine, as described in [Manage runtime plane components](/apigee/docs/hybrid/v1.3/customize-services).\n2. Set the values of the UDCA configuration settings. For the UDCA, you can set custom values for properties such as:\n - Polling interval\n - Number of replicas (min and max)\n - Target CPU percentage (that triggers additional replicas)\n\n For a complete list of UDCA properties that you can customize,\n see [`udca`](/apigee/docs/hybrid/v1.2/config-prop-ref#udca).\n3. Save your changes to the overrides.yaml file.\n4. Apply your changes to your cluster by executing the `apigeectl apply` command, as the following example shows: \n\n ```\n apigeectl apply -f my-overrides.yaml -c udca\n ```\n | **TIP** : To see the default configuration properties, the UDCA service (under `udca:`) in the [Configuration property reference](/apigee/docs/hybrid/v1.3/config-prop-ref).\n\n For more information about the `apply` command, see\n [Apply hybrid to your cluster](/apigee/docs/hybrid/v1.2/cli-reference#apply)."]]