Mit dem Offline Debugging-Tool können Sie Offline-Debugging-Sitzungen anzeigen und analysieren, die in der Ansicht Debugging des Proxy-Editors zuvor heruntergeladen wurden. Eine gespeicherte Debugging-Sitzung ist im Wesentlichen eine „Aufzeichnung“ einer Debugging-Sitzung und kann in Fällen nützlich sein, in denen eine Fehlerbehebung und weitere Analyse erforderlich sind. Die Benutzeroberfläche für das Offline-Debugging-Tool ähnelt der Ansicht Debugging im Proxy-Editor.
Informationen zur Benutzeroberfläche des Debugging-Tools und zum Herunterladen von Fehlerbehebungssitzungen finden Sie unter Fehlerbehebung verwenden.
Cloud Console-UI
Debug v2 (neu)
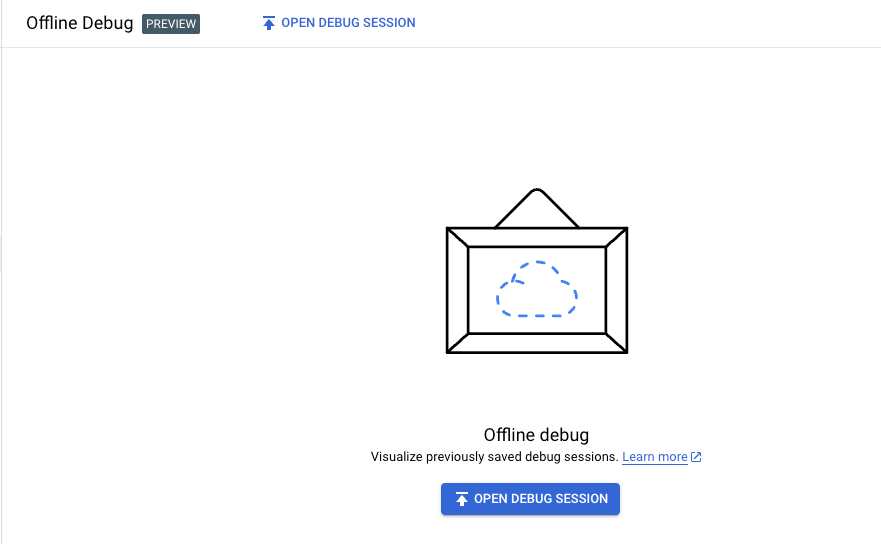
So rufen Sie heruntergeladene Daten zur Fehlerbehebung per Offline-Debugging auf:
Klicken Sie auf Debug-Sitzung öffnen, wählen Sie eine
zuvor heruntergeladeneOffline-Debugging-Sitzungsdatei im JSON-Format aus und klicken Sie dann auf Öffnen, um Daten in die Ansicht Offline-Debugging zu laden.
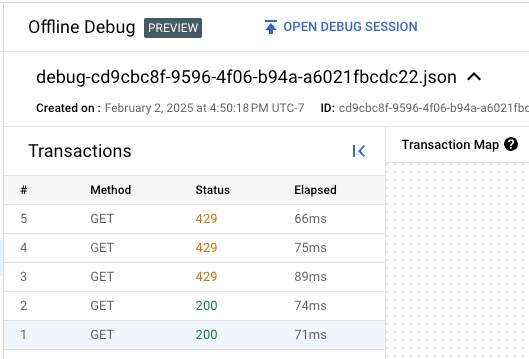
Hinweis:Wenn Sie eine Debugging-Sitzung in der Proxy-Editor-Ansicht Debugging herunterladen, hat der Name der Download-Datei das Format debug-{session ID}.json, wobei {session id} die ID der Debugging-Sitzung ist. Sie können die Datei jedoch bei Bedarf umbenennen.
Die Apigee-Benutzeroberfläche lädt die Daten der Debug-Datei und zeigt alle Transaktionen in der Liste im Bereich Transactions (Transaktionen) an.
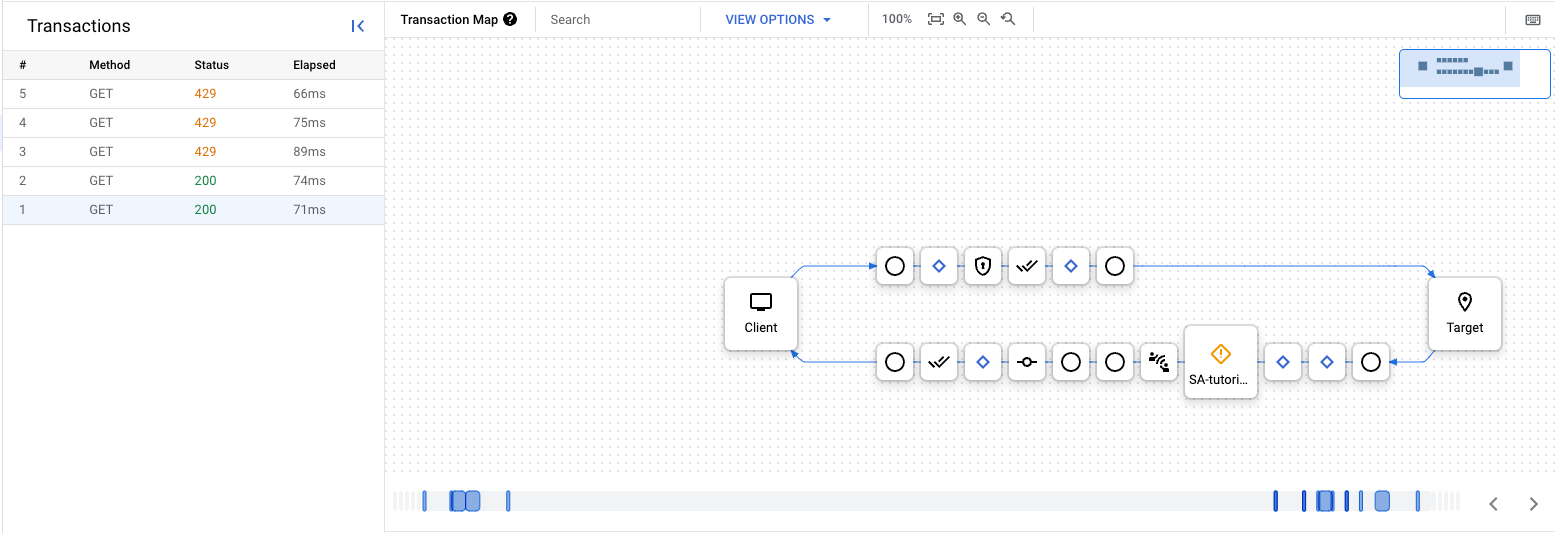
Klicken Sie im Bereich Transaktionen auf die Zeile für die Transaktion, um sie in der Transaktionskarte anzuzeigen.
Von hier aus können Sie die Debugging-Sitzung genau wie bei einer neu erstellten Debugging-Sitzung untersuchen. Weitere Informationen finden Sie unter
Debug-Sitzung erstellen.
Debug v1
So rufen Sie heruntergeladene Daten zur Fehlerbehebung per Offline-Debugging auf:
Klicken Sie auf die Schaltfläche Debug-Sitzung öffnen und wählen Sie eine zuvor heruntergeladeneOffline-Debugging-Sitzungsdatei im JSON-Format aus, um Daten in die Ansicht Offline-Debugging zu laden.
Hinweis:Wenn Sie eine Debugging-Sitzung in der Proxy-Editor-Ansicht Debugging herunterladen, hat der Name der Download-Datei das Format „debug-{session ID}.json“, wobei {session ID} die ID der Debugging-Sitzung ist. Sie können die Datei jedoch bei Bedarf umbenennen.
Die Apigee-Benutzeroberfläche lädt die Daten der Debug-Datei und zeigt eine neue Zeile für die Transaktion im linken Bereich an.
Klicken Sie im linken Bereich auf die Zeile für die Transaktion, um ein Gantt-Diagramm der Transaktion aufzurufen.
Von hier aus können Sie die Debugging-Sitzung genau wie in der Ansicht Debugging im neuen Proxy-Editor entdecken. Weitere Informationen finden Sie im Abschnitt "Gantt-Diagramm für eine Anfrage und Antwort ansehen".
Klassische UI
So rufen Sie heruntergeladene Daten zur Fehlerbehebung per Offline-Debugging auf:
Beachten Sie die folgenden Regionen der Ansicht Offline-Debugging:
Debug-Datei: Zeigt den Anfragetyp an. In diesem Bereich können Sie zwischen den Anfragen wechseln.
Ansichtsoptionen:Zeigt Konfigurationsoptionen an, wie unter Fehlerbehebung verwenden beschrieben.
Details der Debugging-Sitzung: Zeigt Details zur Fehlerbehebungssitzung an.
Transaktionszuordnung:Zeigt den Pfad der Anfrage über den API-Proxy an. Dieser Pfad wird als Transaktionszuordnung bezeichnet. Sie sehen, welche Richtlinien aufgefunden wurden und ob während der Ausführung dieser Richtlinien Fehler aufgetreten sind.
Phasendetails:Zeigt die Anfrageheader für die aktuell ausgewählte Anfrage an.
Beim Anzeigen von Debugging-Daten in der Apigee-Benutzeroberfläche können Sie verschiedene Optionen aktivieren, um beispielsweise deaktivierte Richtlinien oder Variablen und Attribute aufzurufen. Weitere Informationen finden Sie unter Fehlerbehebung mit dem Debugging-Tool.
Klicken Sie auf die Schaltfläche Datei auswählen im linken Bereich des Offline Debug-Tools und wählen Sie eine zuvor heruntergeladene Offline-Trace-Sitzungsdatei im JSON-Format aus, um Daten in die Ansicht Offline-Debugging zu laden.
Hinweis:Verwenden Sie nicht die Schaltfläche Datei auswählen im rechten Bereich, da diese keine JSON-Dateien akzeptiert.
Die Apigee-Benutzeroberfläche lädt die Daten der Debugging-Datei und zeigt sie an:
[[["Leicht verständlich","easyToUnderstand","thumb-up"],["Mein Problem wurde gelöst","solvedMyProblem","thumb-up"],["Sonstiges","otherUp","thumb-up"]],[["Schwer verständlich","hardToUnderstand","thumb-down"],["Informationen oder Beispielcode falsch","incorrectInformationOrSampleCode","thumb-down"],["Benötigte Informationen/Beispiele nicht gefunden","missingTheInformationSamplesINeed","thumb-down"],["Problem mit der Übersetzung","translationIssue","thumb-down"],["Sonstiges","otherDown","thumb-down"]],["Zuletzt aktualisiert: 2025-09-03 (UTC)."],[[["\u003cp\u003eThe Offline Debug tool in Apigee and Apigee hybrid allows users to view and analyze previously downloaded debug sessions.\u003c/p\u003e\n"],["\u003cp\u003eUsers can access the Offline Debug tool via the Google Cloud console (Debug v1 or v2) or the Classic UI, with similar navigation structures across platforms.\u003c/p\u003e\n"],["\u003cp\u003eTo load a debug session in the Offline Debug tool, users must select a downloaded JSON file (typically named \u003ccode\u003edebug-{session ID}.json\u003c/code\u003e) via the "Open Debug Session" or "Choose File" button.\u003c/p\u003e\n"],["\u003cp\u003eOnce a debug session is loaded, users can explore the transaction details, including the transaction map and phase details, to troubleshoot and analyze API proxy behavior.\u003c/p\u003e\n"],["\u003cp\u003eThe Offline debug tool allows for analysis and debugging to occur even when the debug session is not actively running.\u003c/p\u003e\n"]]],[],null,["# Using Offline Debug\n\n*This page\napplies to **Apigee** and **Apigee hybrid**.*\n\n\n*View [Apigee Edge](https://docs.apigee.com/api-platform/get-started/what-apigee-edge) documentation.*\n\nThe Offline Debug tool lets you view and analyze \"offline\" debug sessions that were\n[previously downloaded](/apigee/docs/api-platform/debug/trace#downloading-a-debug-session)\nin the **Debug** view in the Proxy Editor. A\nsaved debug session is essentially a \"recording\" of a debug session, and can be useful for cases\nwhere troubleshooting and further analysis is required. The UI for the Offline Debug tool is\nsimilar to the **Debug** view in the Proxy Editor.\n\nTo learn about the Debug Tool UI and on downloading debug\nsessions, see [Using Debug](/apigee/docs/api-platform/debug/trace).\n**Note:** The Debug Tool is available in the Google Cloud console, the Classic UI, and some debug actions can be performed using the API as described in the following tabs. The Google Cloud console options are Debug v2 (new) and Debug v1 (released [07/01/2022](/apigee/docs/api-platform/release-notes#July_01_2022)). You can switch between versions of the Debug Tool in the Google Cloud console and the Classic UI. \n\n### Cloud Console UI\n\n### Debug v2 (new)\n\nTo view downloaded debug data using Offline Debug:\n\n1. Sign in to the [Google Cloud console](https://console.cloud.google.com/apigee).\n2. Select **Develop \\\u003e Offline Debug**.\n\n The **Offline Debug** view displays:\n3. To load data into the **Offline Debug** view, click\n **Open Debug Session** , select a\n [previously downloaded](/apigee/docs/api-platform/debug/trace#download) offline debug session file in JSON format,\n and then click **Open**.\n\n **Note:** When you download a debug session in the Proxy Editor\n **Debug** view, the name of the download file has the form\n `debug-{session ID}.json`, where `{session id}`\n is the ID of the debug session; however, you can rename the file\n if you wish.\n\n The Apigee UI loads the debug file's data and displays all of\n the transactions in the list in the **Transactions** panel.\n4. Click the row for the transaction in the **Transactions** panel to display the transaction in the **Transaction Map** .\n\nFrom here, you can explore the debug session just as you would for\na newly-created debug session. See\n[Creating a debug session](/apigee/docs/api-platform/debug/trace#creating-a-debug-session) for more information.\n\n### Debug v1\n\nTo view downloaded debug data using Offline Debug:\n\n1. Sign in to the [Google Cloud console](https://console.cloud.google.com/apigee).\n2. Select **API Proxies** from the main view.\n3. Select **Develop \\\u003e Offline Debug**.\n\n The **Offline Debug** view displays:\n\n4. To load data into the **Offline Debug** view, click the\n **Open Debug Session** button\n and select a [previously downloaded](/apigee/docs/api-platform/debug/trace#download)\n offline debug session file in JSON format.\n\n **Note:** When you download a debug session in the Proxy Editor **Debug** view,\n the name of the download file has the form 'debug-{session ID}.json', where {session id}\n is the ID of the debug session. However, you can rename the file if you wish.\n\n The Apigee UI loads the debug file's data and displays a new row for the transaction\n in the left-hand panel.\n\n5. Click the row for the transaction in the left-hand panel to display a Gantt chart of the transaction in a Gantt chart.\n\nFrom here, you can explore the debug session just as you would in the\n[**Debug** view in the new\nProxy Editor](/apigee/docs/api-platform/debug/trace#new-proxy-editor). See the section \"Viewing the Gantt chart for a request and response.\"\n\n### Classic UI\n\nTo view downloaded debug data using Offline Debug:\n\n1. Sign in to the [Apigee UI](https://apigee.google.com).\n2. Select **API Proxies** from the main view.\n3. Select **Develop \\\u003e Offline Debug**.\n\n The **Offline Debug** view displays:\n\n Note the following regions of the **Offline Debug** view:\n - **Debug file:** Displays the request type. Use this area to navigate among the requests.\n - **View Options:** Displays configuration options, as described in [Using Debug](/apigee/docs/api-platform/debug/trace).\n - **Debug Session Details:** Displays details about the debug session.\n - **Transactions Map:** Shows the path of the request through the API proxy; this path is known as the *transaction map*; it shows which policies were encountered and indicates if any errors occurred during the execution of those policies.\n - **Phase Details:** Shows the request headers for the currently selected request.\n\n When viewing debug data in the Apigee UI, you can toggle various options such as whether to\n view policies that are disabled or variables and properties. For more information, see\n [Debugging with the debug tool](/apigee/docs/api-platform/debug/trace#debuggingwithtrace).\n4. To load data into the **Offline Debug** view, click the\n **Choose File** button in the left-hand pane of the Offline Debug tool\n and select a previously downloaded offline trace session file in JSON format.\n\n **Note:** Do *not* use the **Choose File** button in the right-hand pane,\n as it does not accept JSON files.\n\n The Apigee UI loads the debug file's data and displays it."]]