Im Cache-Dashboard zur Leistungsüberwachung können Sie den Wert des Antwort-Cache auf einen Blick sehen.
Mithilfe des Dashboards können Sie die Vorteile des Antwortcaches im Hinblick auf niedrigere Latenzzeiten und geringere Last auf dem Backend-Server visualisieren.
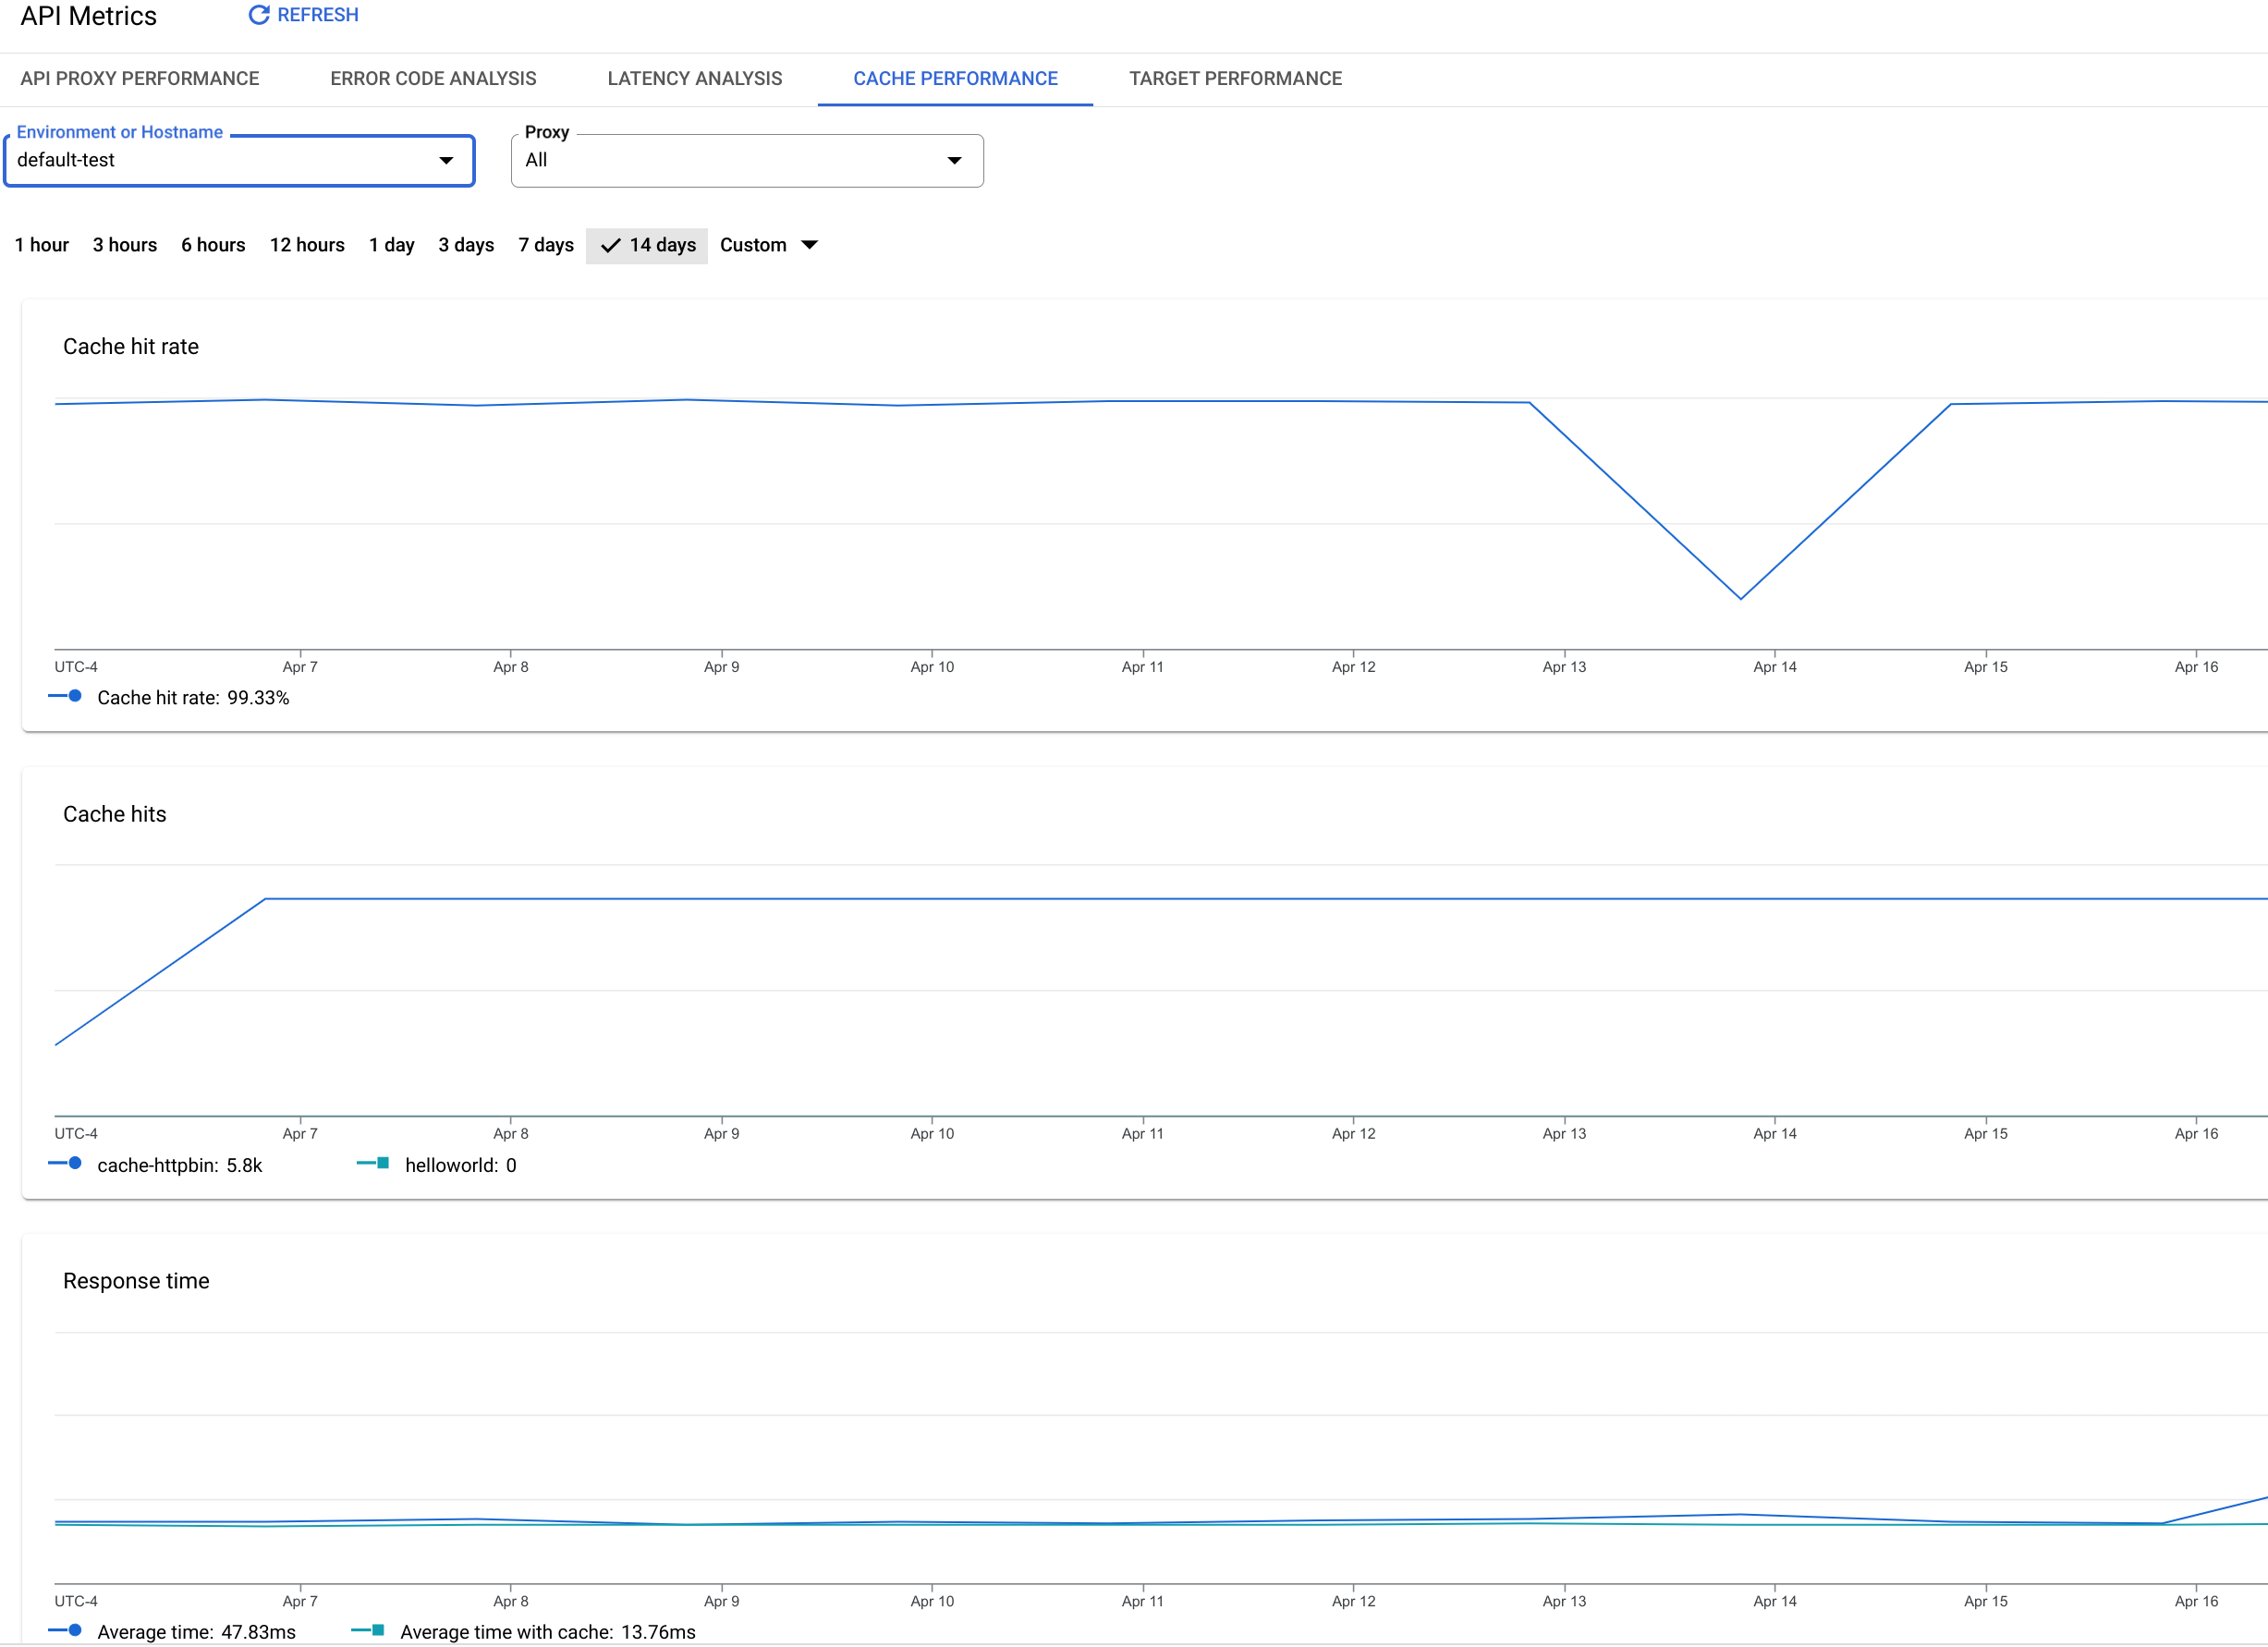
Das Cache Performance-Dashboard
So greifen Sie auf das Cache-Dashboard zur Leistungsüberwachung zu:
Rufen Sie in der Google Cloud Console die Seite Analysen > API-Messwerte > Cache-Leistung auf.
[[["Leicht verständlich","easyToUnderstand","thumb-up"],["Mein Problem wurde gelöst","solvedMyProblem","thumb-up"],["Sonstiges","otherUp","thumb-up"]],[["Schwer verständlich","hardToUnderstand","thumb-down"],["Informationen oder Beispielcode falsch","incorrectInformationOrSampleCode","thumb-down"],["Benötigte Informationen/Beispiele nicht gefunden","missingTheInformationSamplesINeed","thumb-down"],["Problem mit der Übersetzung","translationIssue","thumb-down"],["Sonstiges","otherDown","thumb-down"]],["Zuletzt aktualisiert: 2025-09-04 (UTC)."],[[["\u003cp\u003eThis page focuses on the Cache Performance dashboard within Apigee and Apigee hybrid.\u003c/p\u003e\n"],["\u003cp\u003eThe dashboard visualizes the effectiveness of the ResponseCache policy, but not LookupCache or PopulateCache policies.\u003c/p\u003e\n"],["\u003cp\u003eYou can access the Cache Performance dashboard through the Apigee UI in the Cloud console or the classic Apigee UI.\u003c/p\u003e\n"],["\u003cp\u003eThe dashboard measures metrics like average cache hit rate, cache hits by API proxy, and average time with and without the cache.\u003c/p\u003e\n"],["\u003cp\u003eData in the dashboard may take up to 10 minutes to appear after API calls, and performance ratios may be temporarily inaccurate with new data.\u003c/p\u003e\n"]]],[],null,["# Cache performance dashboard\n\n*This page\napplies to **Apigee** and **Apigee hybrid**.*\n\n\n*View [Apigee Edge](https://docs.apigee.com/api-platform/get-started/what-apigee-edge) documentation.*\n\nWhat does this dashboard tell me?\n---------------------------------\n\nThe Cache Performance dashboard collects data from the\n[ResponseCache policy](/apigee/docs/api-platform/reference/policies/response-cache-policy).\nThis dashboard does not collect data from the [LookupCache](/apigee/docs/api-platform/reference/policies/lookup-cache-policy)\nor [PopulateCache](/apigee/docs/api-platform/reference/policies/populate-cache-policy) policies.\n\nThe Cache Performance dashboard lets you see at a glance the value of the response cache.\nThe dashboard helps you visualize the benefit of the response cache in terms of lower latency and reduced\nload backend servers.\n\n\n| **Note:** **Data delay interval** \n| After API calls are made to proxies, it may take up to **10 minutes** for the data to appear in dashboards, custom reports, and management API calls.\n\n\u003cbr /\u003e\n\nThe Cache Performance dashboard\n-------------------------------\n\nTo access the Cache Performance dashboard:\n\nIn the Google Cloud console, go to the **Analytics \\\u003e API metrics \\\u003e Cache Performance** page.\n\n[Go to Cache Performance](https://console.cloud.google.com/apigee/analytics/cache-performance)\n\n\u003cbr /\u003e\n\nThe **Cache Performance** view is shown:\n\nWhat does this dashboard measure?\n---------------------------------\n\n| **Note:** The performance ratios may appear incorrect for the first few minutes for new data. This is because with a small number of data points, there can be a difference in the number of data points being compared to create the ratios. This inconsistency will resolve itself within a few minutes as it collects more data points. If the performance ratios still appear incorrect, refresh the page."]]