Das Dashboard "Anomalieereignisse" in der Apigee-UI ist Ihre primäre Informationsquelle zu erkannten API-Anomalien. Das Dashboard zeigt eine Liste der aktuellen Anomalien an.
Bevor Sie das Dashboard öffnen, müssen Ihnen die erforderlichen Rollen für AAPI Ops zugewiesen worden sein.
Hinweis: öffnen Sie die Apigee-Benutzeroberfläche in einem neuen Tab, wenn Sie die folgenden Schritte ausführen möchten.
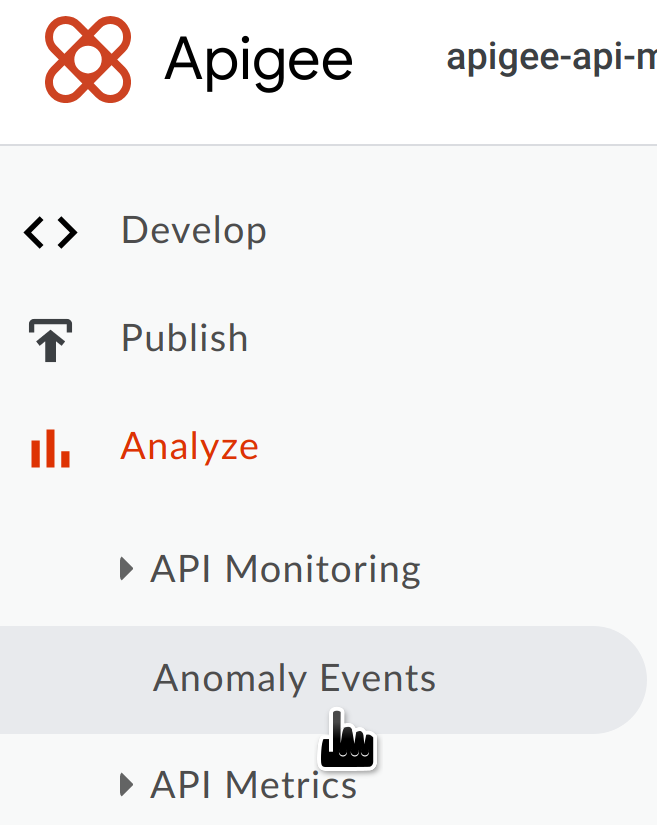
Wechseln Sie zu der zu überwachenden Organisation.
Wählen Sie im Navigationsbereich Analysieren > Anomalieereignisse aus.
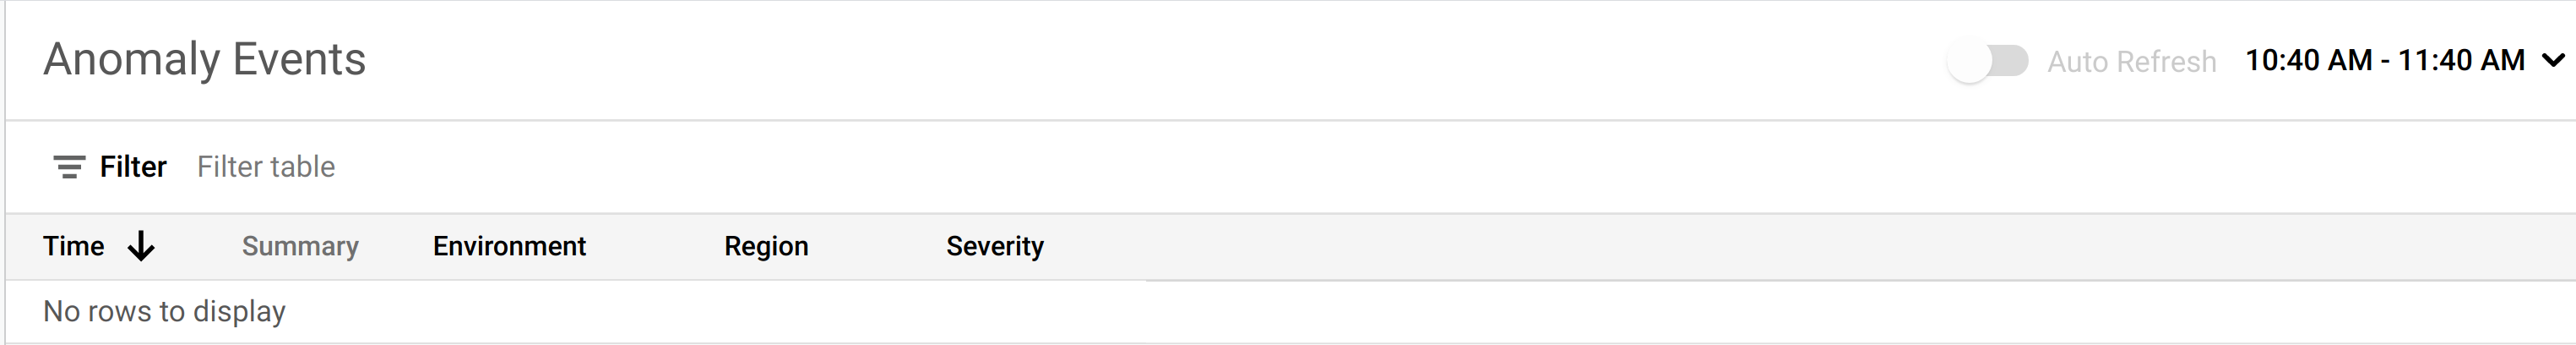
Das Dashboard für Anomalien wird angezeigt.
Standardmäßig werden im Dashboard Anomalien angezeigt, die in der letzten Stunde aufgetreten sind.
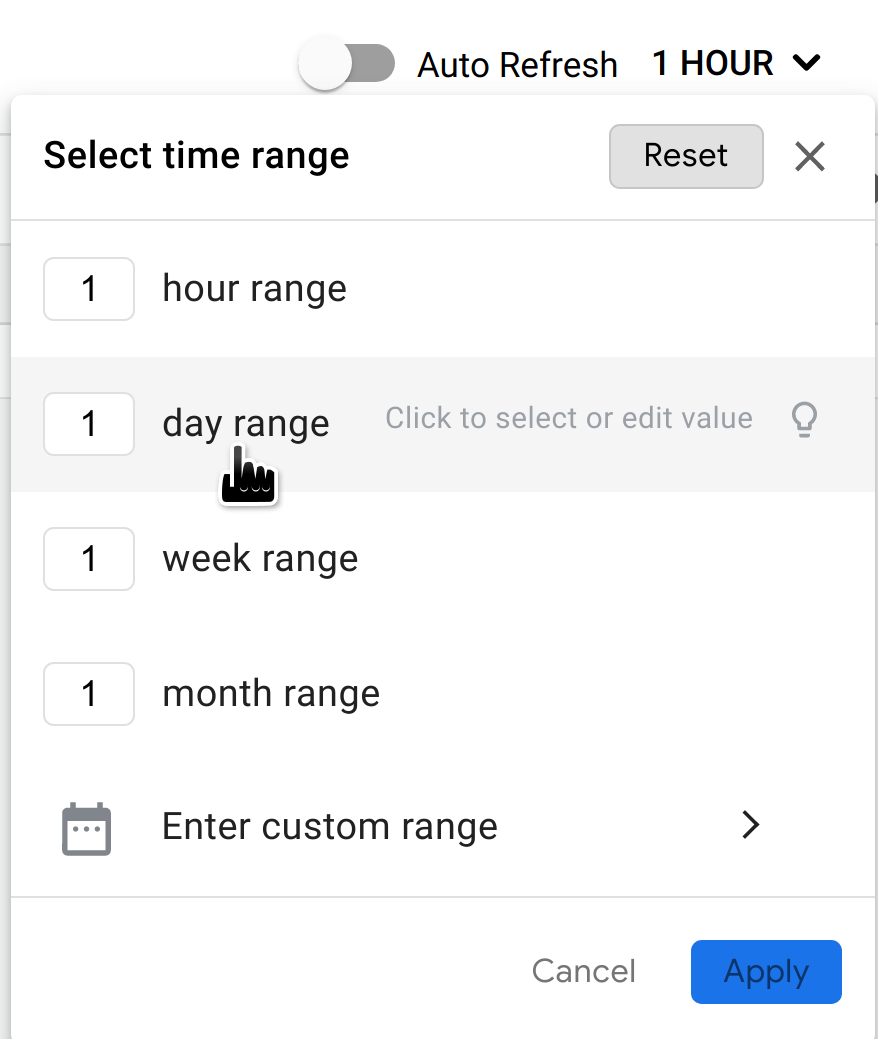
Wenn in diesem Zeitraum keine Anomalien festgestellt wurden, werden im Dashboard keine Zeilen angezeigt. In diesem Fall können Sie oben rechts im Dashboard im Menü "Zeitraum" einen größeren Zeitraum auswählen.
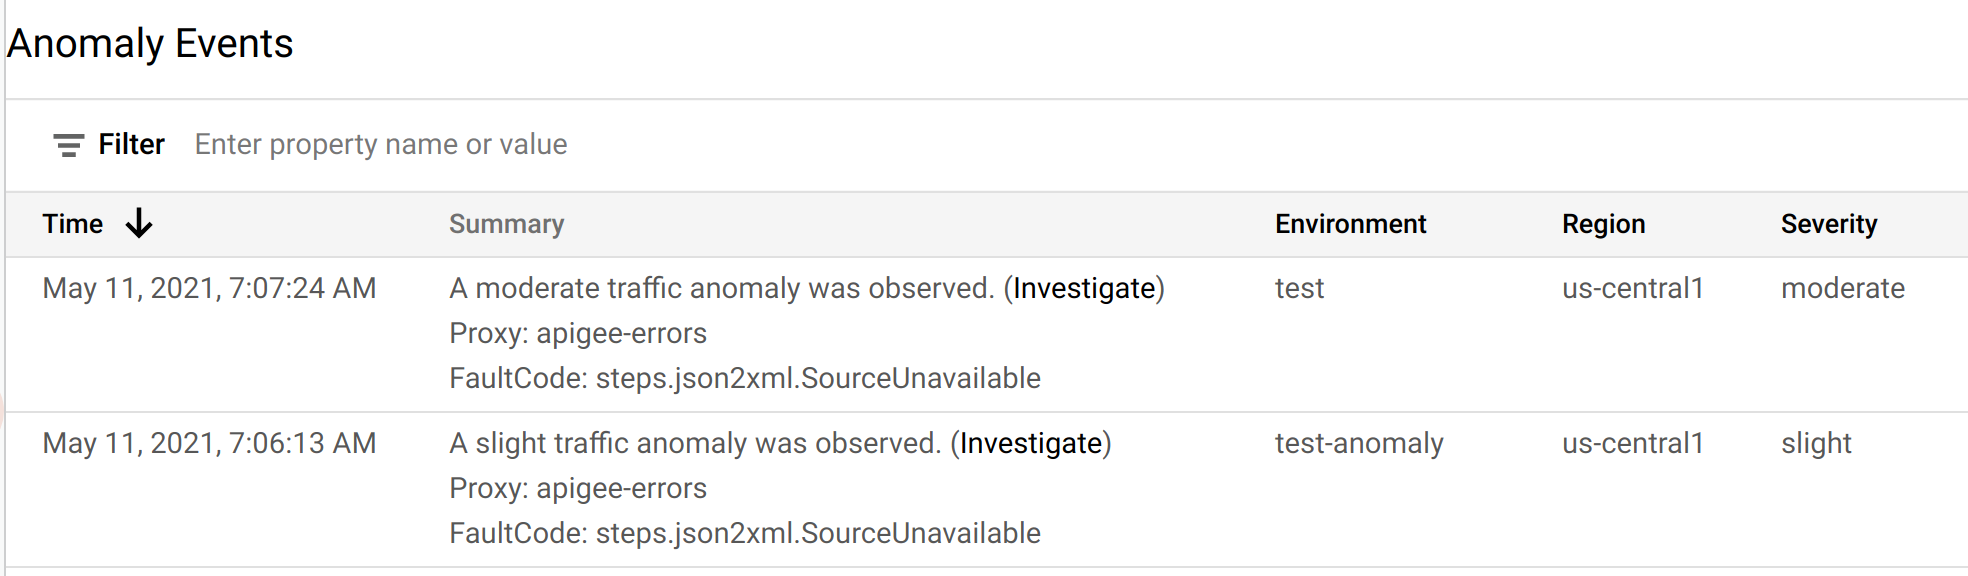
Wenn es in diesem Zeitraum Anomalien gibt, werden sie ähnlich wie die unten aufgeführten angezeigt.
Jede Zeile in der Tabelle entspricht einer erkannten Anomalie und zeigt die folgenden Informationen an:
Datum und Uhrzeit der Anomalie.
Eine kurze Zusammenfassung der Anomalie, einschließlich des Proxys, in dem sie aufgetreten ist, und des Fehlercodes, der sie ausgelöst hat.
Die Umgebung, in der die Anomalie aufgetreten ist.
Die Region, in der die Anomalie aufgetreten ist.
Der Schweregrad des Anomalieereignisses: leicht, moderat oder schwer. Der Schweregrad basiert auf einer statistischen Messung (p-Wert) dafür, wie unwahrscheinlich es ist, dass das Ereignis zufällig passiert (je unwahrscheinlicher das Ereignis, desto stärkerer Schweregrad).
Sie können eine Anomalie weiter untersuchen, um herauszufinden, welche Maßnahmen Sie ergreifen sollten.
Der beste Ort für die Untersuchung sind die API-Monitoring-Dashboards, auf denen verschiedene Diagramme aktueller API-Traffic-Daten angezeigt werden. Im nächsten Abschnitt, Anomalien untersuchen, erfahren Sie, wie das funktioniert.
[[["Leicht verständlich","easyToUnderstand","thumb-up"],["Mein Problem wurde gelöst","solvedMyProblem","thumb-up"],["Sonstiges","otherUp","thumb-up"]],[["Schwer verständlich","hardToUnderstand","thumb-down"],["Informationen oder Beispielcode falsch","incorrectInformationOrSampleCode","thumb-down"],["Benötigte Informationen/Beispiele nicht gefunden","missingTheInformationSamplesINeed","thumb-down"],["Problem mit der Übersetzung","translationIssue","thumb-down"],["Sonstiges","otherDown","thumb-down"]],["Zuletzt aktualisiert: 2025-09-04 (UTC)."],[[["\u003cp\u003eThis page covers anomaly detection in Apigee and Apigee hybrid, focusing on the Anomaly Events dashboard in the Apigee UI.\u003c/p\u003e\n"],["\u003cp\u003eTo view anomalies, users must be subscribed to AAPI Ops and have the \u003ccode\u003eroles/logging.viewer\u003c/code\u003e role, along with other required AAPI Ops roles.\u003c/p\u003e\n"],["\u003cp\u003eThe Anomaly Events dashboard displays recent API anomalies, including details such as the date, time, summary, environment, region, and severity.\u003c/p\u003e\n"],["\u003cp\u003eThe dashboard defaults to showing anomalies from the previous hour, but users can adjust the time range to view anomalies from a different period.\u003c/p\u003e\n"],["\u003cp\u003eDetected anomalies in the dashboard can be further investigated in the API Monitoring dashboards to determine appropriate actions.\u003c/p\u003e\n"]]],[],null,["# Using the Anomaly Events dashboard\n\n*This page\napplies to **Apigee** and **Apigee hybrid**.*\n\n\n*View [Apigee Edge](https://docs.apigee.com/api-platform/get-started/what-apigee-edge) documentation.*\n\n| **Important:** \"Anomaly Detection\" describes the Advanced API Operations Anomaly Detection functionality, which is available in the Classic Apigee UI. This functionality is comparable to the \"Operations Anomalies\" functionality in [Apigee UI in Cloud console](https://console.cloud.google.com/apigee). Both are available at this time. See [Operations Anomalies overview](/apigee/docs/api-platform/analytics/operations-anomalies-overview) for information on the Operations Anomalies functionality.\n\nThe Anomaly Events dashboard in the Apigee UI is your primary source of information about\ndetected API anomalies. The dashboard displays a list of recent anomalies.\n| **Notes:** To view anomalies in the dashboard, you must:\n|\n| - Be subscribed to AAPI Ops. [Contact Apigee](https://cloud.google.com/contact) to learn more.\n| - Be assigned the role `roles/logging.viewer`, in addition to the other [required roles for AAPI Ops](/apigee/docs/aapi-ops#required-roles-for-aapi-ops).\n\nBefore opening the dashboard, make sure you have been assigned the\n[required roles](/apigee/docs/aapi-ops#required-roles-for-aapi-ops)\nfor AAPI Ops.\n\nTo open the anomalies dashboard: \n\n### Apigee in Cloud Console\n\n1. In the Google Cloud console, go to the **Operations anomalies** page.\n\n [Go to Operations anomalies](https://console.cloud.google.com/apigee/analytics/operations-anomalies)\n2. [Switch to\n the organization](/apigee/docs/api-platform/get-started/switch-org) that you want to monitor.\n\nBy default, the dashboard shows anomalies that have occurred during the previous hour.\nIf no anomalies have been detected during that time period, no rows are\ndisplayed in the dashboard. In that case, you can select a larger time range from\nthe time range menu in the top right of the dashboard.\n\nEach row in the table corresponds to a detected anomaly,\nand displays the following information:\n\n- The date and time of the anomaly.\n- A brief summary of the anomaly, including the proxy in which it occurred and the fault code that triggered it.\n- The environment in which the anomaly occurred.\n- The region where the anomaly occurred.\n- The severity of the anomaly event: slight, moderate, or severe. Severity is based on a statistical measure (p-value) of how unlikely it would be for the event to occur by chance (the more unlikely the event, the greater its severity).\n\nYou can further investigate an anomaly to\ndetermine what actions, if any, you should take in response.\nThe best place to start your investigation is in the\nAPI Monitoring dashboards, where you can see various graphs of recent API traffic\ndata. The next section, [Investigating anomalies](/apigee/docs/aapi-ops/investigate-anomalies), describes how to do this.\n\n### Classic UI\n\n1. Sign in to [Apigee UI](https://apigee.google.com).\n\n **Note:** Open the Apigee UI in a new tab if you want to\n follow the steps below.\n2. [Switch to the organization](/apigee/docs/api-platform/get-started/switch-org) that you want to monitor.\n3. In the navigation pane, select **Analyze \\\u003e Anomaly Events** .\n\n\nThis displays the Anomaly Events dashboard.\n\nBy default, the dashboard shows anomalies that have occurred during the previous hour.\nIf no anomalies have been detected during that time period, no rows are\ndisplayed in the dashboard. In that case, you can select a larger time range from\nthe time range menu in the top right of the dashboard.\n\nIf there are anomalies in this time range, they are displayed similarly to the ones shown\nbelow.\n\nEach row in the table corresponds to a detected anomaly,\nand displays the following information:\n\n- The date and time of the anomaly.\n- A brief summary of the anomaly, including the proxy in which it occurred and the fault code that triggered it.\n- The environment in which the anomaly occurred.\n- The region where the anomaly occurred.\n- The severity of the anomaly event: slight, moderate, or severe. Severity is based on a statistical measure (p-value) of how unlikely it would be for the event to occur by chance (the more unlikely the event, the greater its severity).\n\nYou can further investigate an anomaly to\ndetermine what actions, if any, you should take in response.\nThe best place to start your investigation is in the\nAPI Monitoring dashboards, where you can see various graphs of recent API traffic\ndata. The next section, [Investigating anomalies](/apigee/docs/aapi-ops/investigate-anomalies), describes how to do this."]]