Tetap teratur dengan koleksi
Simpan dan kategorikan konten berdasarkan preferensi Anda.
Pemformatan nilai kustom memungkinkan Anda menentukan cara nilai dimensi, metrik, dan kolom kalkulasi ditampilkan dalam diagram tanpa mengirim kueri SQL tambahan ke database Anda. Pemformatan nilai kustom juga menyertakan opsi bagi pembuat dan editor laporan untuk menentukan format nilai menggunakan format gaya Google Spreadsheet.
Pemformatan nilai kustom dapat membantu dalam kasus penggunaan berikut:
Anda ingin dengan cepat mengubah cara nilai tanggal dan angka ditampilkan dalam diagram dan tooltip.
Anda perlu menampilkan nilai dengan cara tertentu yang tidak dapat dilakukan dengan mengubah jenis data.
Anda ingin memberikan konteks tambahan tentang nilai dalam diagram dan tooltip kepada pelihat laporan.
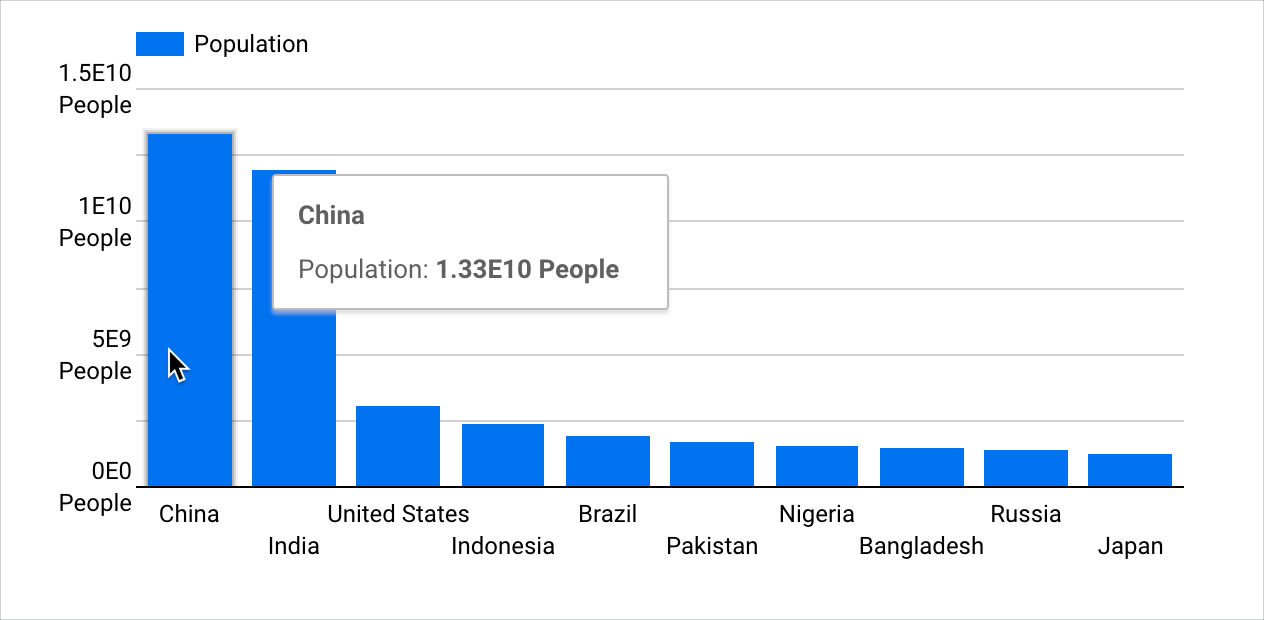
Misalnya, Anda dapat memilih untuk menampilkan nilai besar dengan eksponen dan menambahkan teks ke nilai tersebut. Diagram kolom berikut menampilkan Populasi yang dikelompokkan berdasarkan Negara. Anda dapat menggunakan format kustom untuk menampilkan nilai besar dengan eksponen dan menambahkan teks "Orang" untuk memberikan konteks tambahan bagi pelihat laporan.
Halaman ini menyediakan ringkasan format nilai kustom. Isinya adalah bagian-bagian berikut:
Di tab Penyiapan pada panel Properti, klik ikon jenis data kolom untuk membuka menu edit kolom.
Pilih opsi format nilai di menu drop-down Format Tampilan. Jika Anda ingin menentukan format kustom, pilih Format nilai kustom untuk membuka menu Format angka kustom.
Masukkan format nilai kustom menggunakan notasi gaya Google Spreadsheet di kolom teks Format angka kustom, atau pilih opsi format nilai.
Pratinjau format nilai akan ditampilkan di bawah kolom teks Format angka kustom.
Setelah memilih atau memasukkan format yang diinginkan, klik Terapkan.
Klik di luar menu edit kolom dan kembali ke properti Penyiapan diagram.
Ulangi langkah 3–7 untuk mengedit format nilai kustom kolom.
Menambahkan atau mengedit format nilai kustom spesifik per diagram untuk kolom kalkulasi
Untuk menambahkan format nilai kustom ke nilai kolom kalkulasi pada diagram, ikuti langkah-langkah berikut:
Di tab Penyiapan pada panel Properti, buat kolom kalkulasi. Atau, edit kolom kalkulasi yang ada dengan mengarahkan kursor ke nama kolom kalkulasi dan mengklik ikon jenis data kolom.
Jika Anda membuat kolom kalkulasi jenis dimensi baru, klik Terapkan setelah memasukkan ekspresi yang diinginkan. Editor kolom kalkulasi tidak akan mendeteksi jenis kolom ini hingga Anda mengklik Terapkan.
Pilih opsi format nilai di menu drop-down Format Tampilan. Jika Anda ingin menentukan format kustom, pilih Format nilai kustom untuk membuka menu Format angka kustom.
Masukkan format nilai kustom menggunakan notasi gaya Google Spreadsheet di kolom teks Format angka kustom, atau pilih opsi format nilai.
Pratinjau format nilai akan ditampilkan di bawah kolom teks Format angka kustom.
Setelah memilih atau memasukkan format yang diinginkan, klik Terapkan.
Klik di luar menu edit kolom kalkulasi dan kembali ke properti Penyiapan diagram.
Ulangi langkah 3–7 untuk mengedit format nilai kustom kolom kalkulasi.
Hal-hal yang perlu diketahui tentang format nilai kustom
Format kustom yang diterapkan ke nilai diagram akan dinonaktifkan saat setelan Nomor ringkas diaktifkan. Setelan Nomor ringkas tersedia saat opsi Tampilkan label data diaktifkan di tab Gaya pada panel Properti diagram.
Demikian pula, setelan Nomor ringkas akan dinonaktifkan jika format kustom diterapkan ke nilai diagram.
Format nilai spesifik per diagram hanya akan ada di diagram tempat format tersebut diterapkan. Anda tidak dapat langsung menggunakan kembali format nilai spesifik per diagram.
Namun, Anda dapat menyalin diagram yang menggunakan format nilai kustom. Salinan tersebut akan berisi format nilai kustom yang ditentukan dalam diagram aslinya.
Looker Studio tidak mendukung ekspresi bersyarat dalam pemformatan nilai kustom.
[[["Mudah dipahami","easyToUnderstand","thumb-up"],["Memecahkan masalah saya","solvedMyProblem","thumb-up"],["Lainnya","otherUp","thumb-up"]],[["Sulit dipahami","hardToUnderstand","thumb-down"],["Informasi atau kode contoh salah","incorrectInformationOrSampleCode","thumb-down"],["Informasi/contoh yang saya butuhkan tidak ada","missingTheInformationSamplesINeed","thumb-down"],["Masalah terjemahan","translationIssue","thumb-down"],["Lainnya","otherDown","thumb-down"]],["Terakhir diperbarui pada 2025-08-25 UTC."],[],[],null,["# Format fields in reports\n\nCustom value formatting lets you specify how dimension, metric, and calculated field values appear in charts without sending additional SQL queries to your database. Custom value formatting also includes the option for report creators and editors to specify a value format using [Google Sheets style formats](https://support.google.com/docs/answer/56470).\n| **Important:** Looker Studio does not support conditional expressions in custom value formatting.\n\nCustom value formatting can be helpful in these use cases:\n\n- You want to quickly change how dates and number values are displayed in charts and tooltips.\n- You need to display values in a specific way that won't be satisfied by changing the [data type](/looker/docs/studio/data-types).\n- You want to provide additional context to report viewers about values in charts and tooltips.\n\nFor example, you can choose to display large values as exponents and append text to the values. The following column chart displays **Population** grouped by **Country.** You can use custom formatting to display the large values as exponents with the text \"People\" appended to provide additional context to report viewers.\n\nThis page provides an overview of custom value formatting. It includes the following sections:\n\n- [Requirements](#requirements)\n- [Add or edit chart-specific custom value formatting](#add-or-edit-chart-specific-custom-value-formatting)\n- [Things to know about custom value formatting](#things-to-know-about-custom-value-formatting)\n- [Related resources](#related-resources)\n\n| **Important:** Custom formatting is chart-specific, and cannot be applied to field values across an entire report.\n\nRequirements\n------------\n\nIf you want to use custom value formatting for charts, these requirements must be met:\n\n- The [Field Editing in Reports](/looker/docs/studio/edit-fields-in-your-reports) setting must be enabled in the data source.\n- You must have edit rights to a report.\n- A dimension, metric, or calculated field must be a **Numeric** or **Date \\& Time** [data type](/looker/docs/studio/data-types).\n\nAdd or edit chart-specific custom value formatting\n--------------------------------------------------\n\nYou can apply custom value formatting to dimensions, metrics, or calculated fields.\n\n### Add or edit chart-specific custom value formatting for dimensions and metrics\n\nTo add value formatting to dimension or metric values on a chart, follow these steps:\n\n1. Create or [edit your report](/looker/docs/studio/edit-a-report).\n\n2. [Add a new chart](/looker/docs/studio/add-charts-and-controls-to-your-report) or select an existing chart.\n\n3. In the **Setup** tab of the **Properties** panel, click a field's data type icon to open the field's edit menu.\n\n4. Choose a value format option in the **Display Format** drop-down menu. If you'd like to specify a custom format, choose **Custom value format** to open the **Custom number format** menu.\n\n5. Enter a custom value format using [Google Sheets style notation](https://support.google.com/docs/answer/56470) in the **Custom number format** text field, or select a value format option.\n\n | **Important:** Looker Studio does not support conditional expressions in custom value formatting.\n\n A preview of the value format will be displayed under the **Custom number format** text field.\n6. Once you have selected or entered the desired format, click **Apply**.\n\n7. Click outside of the field's edit menu and return to the chart **Setup** properties.\n\nRepeat steps 3-7 to edit a field's custom value formatting.\n\n### Add or edit chart-specific custom value formatting for calculated fields\n\nTo add custom value formatting to calculated field values on a chart, follow these steps:\n\n1. Create or [edit your report](/looker/docs/studio/edit-a-report).\n\n2. [Add a new chart](/looker/docs/studio/add-charts-and-controls-to-your-report) or select an existing chart.\n\n3. In the **Setup** tab of the **Properties** panel, [create a calculated field](/looker/docs/studio/add-edit-and-troubleshoot-calculated-fields). Alternatively, edit an existing calculated field by hovering over the calculated field name and clicking field's data type icon.\n\n If you create a new dimension type calculated field, click **Apply** after you enter the desired expression. The calculated field editor will not detect the field type until you click **Apply,**\n4. Choose a value format option in the **Display Format** drop-down menu. If you'd like to specify a custom format, choose **Custom value format** to open the **Custom number format** menu.\n\n5. Enter a custom value format using [Google Sheets style notation](https://support.google.com/docs/answer/56470) in the **Custom number format** text field, or select a value format option.\n\n A preview of the value format will display under the **Custom number format** text field.\n6. Once you have selected or entered the desired format, click **Apply**.\n\n7. Click outside of the calculated field's edit menu and return to the chart **Setup** properties.\n\nRepeat steps 3-7 to edit a calculated field's custom value formatting.\n\nThings to know about custom value formatting\n--------------------------------------------\n\n- Custom formatting that is applied to chart values will be disabled when the **Compact numbers** setting is enabled. The **Compact numbers** setting is available when the **Show data labels** option is enabled on the **Style** tab of a chart's **Properties** panel.\n\n Similarly, the **Compact numbers** setting will be disabled if custom formatting is applied to chart values.\n- Chart-specific value formatting will only exist in the chart in which it is applied. You can't directly reuse chart-specific value formatting.\n\n However, you can copy a chart that uses custom value formatting. The copy will contain any custom value formatting defined in the original.\n- Looker Studio does not support conditional expressions in custom value formatting.\n\nRelated resources\n-----------------\n\n- [Data types](/looker/docs/studio/data-types)\n- [Edit fields](/looker/docs/studio/edit-fields-in-your-reports)\n- [About calculated fields](/looker/docs/studio/about-calculated-fields)\n- [Add, edit, and troubleshoot calculated fields](/looker/docs/studio/add-edit-and-troubleshoot-calculated-fields)"]]