Mit der benutzerdefinierten Wertformatierung können Sie festlegen, wie Werte für Dimensionen, Messwerte und berechnete Felder in Diagrammen dargestellt werden, ohne dass zusätzliche SQL-Abfragen an Ihre Datenbank gesendet werden müssen. Ersteller und Mitbearbeiter von Berichten haben außerdem die Möglichkeit, ein Wertformat über Google Sheets-Formatvorlagen anzugeben.
Die benutzerdefinierte Wertformatierung kann für folgende Anwendungsfälle hilfreich sein:
- Sie möchten schnell ändern, wie Datumsangaben und Zahlenwerte in Diagrammen und Kurzinfos angezeigt werden.
- Werte müssen auf eine bestimmte Art und Weise dargestellt werden und eine Änderung des Datentyps reicht dazu nicht aus.
- Sie möchten Betrachtern in Diagrammen und Kurzinfos zusätzlichen Kontext zu Werten zur Verfügung stellen.
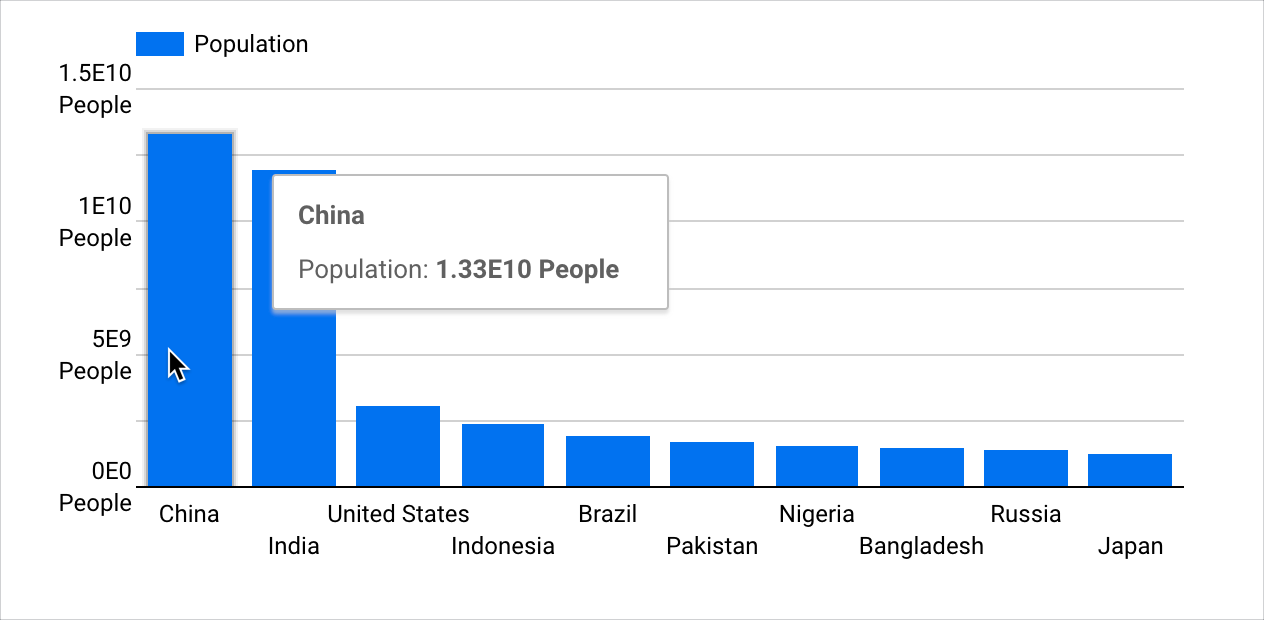
Sie können beispielsweise große Werte als Exponenten darstellen und Text an die Werte anhängen. Im folgenden Säulendiagramm werden Einwohnerzahlen nach Land gruppiert. Sie können die benutzerdefinierte Wertformatierung verwenden, um die großen Werte als Exponenten mit dem Zusatz „Menschen“ darzustellen und Betrachtern so zusätzlichen Kontext zu bieten.
Diese Seite bietet einen Überblick über die benutzerdefinierte Wertformatierung. Sie enthält die folgenden Abschnitte:
- Voraussetzungen
- Diagrammspezifische benutzerdefinierte Wertformatierung hinzufügen oder bearbeiten
- Informationen zur benutzerdefinierten Wertformatierung
- Weitere Informationen
Voraussetzungen
Wenn Sie die benutzerdefinierte Wertformatierung in Diagrammen verwenden möchten, müssen folgende Anforderungen erfüllt sein:
- In der Datenquelle muss die Einstellung Felder in Berichten bearbeiten aktiviert sein.
- Sie müssen Bearbeitungszugriff auf den jeweiligen Bericht haben.
- Die Dimension, der Messwert oder das berechnete Feld muss den Datentyp Numerisch oder Datum/Uhrzeit haben.
Diagrammspezifische benutzerdefinierte Wertformatierung hinzufügen oder bearbeiten
Sie können die benutzerdefinierte Wertformatierung für Dimensionen, Messwerte oder berechnete Felder verwenden.
Diagrammspezifische benutzerdefinierte Wertformatierung für Dimensionen und Messwerte hinzufügen oder bearbeiten
So wenden Sie die benutzerdefinierte Wertformatierung auf Dimensionen oder Messwerte in einem Diagramm an:
Erstellen Sie einen Bericht oder öffnen Sie einen vorhandenen Bericht, um ihn zu bearbeiten.
Fügen Sie ein neues Diagramm hinzu oder wählen Sie ein vorhandenes aus.
Klicken Sie im Eigenschaftenbereich auf dem Tab Einrichtung auf das Symbol für den Datentyp eines Felds, um das Bearbeitungsmenü des Felds zu öffnen.
Wählen Sie im Drop-down-Menü Darstellungsformat eine Option für das Wertformat aus. Wenn Sie ein benutzerdefiniertes Format festlegen möchten, wählen Sie Benutzerdefiniertes Wertformat aus, um das Menü Benutzerdefiniertes Zahlenformat zu öffnen.
Verwenden Sie eine Google Sheets-Formatschreibweise, um ein benutzerdefiniertes Wertformat in das Textfeld Benutzerdefiniertes Zahlenformat einzugeben, oder wählen Sie eine Option für das Wertformat aus.
Eine Vorschau des Wertformats wird unter dem Textfeld Benutzerdefiniertes Zahlenformat angezeigt.
Nachdem Sie das gewünschte Format ausgewählt oder eingegeben haben, klicken Sie auf Übernehmen.
Klicken Sie außerhalb des Bearbeitungsmenüs des Felds und kehren Sie zu den Attributen des Diagramms unter Einrichtung zurück.
Wiederholen Sie die Schritte 3 bis 7, um die benutzerdefinierte Wertformatierung eines Felds zu bearbeiten.
Diagrammspezifische benutzerdefinierte Wertformatierung für berechnete Felder hinzufügen oder bearbeiten
Wenn Sie die benutzerdefinierte Wertformatierung für berechnete Felder in einem Diagramm verwenden möchten, gehen Sie so vor:
Erstellen Sie einen Bericht oder öffnen Sie einen vorhandenen Bericht, um ihn zu bearbeiten.
Fügen Sie ein neues Diagramm hinzu oder wählen Sie ein vorhandenes aus.
Erstellen Sie im Bereich Attribute auf dem Tab Einrichtung ein berechnetes Feld. Wenn Sie stattdessen ein vorhandenes berechnetes Feld bearbeiten möchten, bewegen Sie den Mauszeiger auf den Namen des berechneten Felds und klicken Sie auf das Symbol für den Datentyp.
Wenn Sie ein neues berechnetes Feld vom Typ „Dimension“ erstellen, klicken Sie nach der Eingabe des gewünschten Ausdrucks auf Übernehmen. Der Editor für berechnete Felder erkennt den Feldtyp erst,wenn Sie auf Übernehmen klicken.
Wählen Sie im Drop-down-Menü Darstellungsformat eine Option für das Wertformat aus. Wenn Sie ein benutzerdefiniertes Format festlegen möchten, wählen Sie Benutzerdefiniertes Wertformat aus, um das Menü Benutzerdefiniertes Zahlenformat zu öffnen.
Verwenden Sie eine Google Sheets-Formatschreibweise, um ein benutzerdefiniertes Wertformat in das Textfeld Benutzerdefiniertes Zahlenformat einzugeben, oder wählen Sie eine Option für das Wertformat aus.
Eine Vorschau des Wertformats wird unter dem Textfeld Benutzerdefiniertes Zahlenformat angezeigt.
Nachdem Sie das gewünschte Format ausgewählt oder eingegeben haben, klicken Sie auf Übernehmen.
Klicken Sie außerhalb des Bearbeitungsmenüs des berechneten Felds und kehren Sie zu den Diagrammattributen unter Einrichtung zurück.
Wiederholen Sie die Schritte 3 bis 7, um die benutzerdefinierte Wertformatierung eines berechneten Felds zu bearbeiten.
Informationen zur benutzerdefinierten Wertformatierung
Wenn Sie die Einstellung Kompakte Zahlen aktivieren, wird die benutzerdefinierte Formatierung, die auf Diagrammwerte angewendet wird, automatisch deaktiviert. Die Einstellung Kompakte Zahlen ist verfügbar, wenn im Bereich Attribute auf dem Tab Stil eines Diagramms die Option Datenlabels anzeigen aktiviert ist.
Die Einstellung Kompakte Zahlen wird deaktiviert, wenn eine benutzerdefinierte Formatierung auf Diagrammwerte angewendet wird.
Die diagrammspezifische Wertformatierung ist nur in dem Diagramm verfügbar, auf das sie angewendet wurde. Diagrammspezifische Wertformatierungen können nicht direkt wiederverwendet werden.
Es ist jedoch möglich, ein Diagramm mit benutzerdefinierter Wertformatierung zu kopieren. Die Kopie enthält alle benutzerdefinierten Wertformate, die im Original festgelegt wurden.
In Looker Studio werden keine bedingten Ausdrücke bei der Formatierung benutzerdefinierter Werte unterstützt.
Weitere Informationen
- Datentypen
- Felder bearbeiten
- Berechnete Felder
- Berechnete Felder hinzufügen, bearbeiten und Fehler beheben