Apigee hybrid collects operations metrics that you can use to
monitor the health of hybrid services, to set up alerts, and
so on. Apigee uses the industry-standard Prometheus add-on for metrics collection. Once
collected, hybrid sends the metrics data to Cloud Operations, at which point you
can use the Cloud Operations console for viewing, searching, and
analyzing metrics and managing alerts.
The following diagram shows the metrics collection process:
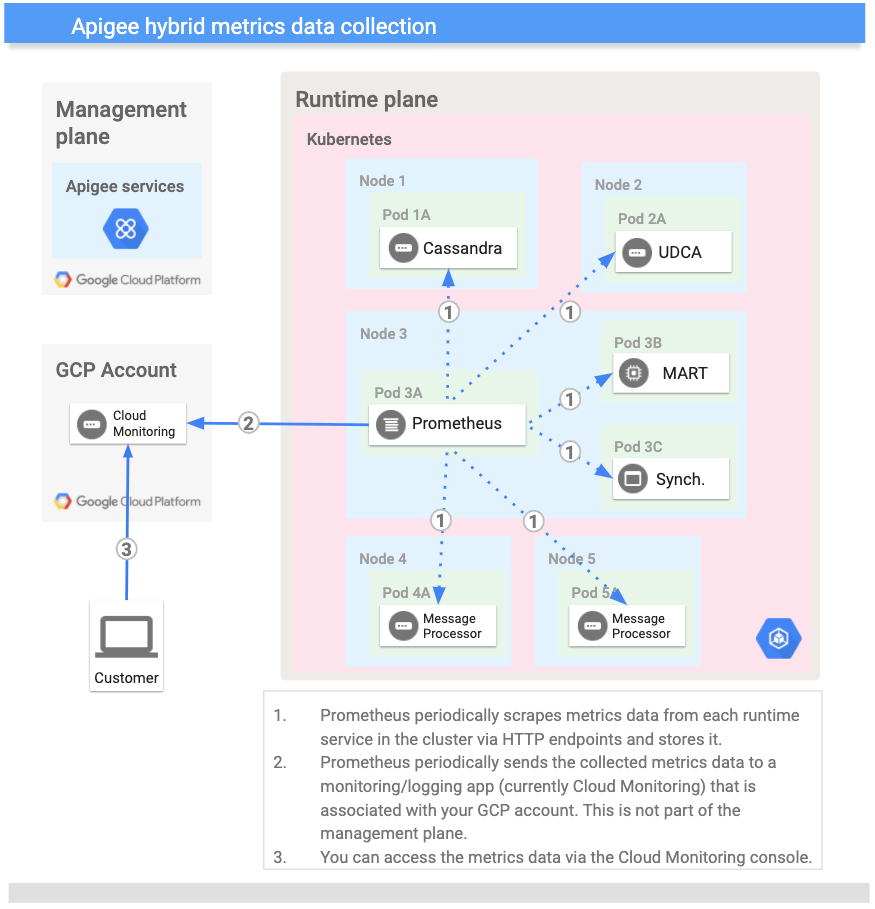
As you can see in this diagram, there is one Prometheus server
running per cluster, and it can run on any pod in the cluster.
Prometheus scrapes application metrics data from all hybrid
services and sends the metrics data to Cloud Operations. You can access
metrics data through the Cloud Operations console.
For a list of metrics you can use to analyze proxy traffic, see
Available metrics.
About metrics
Application metrics data is made available on a port as an
internal Kubernetes service. Data collected by this service is
scraped by the hybrid metrics collector service. You can use
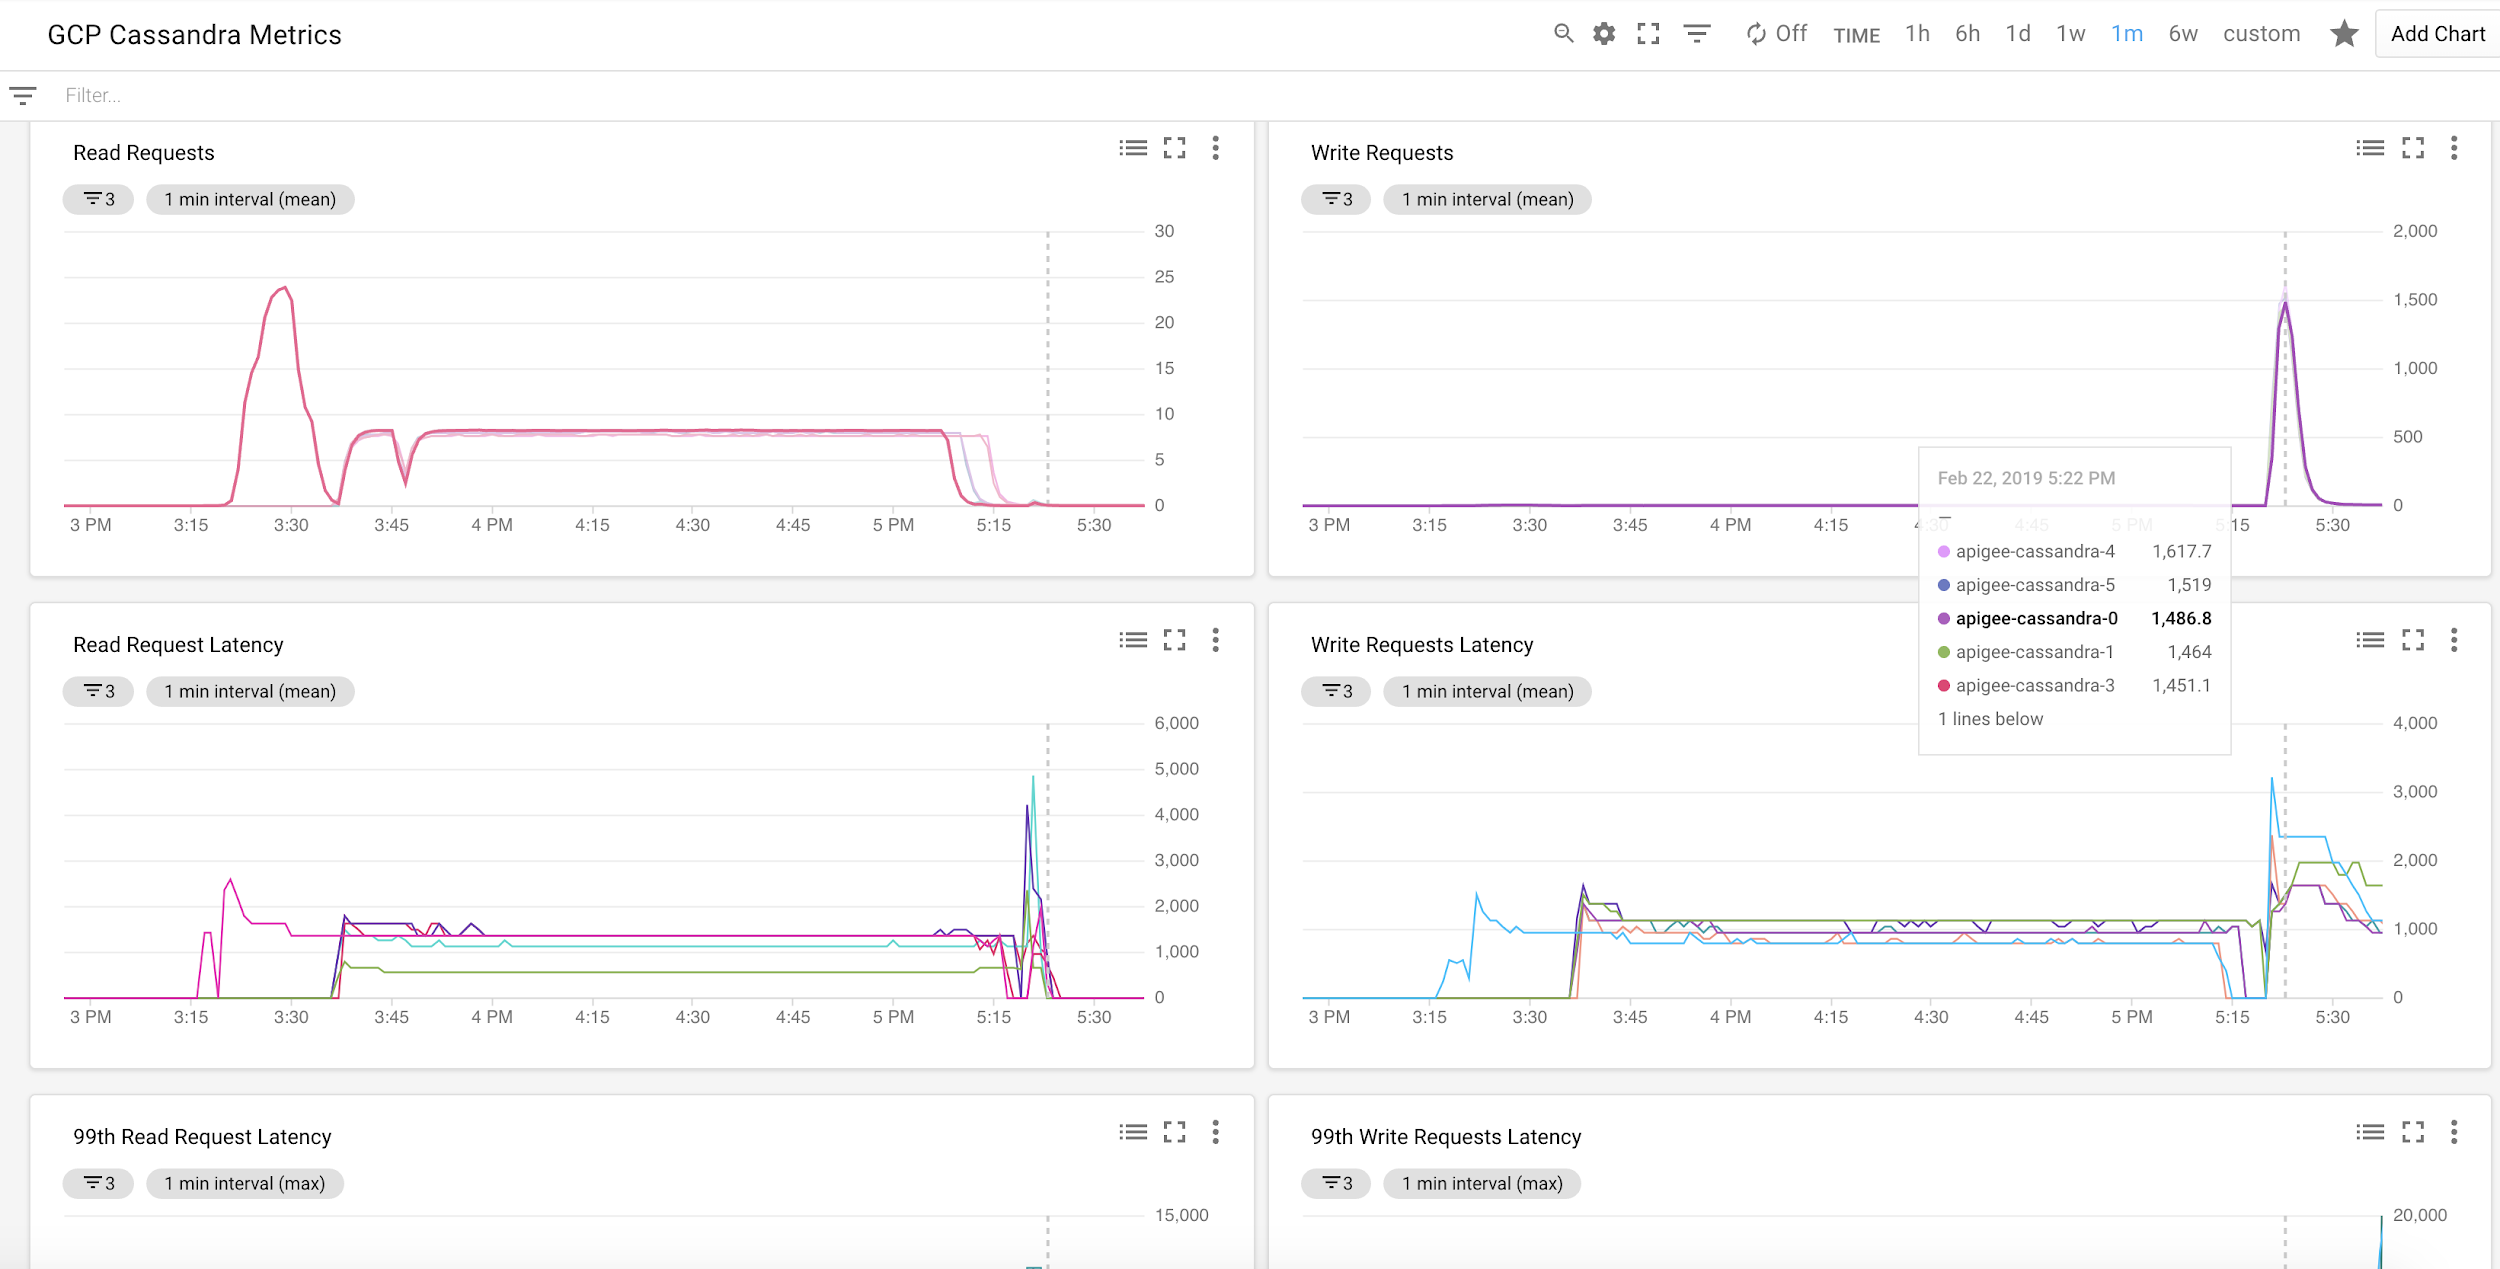
the Monitoring Metrics Explorer to select metrics you want to view, such as:
read request count
read request latency
write request count
write request latency
For example, you can create a dashboard in Cloud Operations to show
your metrics:
[[["Easy to understand","easyToUnderstand","thumb-up"],["Solved my problem","solvedMyProblem","thumb-up"],["Other","otherUp","thumb-up"]],[["Hard to understand","hardToUnderstand","thumb-down"],["Incorrect information or sample code","incorrectInformationOrSampleCode","thumb-down"],["Missing the information/samples I need","missingTheInformationSamplesINeed","thumb-down"],["Other","otherDown","thumb-down"]],["Last updated 2025-08-29 UTC."],[[["\u003cp\u003eApigee hybrid uses Prometheus to collect operational metrics for monitoring hybrid service health and setting up alerts.\u003c/p\u003e\n"],["\u003cp\u003eMetrics data is sent from the Prometheus server, which runs per cluster, to Cloud Operations, where it can be viewed, searched, and analyzed.\u003c/p\u003e\n"],["\u003cp\u003eMetrics collection is enabled by default, but can be disabled, with the ability to access metrics data through the Cloud Operations console.\u003c/p\u003e\n"],["\u003cp\u003eThe Monitoring Metrics Explorer allows users to select and view specific metrics like request counts and latency, facilitating the creation of custom dashboards.\u003c/p\u003e\n"],["\u003cp\u003eThe current version of this Apigee Hybrid documentation is 1.10, with further information available on supported versions.\u003c/p\u003e\n"]]],[],null,["# Metrics collection overview\n\n| You are currently viewing version 1.10 of the Apigee hybrid documentation. **This version is end of life.** You should upgrade to a newer version. For more information, see [Supported versions](/apigee/docs/hybrid/supported-platforms#supported-versions).\n\nApigee hybrid collects operations metrics that you can use to\nmonitor the health of hybrid services, to set up alerts, and\nso on. Apigee uses the industry-standard [Prometheus](https://github.com/kubernetes/kops/tree/master/addons/prometheus-operator) add-on for metrics collection. Once\ncollected, hybrid sends the metrics data to Cloud Operations, at which point you\ncan use the Cloud Operations console for viewing, searching, and\nanalyzing metrics and managing alerts.\n\nThe following diagram shows the metrics collection process:\n\nAs you can see in this diagram, there is one Prometheus server\nrunning per cluster, and it can run on any pod in the cluster.\nPrometheus scrapes application metrics data from all hybrid\nservices and sends the metrics data to Cloud Operations. You can access\nmetrics data through the Cloud Operations console.\n\nMetrics collection is enabled by default. To disable it, see\n[Configure metrics collection](/apigee/docs/hybrid/v1.10/metrics-enable).\n\nFor a list of metrics you can use to analyze proxy traffic, see\n[Available metrics](/apigee/docs/hybrid/v1.10/metrics-view#available_metrics).\n\nAbout metrics\n-------------\n\nApplication metrics data is made available on a port as an\ninternal Kubernetes service. Data collected by this service is\nscraped by the hybrid metrics collector service. You can use\nthe [Monitoring Metrics Explorer](https://console.cloud.google.com/monitoring/metrics-explorer) to select metrics you want to view, such as:\n\n- read request count\n- read request latency\n- write request count\n- write request latency\n\nFor example, you can create a dashboard in Cloud Operations to show\nyour metrics:"]]