Apigee Hybrid stellt Trace-, Analyse- und Bereitstellungsstatusdaten zur Verfügung. Diese Daten werden von einem Datenerhebungs-Pod erhoben und an die Verwaltungsebene gesendet. So können Sie die Daten anzeigen und analysieren sowie Monitoring und Benachrichtigungen einrichten.
Über die Daten
Alle MP-Dienste (Message Processor) im Hybrid streamen Trace- (falls initiiert), Analyse- und Deploymentstatusdaten über TCP an einen Datenerhebungs-Pod im Cluster. Der Datenerhebungs-Pod speichert die gestreamten Daten über einen fluentd-Dienst im Dateisystem des Pods.
Der UDCA (Universal Data Collection Agent) extrahiert die gespeicherten Daten regelmäßig und sendet sie auf der Verwaltungsebene an den UAP-Dienst (Unified Analytics Platform). Der UAP verarbeitet die eingehenden Analyse- und Bereitstellungsstatusdaten und stellt sie Ihnen über die Hybrid-Benutzeroberfläche oder die Apigee APIs zur Verfügung.
Apigee Hybrid implementiert den Datenerhebungs-Pod als ReplicaSet mit mindestens zwei Replikaten.
Die folgende Abbildung demonstriert die Erhebung der Trace-, Analyse- und Deploymentstatusdaten:
Die Trace-, Analyse- und Deploymentstatusdaten werden nicht am selben Ort gespeichert und nicht auf dieselbe Art wie Logging- und Messwertdaten abgerufen:
Logging- und Messwertdaten werden in Ihrem GCP-Projekt gespeichert und über ein Tool wie Stackdriver oder einem anderen Tool Ihrer Wahl aufgerufen.
Debugging-, Analyse- und Bereitstellungsstatusdaten hingegen werden auf der Hybridverwaltungsebene gespeichert und Sie können über Apigee-Dienste wie die Hybrid-UI oder Apigee-APIs darauf zugreifen.
Folgende Tabelle fasst die vom Datenerhebungs-Pod erfassten Daten zusammen:
Datentyp
Dataset-Name
Beschreibung
Aktualisierungsrate
APIs
Analysen
api
API-Nutzungsdaten, einschließlich Transaktionen pro Sekunde, Cache-Nutzung, Fehler, Latenzen, Anfrage-/Antwortgrößen und Trafficzahlen.
Debuggen Sie Sitzungsdaten für API-Proxys. Dazu gehören die Anfrage-/Antwortparameter sowie die Transformationen, die während der Richtlinienausführung angewendet werden.
Aufgrund der Größe werden Trace-Daten im Gegensatz zu Analyse- und Deploymentstatusdaten nicht immer erhoben. Trace-Daten werden dann erhoben, wenn Sie eine Debug-Sitzung starten.
In diesem Abschnitt wird beschrieben, wie Sie die Trace-, Analyse- und Bereitstellungsstatusdaten in der Apigee-Hybrid-Benutzeroberfläche ansehen.
Fehlerbehebung
Auf Debug-Daten für Hybriddienste kann auf dieselbe Weise zugegriffen werden wie auf Edge-Trace-Daten. Es gibt aber einige Unterschiede, z. B. eine erweiterte Filterunterstützung. Weitere Informationen finden Sie unter Fehlerbehebung.
Analysen
Analytics-Daten für Hybriddienste sind auf dieselbe Weise zugänglich wie Edge-Analysedaten. Weitere Informationen finden Sie unter Verwendung der Analyse-Dashboards in der Edge-Dokumentation.
Zum Festlegen, wie und wo Trace-, Analyse- und Deploymentstatusdaten im Datenerhebungs-Pod erhoben werden, konfigurieren Sie den UDCA über die Konfigurationsattribute. Die UDCA-Attribute umfassen allgemeine Attribute und auch Dataset-spezifische Attribute.
[[["Leicht verständlich","easyToUnderstand","thumb-up"],["Mein Problem wurde gelöst","solvedMyProblem","thumb-up"],["Sonstiges","otherUp","thumb-up"]],[["Schwer verständlich","hardToUnderstand","thumb-down"],["Informationen oder Beispielcode falsch","incorrectInformationOrSampleCode","thumb-down"],["Benötigte Informationen/Beispiele nicht gefunden","missingTheInformationSamplesINeed","thumb-down"],["Problem mit der Übersetzung","translationIssue","thumb-down"],["Sonstiges","otherDown","thumb-down"]],["Zuletzt aktualisiert: 2025-08-28 (UTC)."],[[["\u003cp\u003eThis documentation version (1.1) for Apigee hybrid is end-of-life and users are advised to upgrade to a newer version.\u003c/p\u003e\n"],["\u003cp\u003eApigee hybrid collects trace, analytics, and deployment status data via a data collection pod, which streams the information from Message Processor services.\u003c/p\u003e\n"],["\u003cp\u003eThe collected data is processed by the UAP (Unified Analytics Platform) and is made accessible through the hybrid UI or Apigee APIs.\u003c/p\u003e\n"],["\u003cp\u003eDebug, analytics, and deployment status data are stored in the hybrid management plane, while logging and metrics data are stored in the user's GCP project.\u003c/p\u003e\n"],["\u003cp\u003eThe UDCA (Universal Data Collection Agent) service is configurable, allowing users to customize aspects such as polling intervals and the number of replicas for the data collection process.\u003c/p\u003e\n"]]],[],null,["# Debug, analytics, and deployment status data collection\n\n| You are currently viewing version 1.1 of the Apigee hybrid documentation. **This version is end of life.** You should upgrade to a newer version. For more information, see [Supported versions](/apigee/docs/hybrid/supported-platforms#supported-versions).\n\nApigee hybrid makes trace, analytics, and deployment status data available to you. This data is\ncollected by a data collection pod which sends it to the management plane so that you can view and\nanalyze it and set up monitoring and alerts.\n\nAbout the data\n--------------\n\n
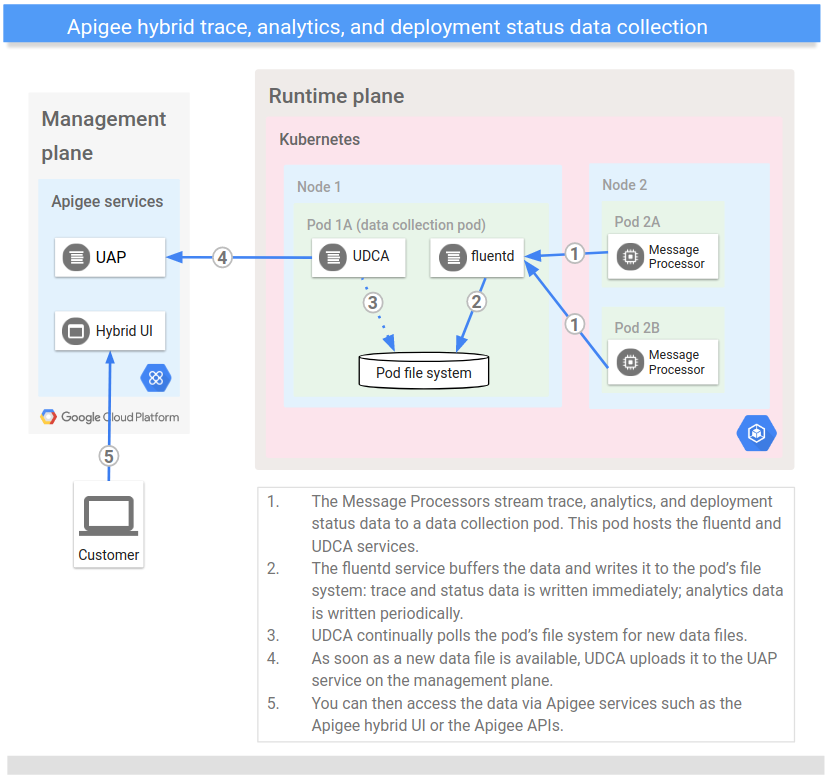
All Message Processor (MP) services in hybrid stream trace (when initiated), analytics,\nand deployment status data via\nTCP to a data collection pod in the cluster. The data collection pod stores the streamed data on the\npod's file system via a fluentd service.\n\nThe UDCA (Universal Data Collection Agent) periodically extracts the stored data and sends it to\nthe UAP (Unified Analytics Platform) service in the management plane. The UAP processes the incoming\nanalytics and deployment status data and makes it available to you via the hybrid UI or the\n[Apigee APIs](/apigee/docs/reference/apis/apigee/rest).\n\nApigee hybrid implements the data collection pod as a [ReplicaSet](https://kubernetes.io/docs/concepts/workloads/controllers/replicaset/) with a minimum of two\nreplicas.\n\nThe following image shows the trace, analytics, and deployment status data collection process:\n\nNote that the trace, analytics, and deployment status data is not stored in the\nsame location or accessed in the same way as the logging and metrics data:\n\n- *Logging and metrics data* are stored on your GCP Project and accessed via a tool such as Stackdriver or whatever you choose to use.\n- *Debug, analytics and deployment status data* , on the other hand, is stored in the hybrid management plane and you access it via Apigee services such as the hybrid UI or [Apigee APIs](/apigee/docs/reference/apis/apigee/rest).\n\nThe following table summarizes the data collected by the data collection pod:\n\n| **TIP:** The *dataset name* is the name by which this type of data is referred to in the UDCA configuration properties. For example, analytics data is configured with the dataset name `api`. As a result, the configuration property that sets the location of the analytics data files is called **api**`DataSubDir`.\n|\n| You can access this data through the Apigee hybrid UI or [Apigee APIs](/apigee/docs/reference/apis/apigee/rest) on the management\n| plane.\n\nView the data in the hybrid UI\n------------------------------\n\nThis section describes how to view the trace, analytics, and deployment status data in the Apigee\nhybrid UI.\n\n### Debug\n\nDebug data for hybrid services is accessible in the same way as Edge trace data, with some\ndifferences such as increased filter support. For more\ninformation, see [Debug overview](/apigee/docs/hybrid/v1.1/trace).\n\n### Analytics\n\nAnalytics data for hybrid services is accessible in the same way\nas Edge analytics data. For more information, see\n[Using the analytics dashboards](/apigee/docs/api-platform/analytics/using-analytics-dashboards) in\nthe Edge documentation.\n\n### Proxy deployment status\n\nFor information on viewing deployment status, see\n[View deployment status](/apigee/docs/hybrid/v1.1/ui-deploy-overview#view-deployment-status).\n\nConfigure the data collection\n-----------------------------\n\nTo set how and where trace, analytics, and deployment status data is\ncollected on the data collection pod, you configure the UDCA\nservice via its configuration properties. The UDCA properties\ninclude properties that are general to the UDCA as well as\nproperties that are specific to each dataset.\n\n**To configure the UDCA:**\n\n1. Open the `overrides.yaml` file for editing on your Kubernetes administration machine, as described in [Manage runtime plane components](/apigee/docs/hybrid/v1.3/customize-services).\n2. Set the values of the UDCA configuration settings. For the UDCA, you can set custom values for properties such as:\n - Polling interval\n - Number of replicas (min and max)\n - Target CPU percentage (that triggers additional replicas)\n\n For a complete list of UDCA properties that you can customize,\n see [`udca`](/apigee/docs/hybrid/v1.1/config-prop-ref#udca).\n3. Save your changes to the overrides.yaml file.\n4. Apply your changes to your cluster by executing the `apigeectl apply` command, as the following example shows: \n\n ```\n apigeectl apply -f my-overrides.yaml -c udca\n ```\n | **TIP** : To see the default configuration properties, the UDCA service (under `udca:`) in the [Configuration property reference](/apigee/docs/hybrid/v1.3/config-prop-ref).\n\n For more information about the `apply` command, see\n [Apply hybrid to your cluster](/apigee/docs/hybrid/v1.1/cli-reference#apply)."]]