本页面适用于 Apigee 和 Apigee Hybrid。
查看 Apigee Edge 文档。

利用离线调试工具,您可以在代理编辑器的调试视图中查看并分析之前下载的“离线”调试会话。已保存的调试会话实质上是调试会话的“记录”,在需要进行问题排查和进一步分析的情况下非常有用。离线调试工具的界面类似于代理编辑器中的调试视图。
如需了解调试工具界面以及如何下载调试会话,请参阅使用调试。
Cloud 控制台界面
调试 v2(新)
如需使用离线调试查看下载的调试数据,请执行以下操作:
- 登录Google Cloud 控制台。
选择开发 > 离线调试。
此时将显示离线调试视图:
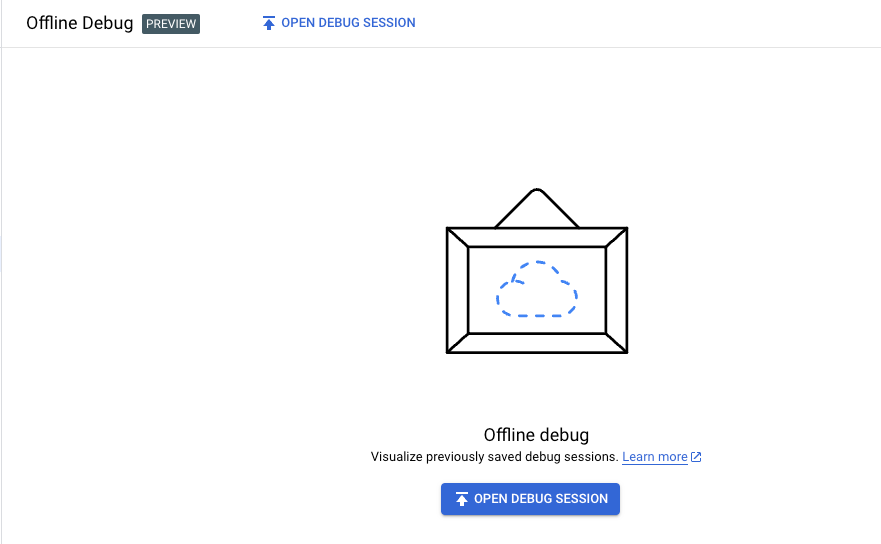
如需将数据加载到离线调试视图中,请点击打开调试会话,选择先前下载的 JSON 格式的离线调试会话文件,然后点击打开。
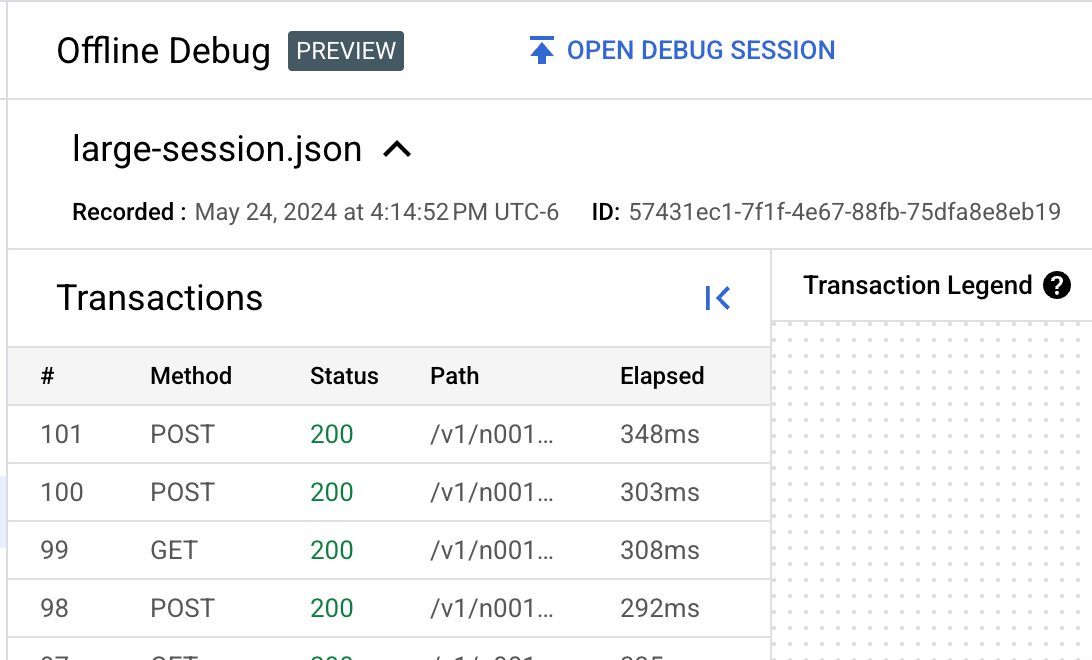
注意:在代理编辑器调试视图中下载调试会话时,下载文件的名称采用
debug-{session ID}.json格式,其中{session id}是调试会话的 ID;不过,您可以根据需要重命名该文件。Apigee 界面会加载调试文件的数据,并在事务面板的列表中显示所有事务。
- 在事务面板中点击相应事务所在的行,以在事务映射中显示相应事务。
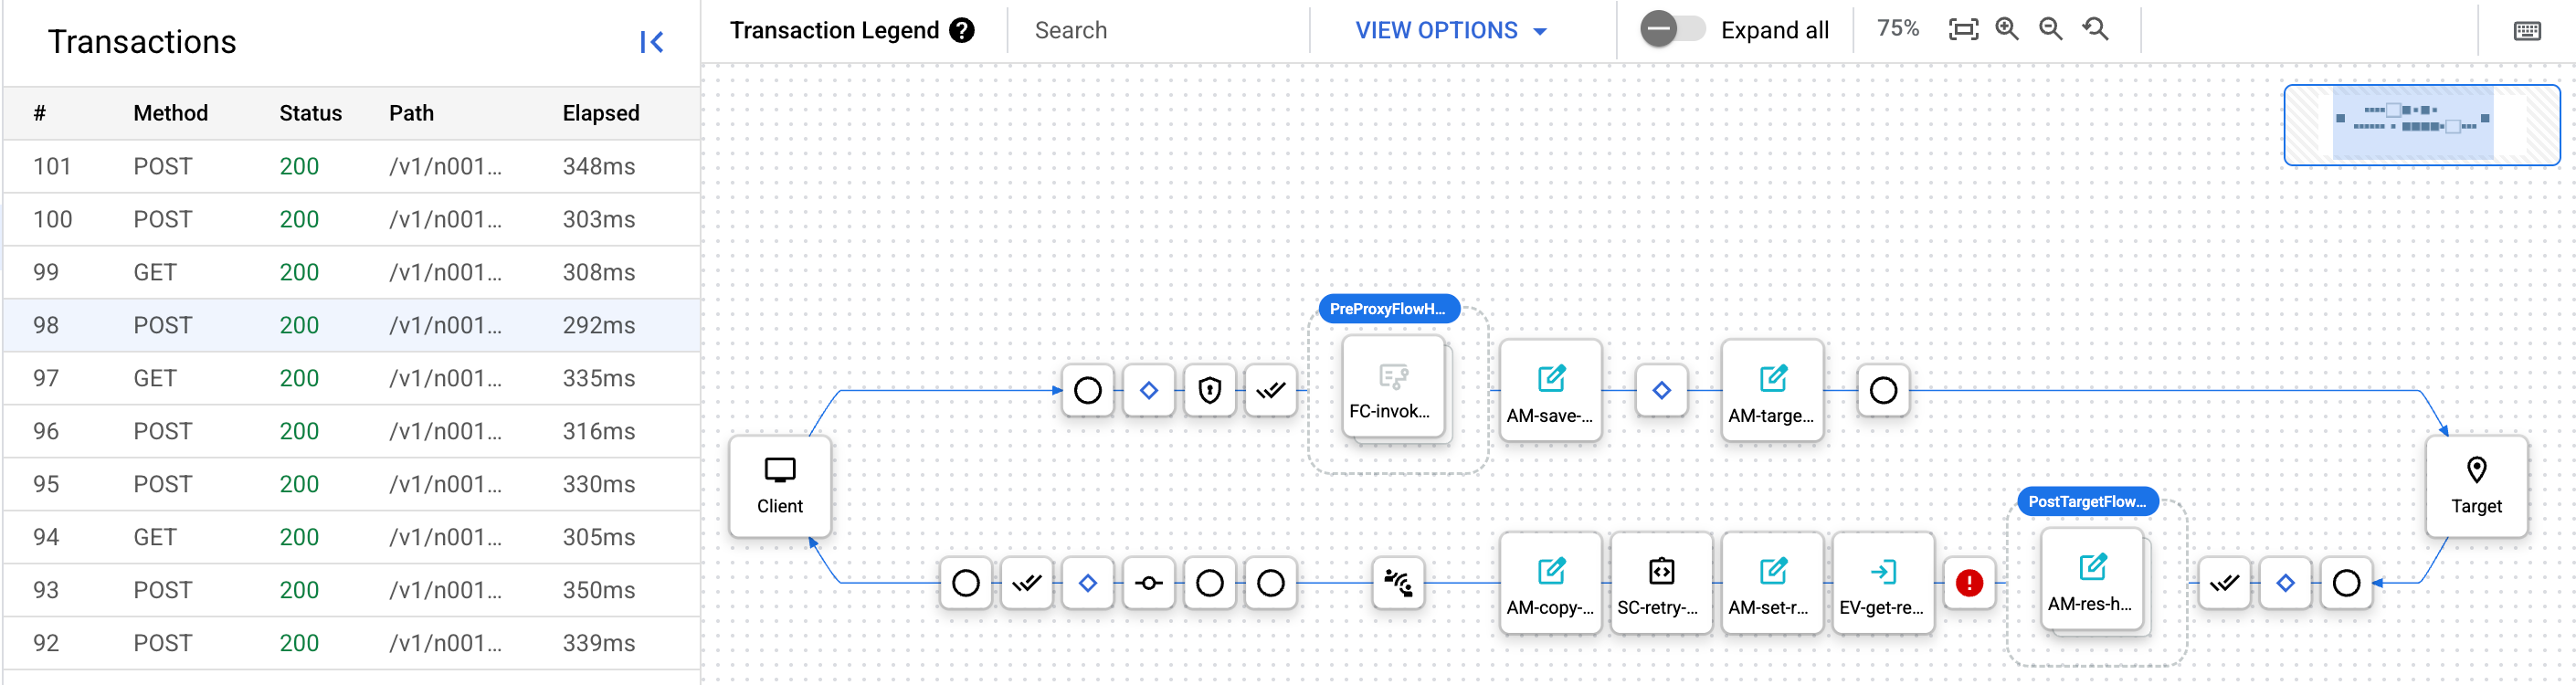
在这里,您可以像处理新创建的调试会话一样探索调试会话。如需了解详情,请参阅创建调试会话。
调试 v1
如需使用离线调试查看下载的调试数据,请执行以下操作:
- 登录Google Cloud 控制台。
- 从主视图中选择 API 代理。
选择开发 > 离线调试。
此时将显示离线调试视图:
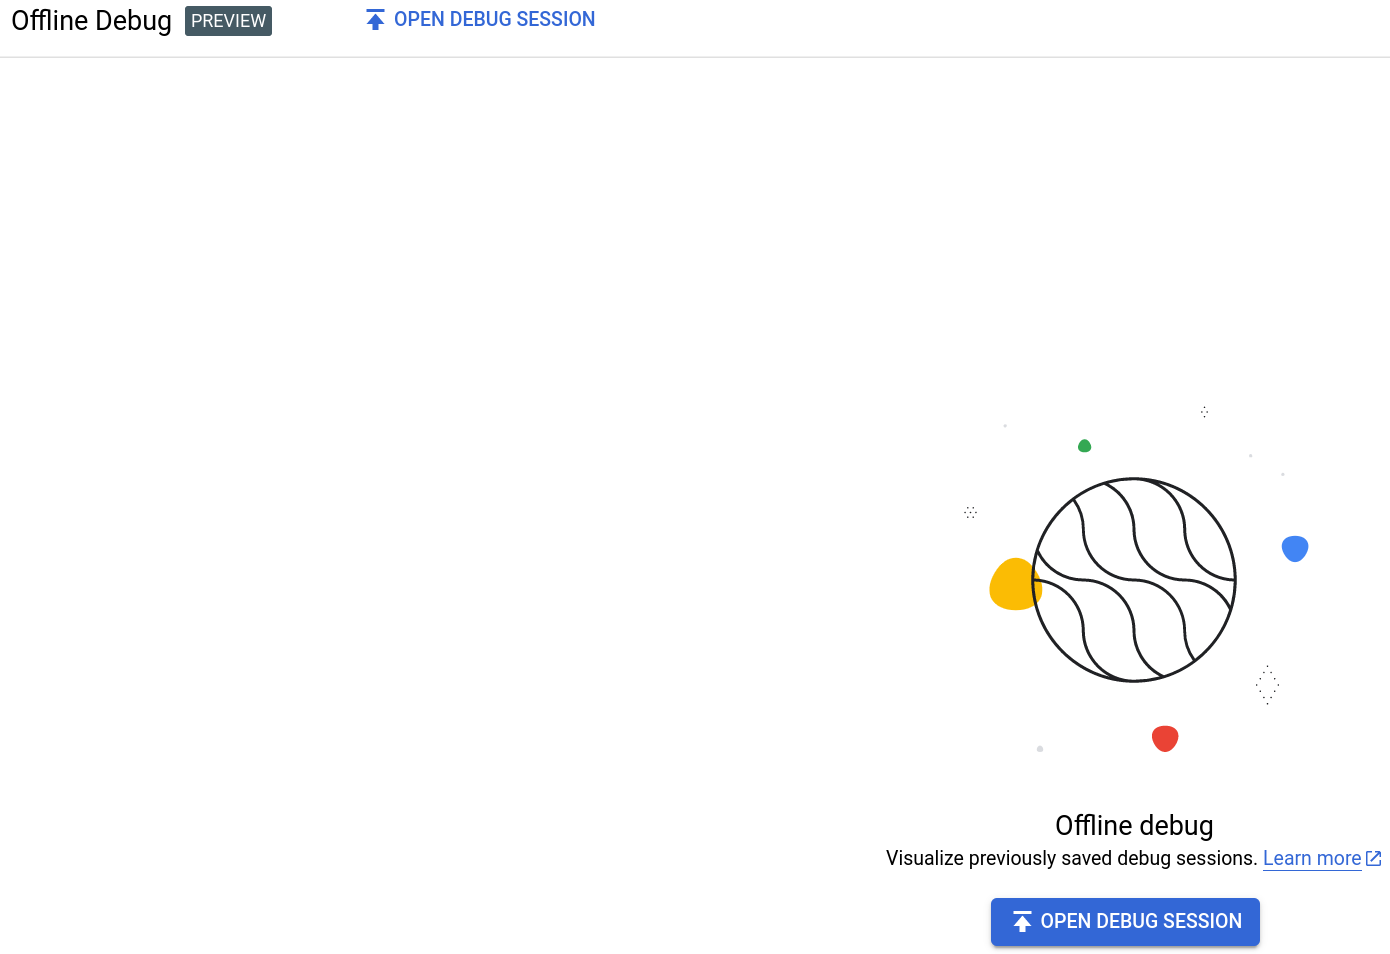
如需将数据加载到离线调试视图中,请点击打开调试会话按钮,然后选择先前下载的 JSON 格式的离线调试会话文件。
注意:在代理编辑器调试视图中下载调试会话时,下载文件的名称采用“debug-{session ID}.json”格式,其中 {session id} 是调试会话的 ID。不过,您可以根据需要重命名该文件。
Apigee 界面会加载调试文件的数据,并在左侧面板中显示与相应事务对应的新行。
- 在左侧面板中点击相应事务所在的行,以在甘特图中显示事务的甘特图。
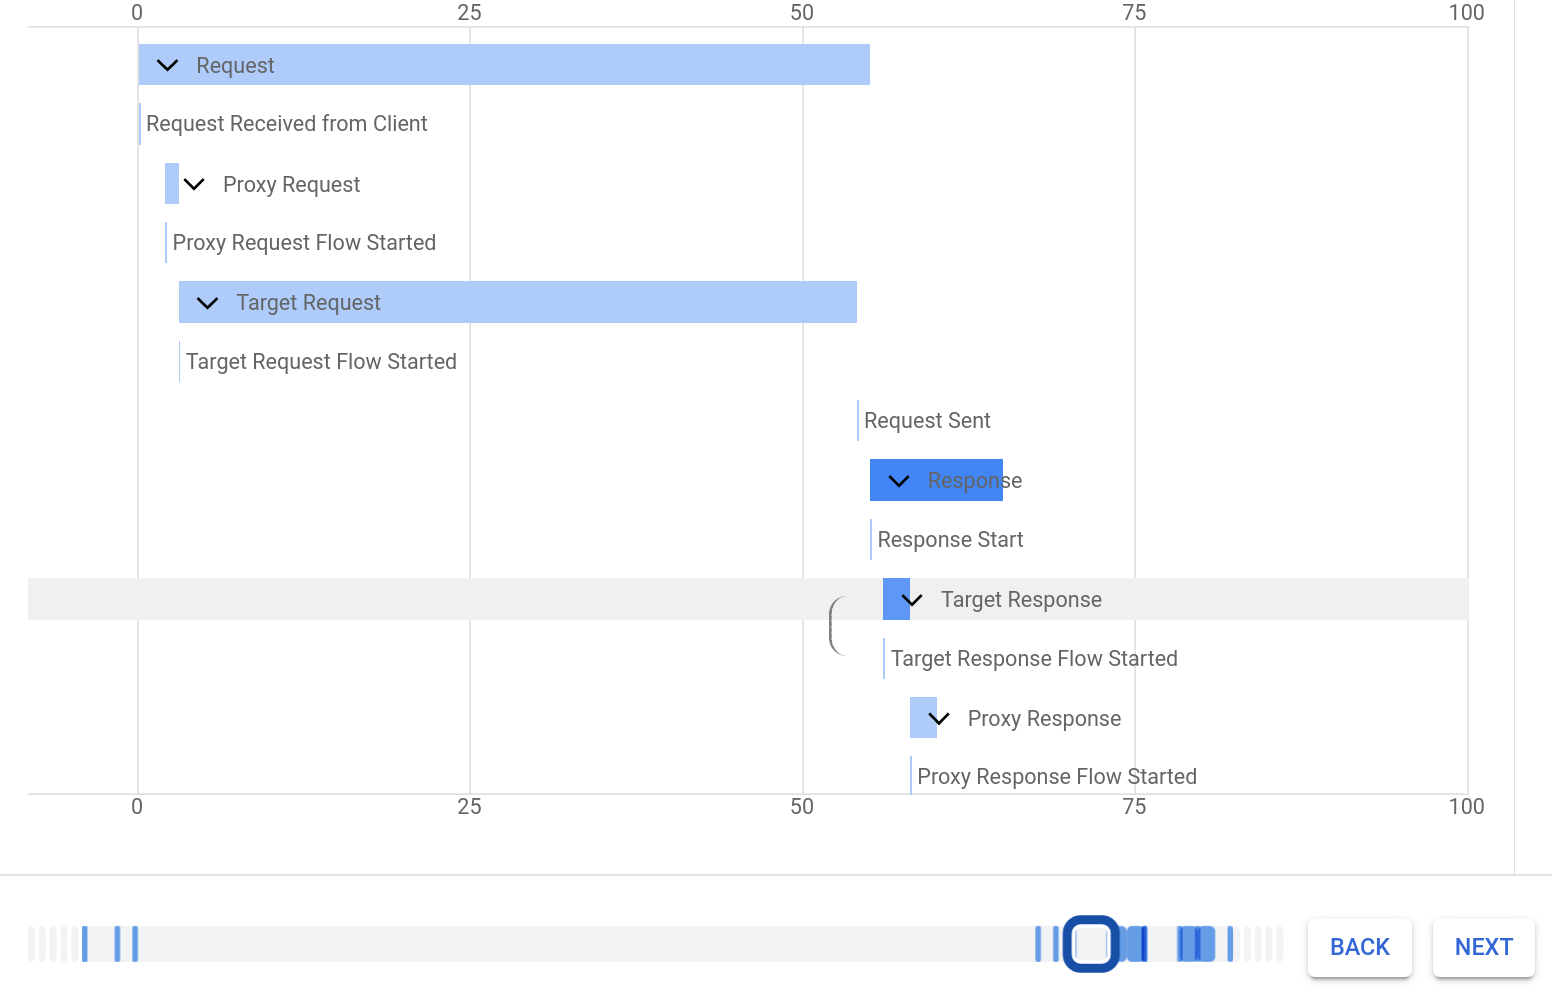
在这里,您可以像在新版代理编辑器的调试视图中一样探索调试会话。请参阅“查看请求和响应的甘特图”部分。
经典版界面
如需使用离线调试查看下载的调试数据,请执行以下操作:
- 登录 Apigee 界面。
- 从主视图中选择 API 代理。
选择开发 > 离线调试。
此时将显示离线调试视图:
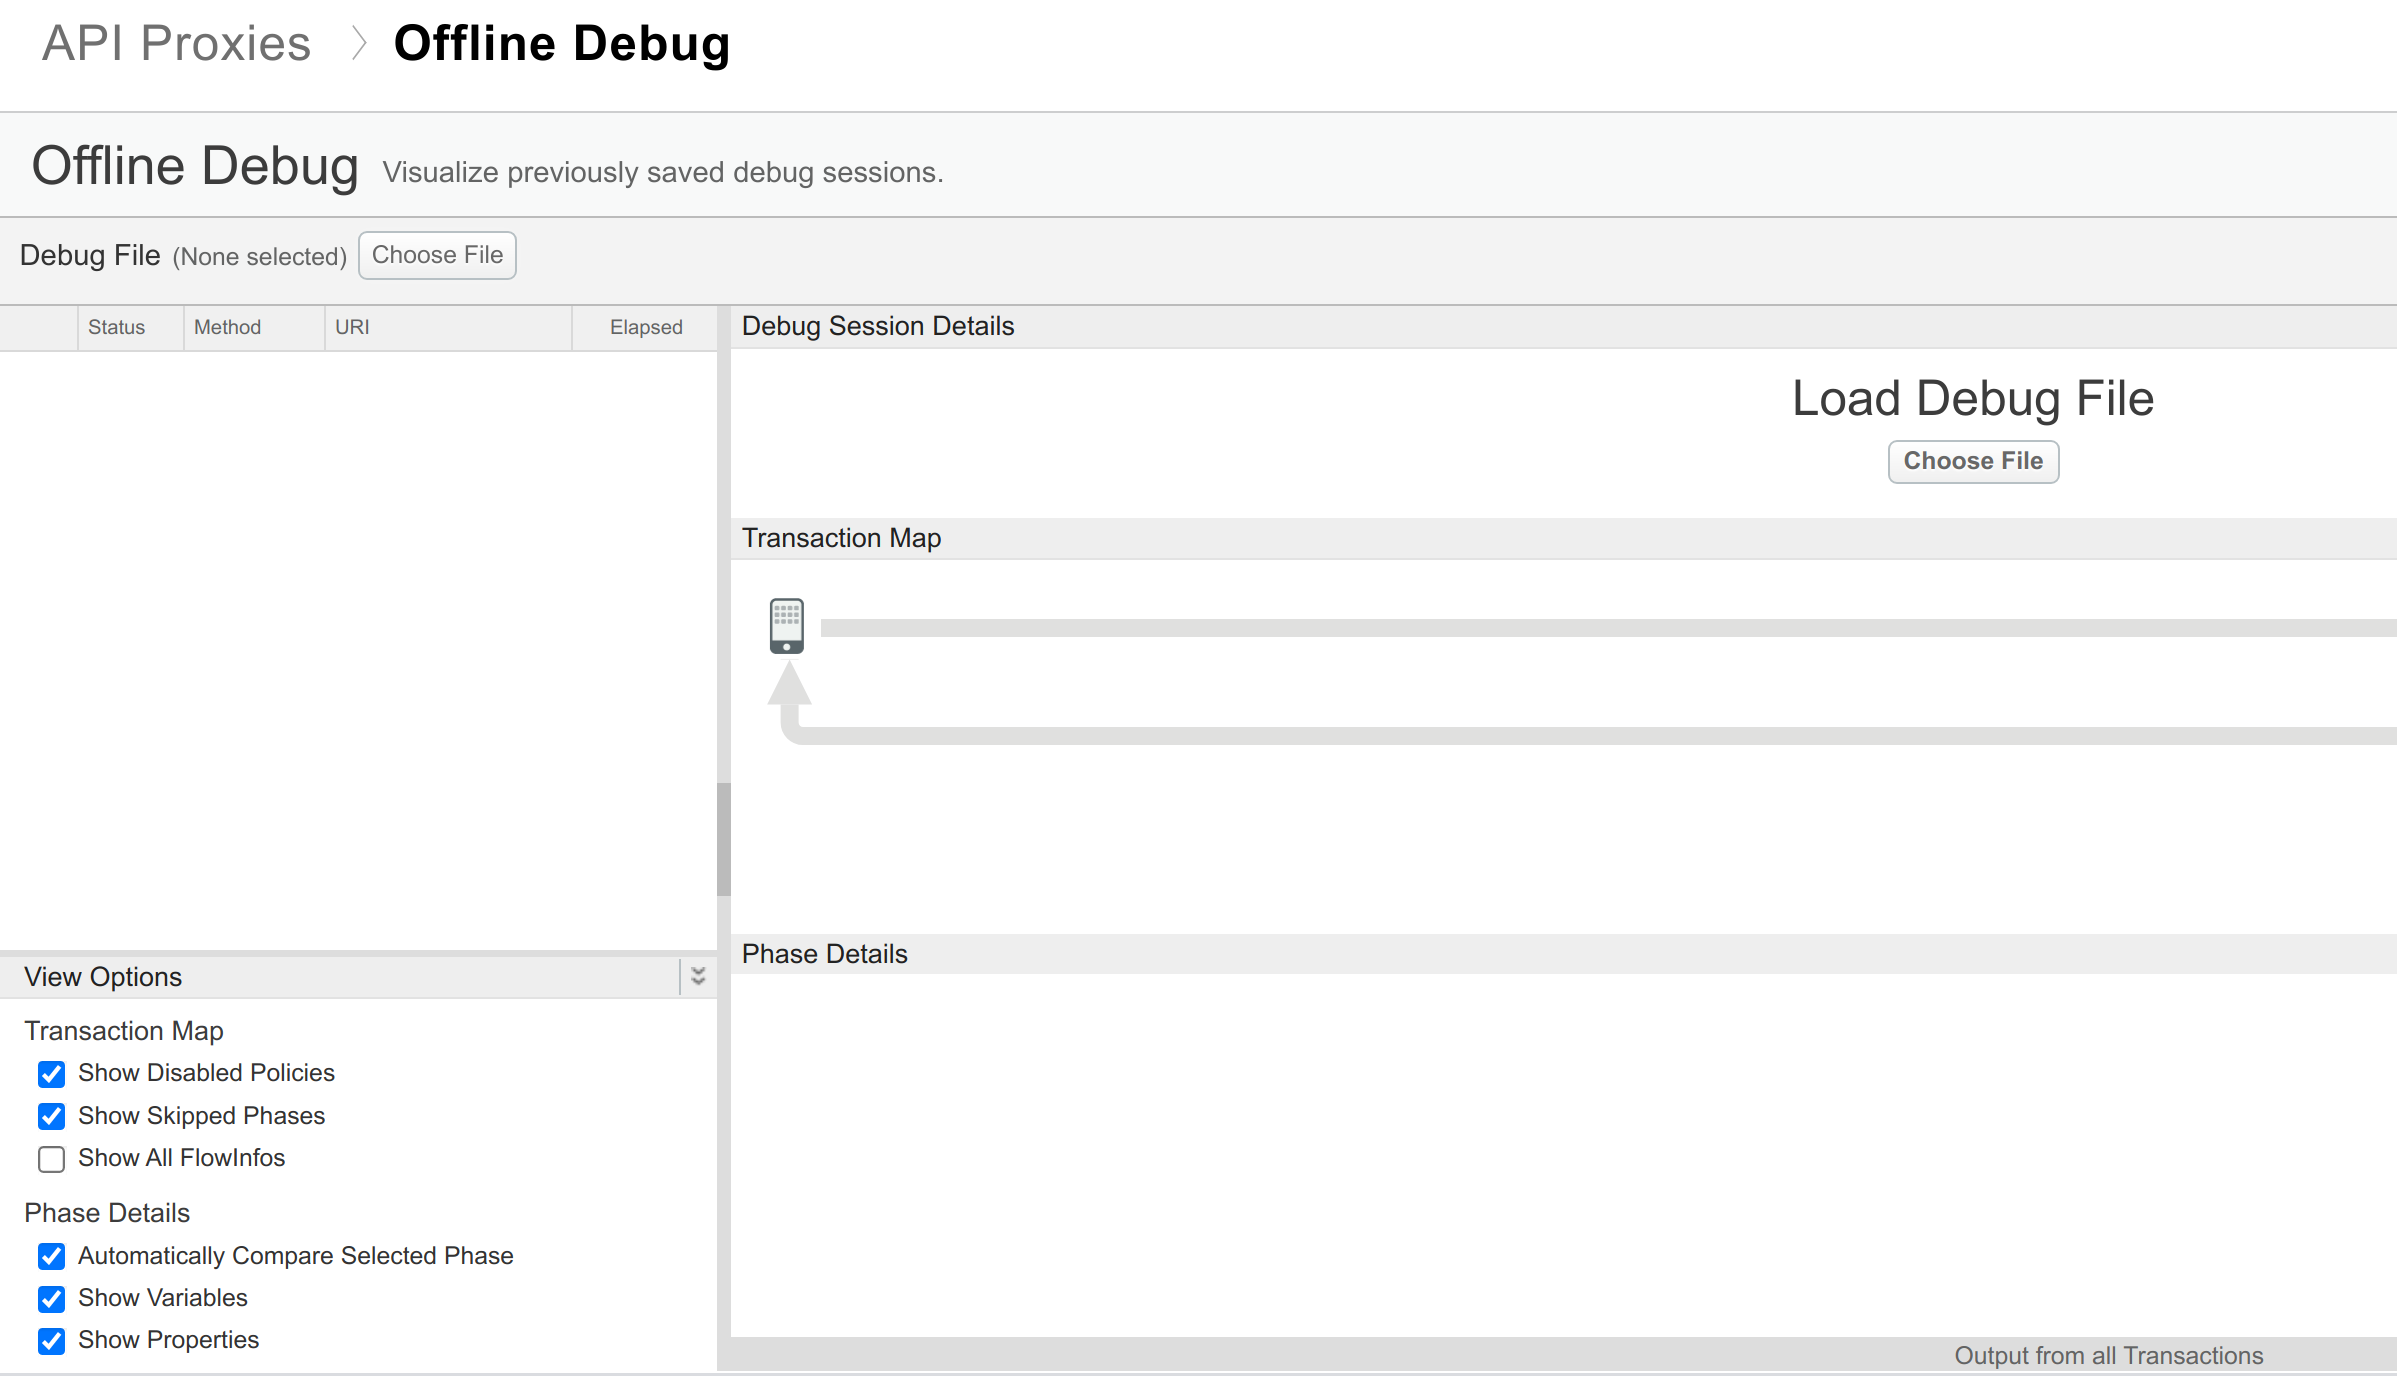
注意离线调试视图的以下区域:
- 调试文件:显示请求类型。使用此区域可在请求之间导航。
- 视图选项:显示配置选项,如使用调试中所述。
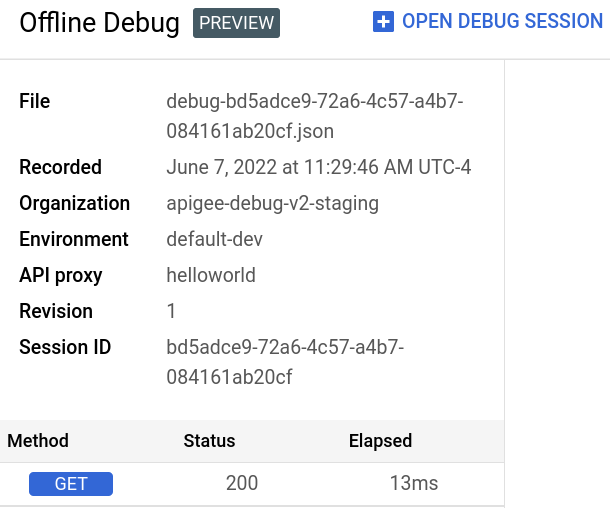
- 调试会话详细信息:显示调试会话的详细信息。
- 事务映射:显示请求经过 API 代理的路径;此路径称为“事务映射”;其中会显示遇到的政策,并指明在执行这些政策期间是否出现错误。
- 阶段详细信息:显示当前所选请求的请求标头。
在 Apigee 界面中查看调试数据时,您可以切换各种选项,例如是否查看已停用的政策或变量和属性。如需了解详情,请参阅使用调试工具进行调试。
如需将数据加载到离线调试视图中,请点击离线调试工具左侧窗格中的选择文件按钮,然后选择先前下载的 JSON 格式的离线跟踪会话文件。
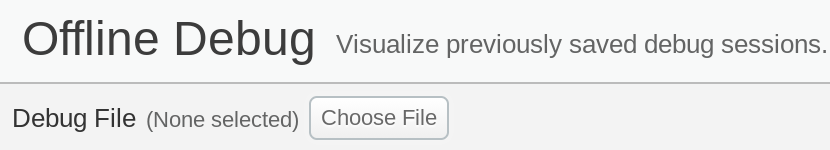
注意:请勿使用右侧窗格中的选择文件按钮,因为它不接受 JSON 文件。
Apigee 界面会加载并显示调试文件的数据: