本页面适用于 Apigee 和 Apigee Hybrid。
查看 Apigee Edge 文档。

如果您在操作异常信息中心内看到异常,可以在 API Monitoring 信息中心内进一步调查。信息中心显示最近的 API 数据的图表和表格,其中提供异常值发生时 API 中的活动的具体信息。
以下部分举例说明如何在信息中心内调查异常值。
示例:故障代码异常值
假设您正在查看操作异常信息中心,并且注意到下面显示的异常:
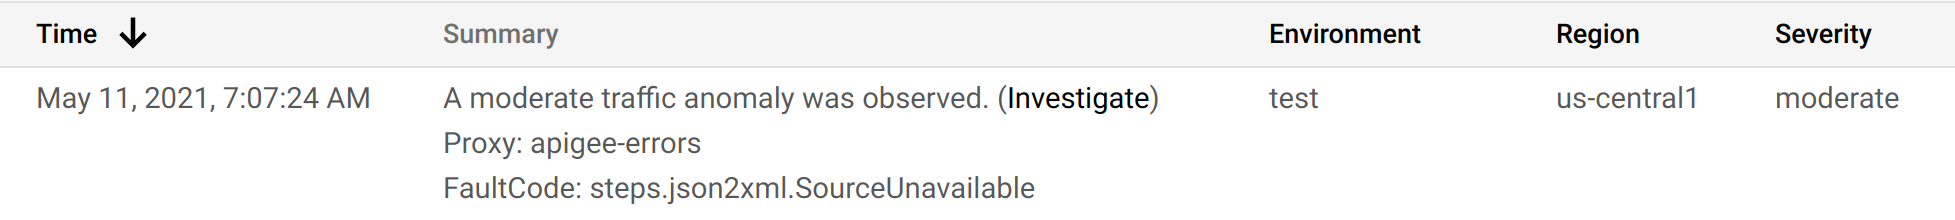
如需查看异常值的详细信息,请点击摘要列中的调查。这将显示 API 监控调查信息中心,如下所示。
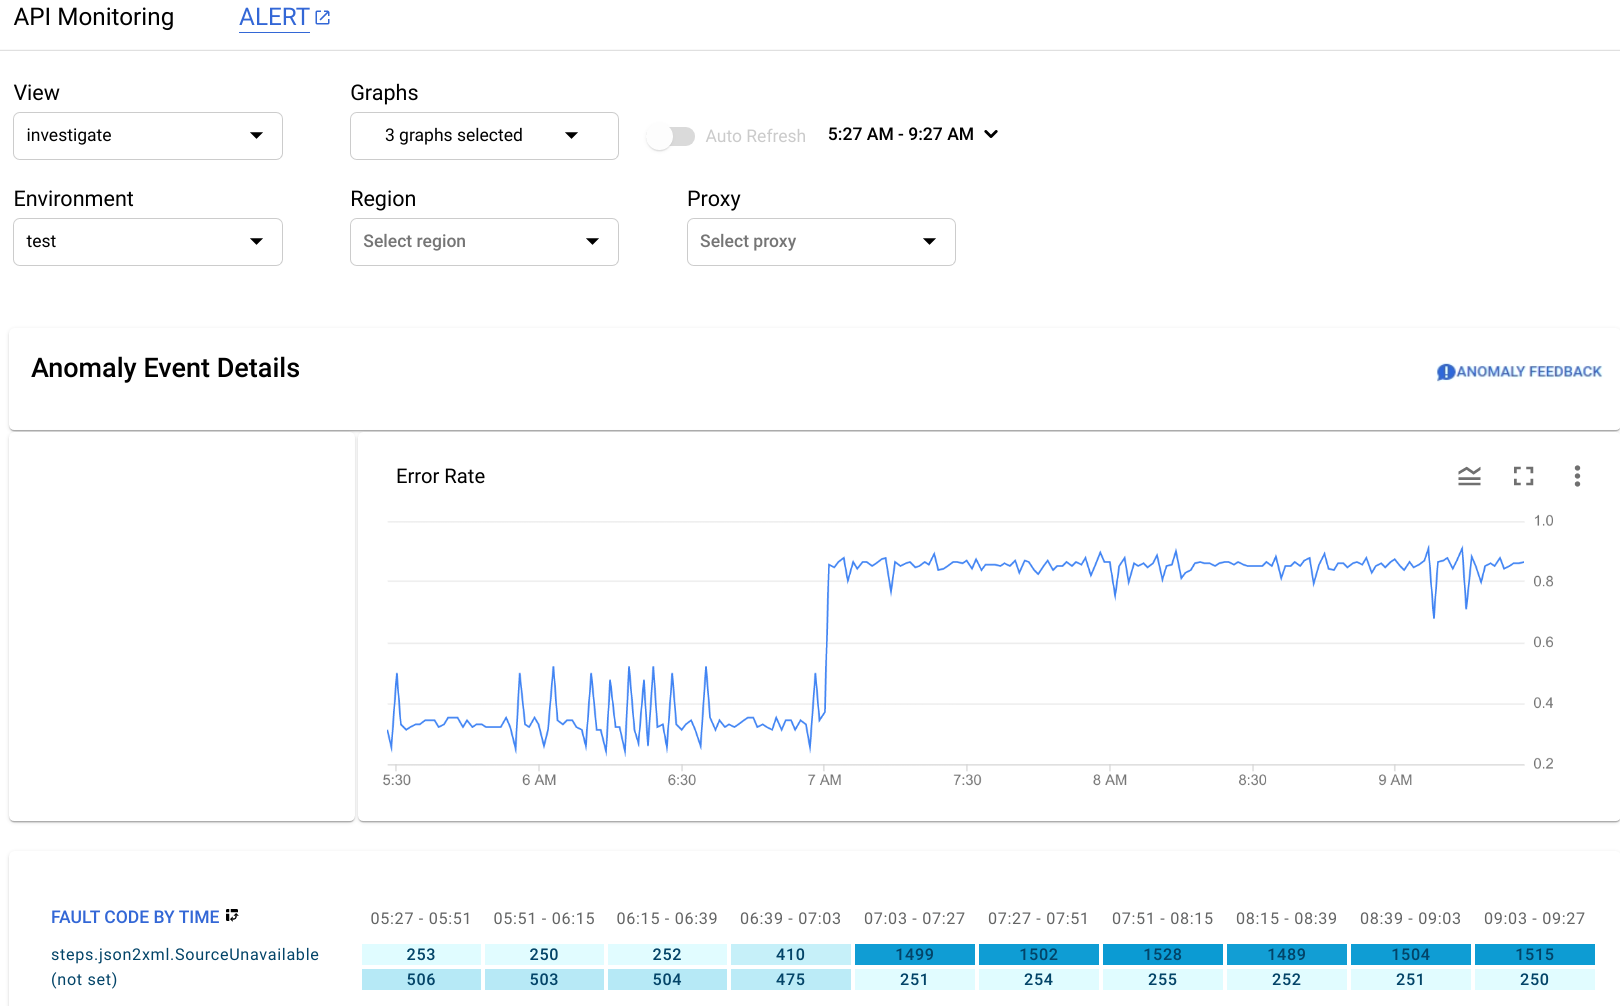
Anomaly Event Details 窗格会显示错误率时间轴。该图表显示异常值发生在上午 07:00 之后,错误率从不到 0.4 突增至 0.8。
时间轴图表中的错误率包括所有故障代码的错误。如需查看不同故障代码的错误明细,请查看时间轴下方显示的 Fault Code by Time 图表。
注意:如果当前未显示 Fault Code by Time 图,请在图形菜单中选择故障代码以显示它: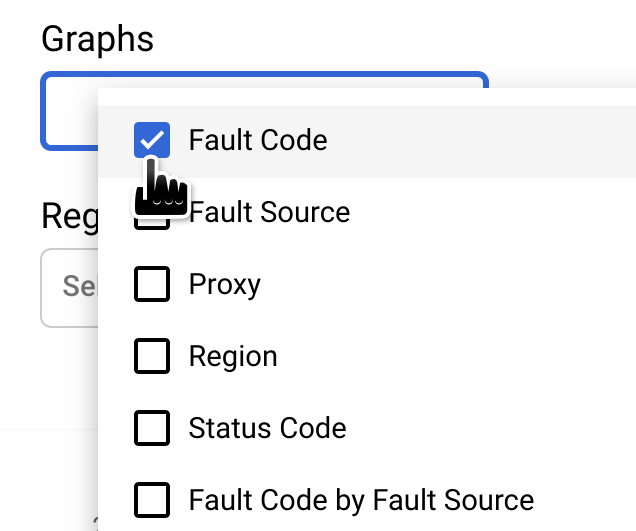
Fault Code by Time 图表中圈起的列对应于包含异常发生时间的时间间隔。
注意:图表中显示的数据与异常值的报告时间有细微差异是正常的。

您会发现,在 07:03 - 07:27 时间段中,有 1499 条响应包含故障代码 steps.json2xml.SourceUnavailable(当 JSON to XML 政策消息源不可用时会返回此错误代码)。这就是触发异常值的故障代码。相比之下,在之前的四个时间段中,包含该故障代码的响应的平均数量约为 291,因此突增到 1499 显然属于异常事件。
如需详细了解 SourceUnavailable 错误消息,请参阅 JSON to XML 政策运行时错误问题排查。
此时,您可以通过以下几种方法继续调查异常值的原因:
在 Fault Code by Time 图表中点击异常值对应的单元格,以深入探究异常值发生时的故障代码数据。
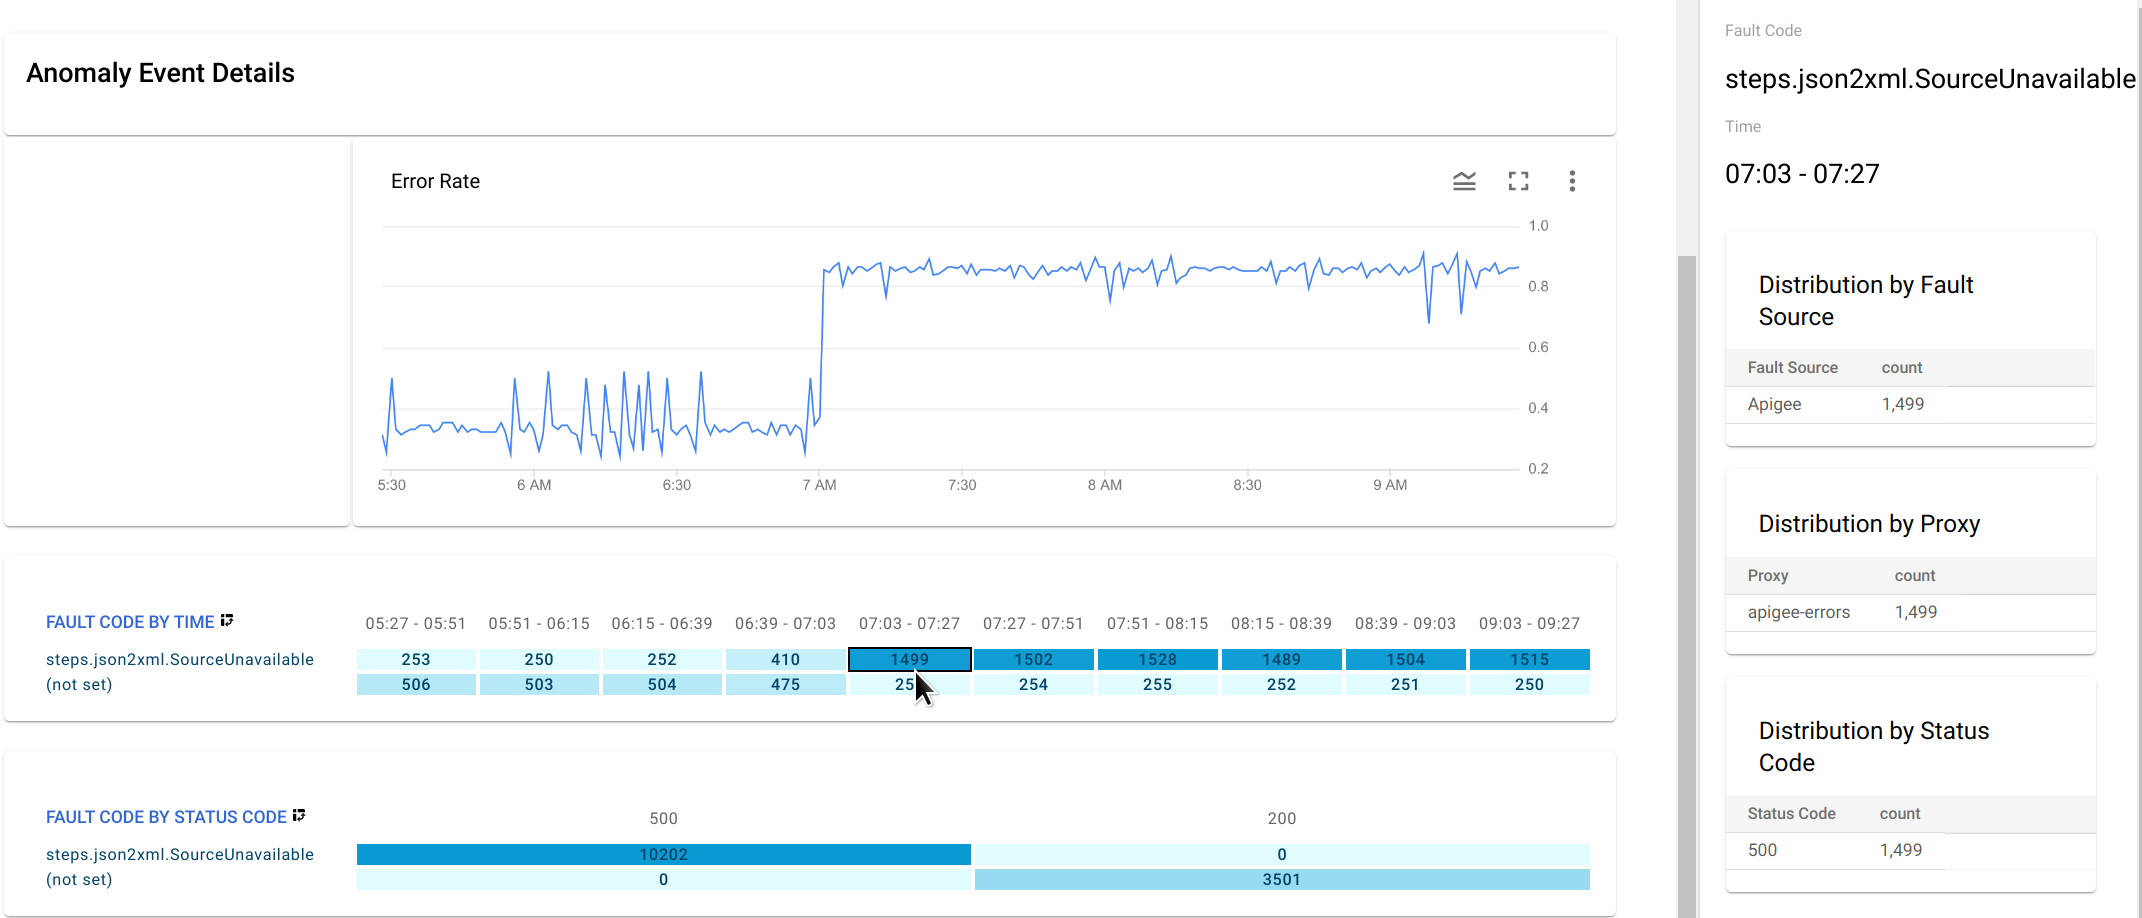
此时右侧窗格中会显示
steps.json2xml.SourceUnavailable按故障来源、代理和状态代码的分布表。在此示例中,这些表不提供任何其他信息,因为所有故障代码都来自同一故障源、代理和状态代码。但在其他情况下,分布表可以指示异常值的位置和原因。
- 针对异常值创建提醒并设置通知。完成此操作后,将来每当相似的事件发生时,AAPI Ops 都会向您发送消息。