缓存性能信息中心
使用集合让一切井井有条
根据您的偏好保存内容并对其进行分类。
本页面适用于 Apigee 和 Apigee Hybrid。
查看 Apigee Edge 文档。

此信息中心可以提供什么信息?
缓存性能信息中心会从 ResponseCache 政策收集数据。此信息中心不会从 LookupCache 或 PopulateCache 政策收集数据。
通过缓存性能信息中心,您可以快速查看响应缓存的值。信息中心可帮助您直观地了解响应缓存在缩短延迟时间和减少后端服务器负载方面的优势。
要访问缓存性能信息中心,请执行以下操作:
在 Google Cloud 控制台中,依次前往分析 > API 指标 > 缓存性能页面。
前往“缓存性能”页面
缓存性能视图如下所示:
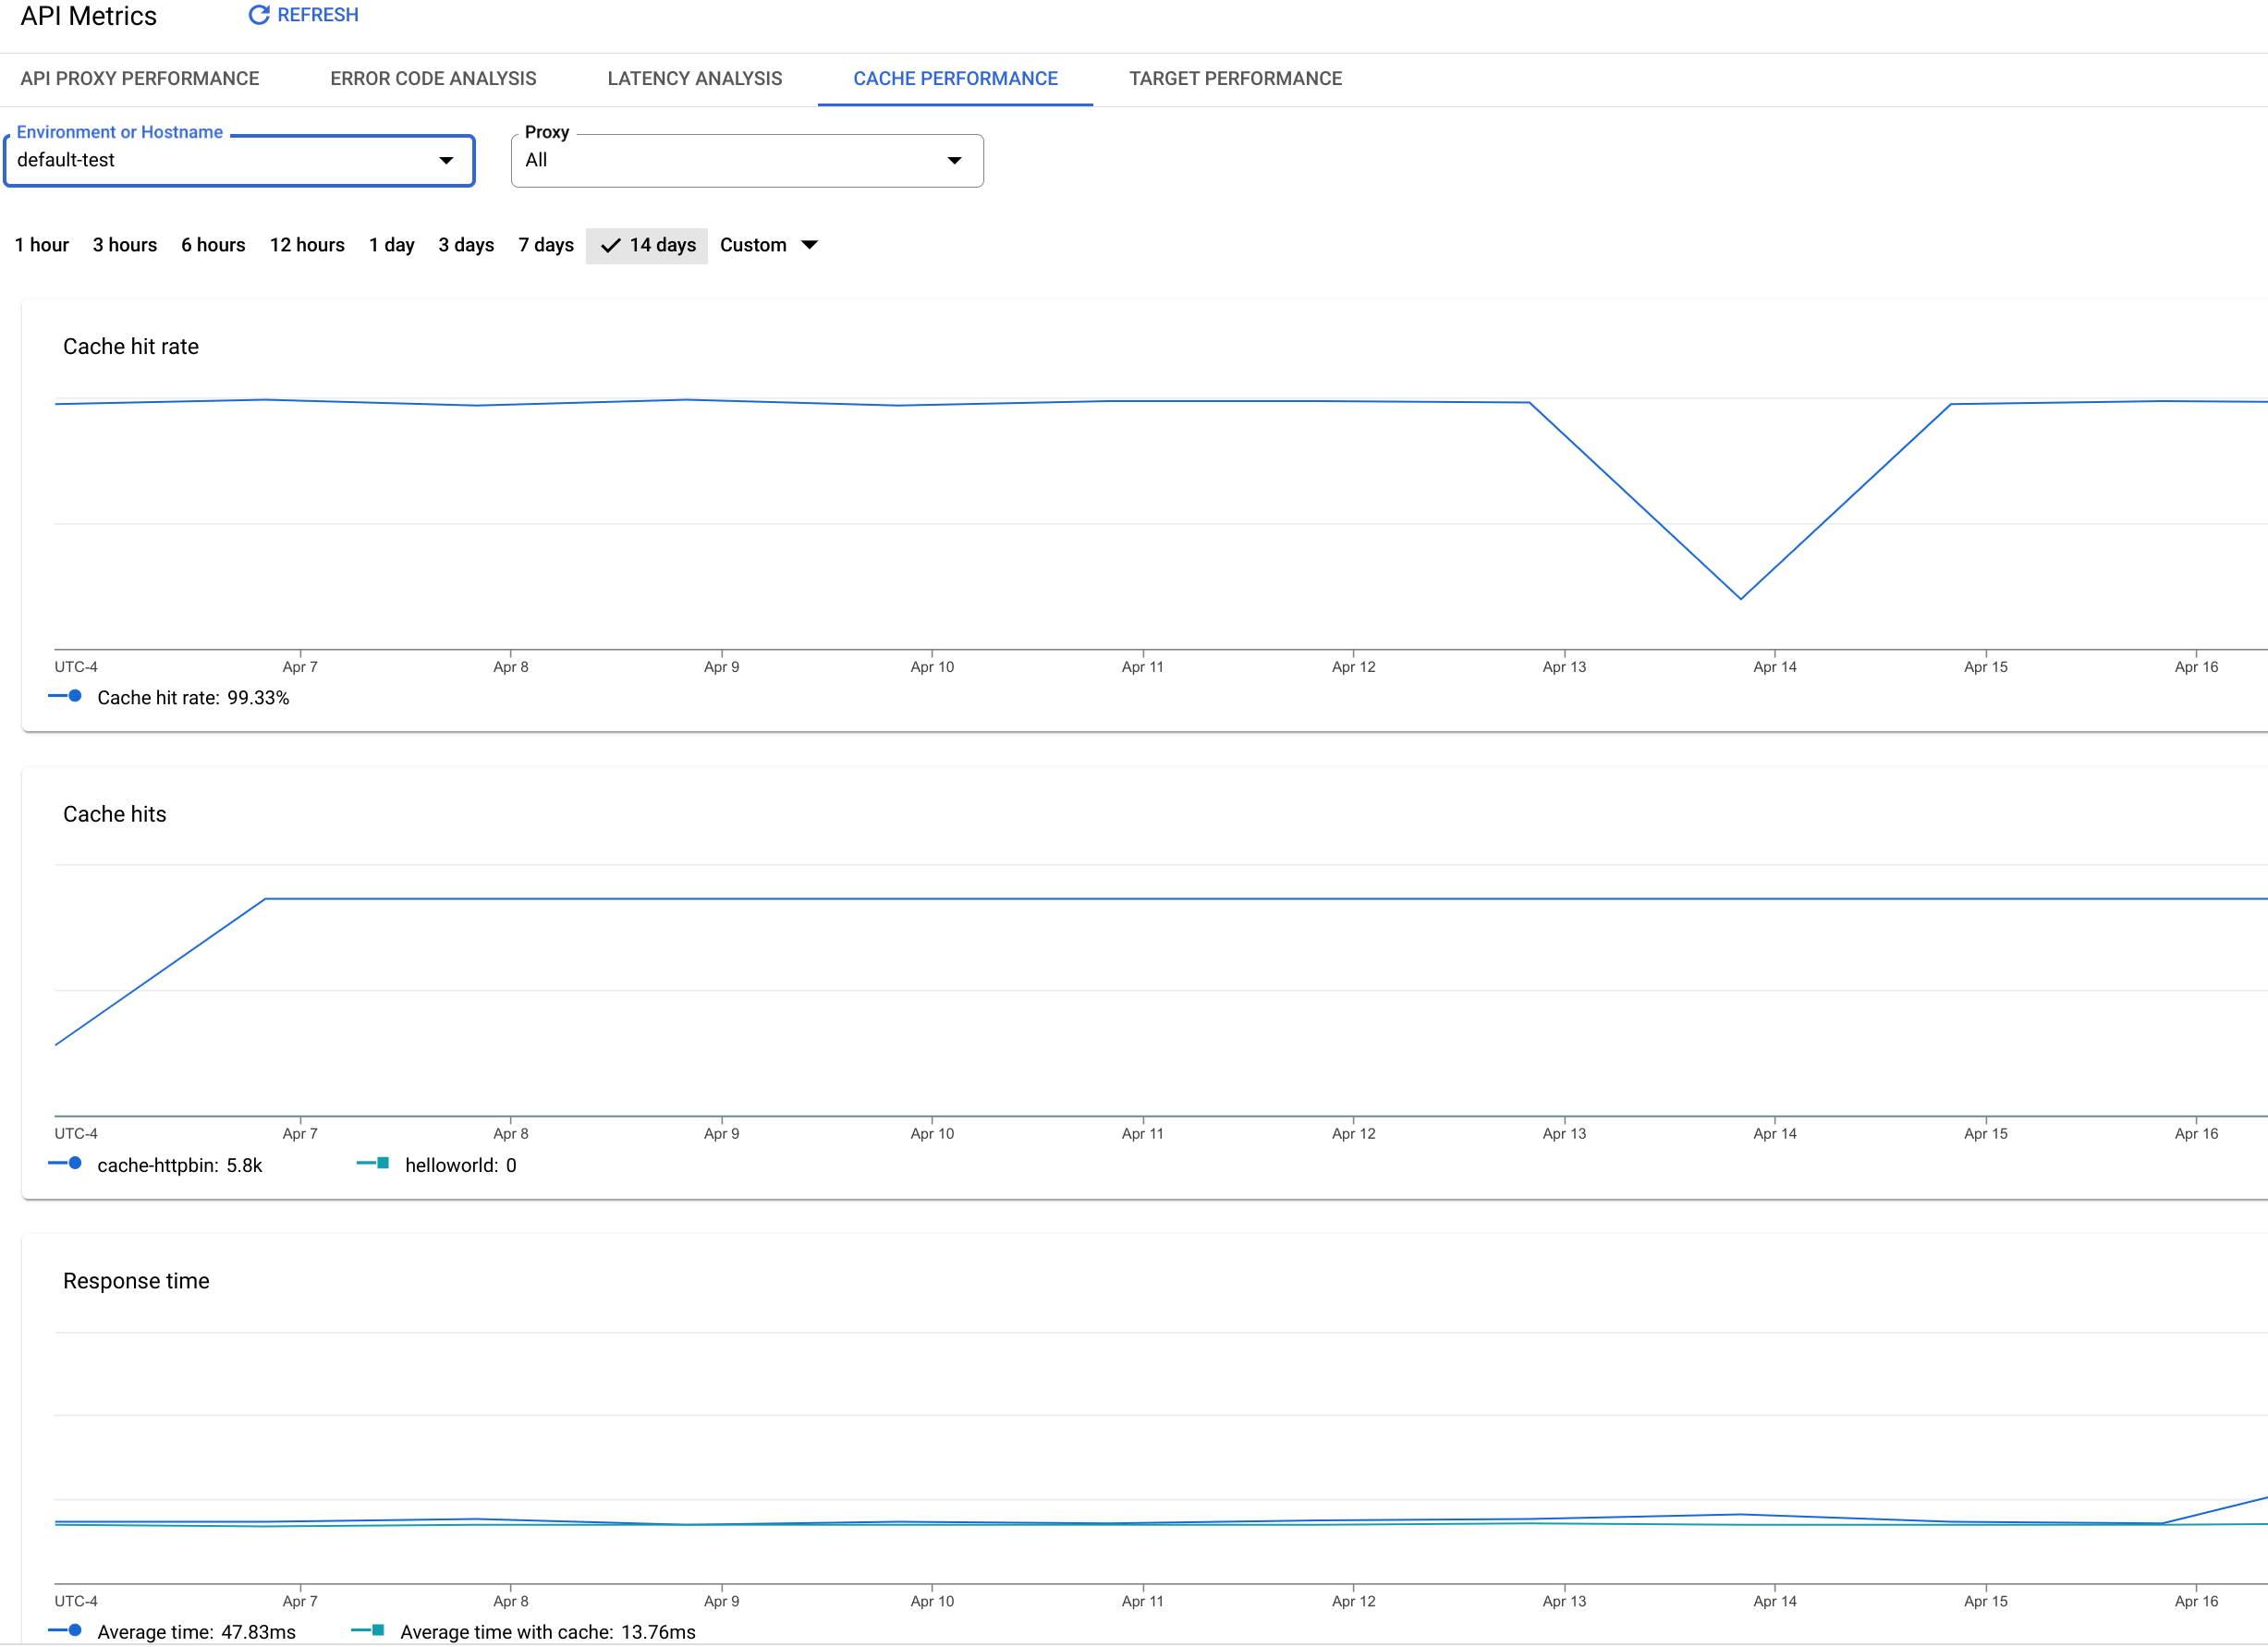
此信息中心衡量的是什么?
| 指标 |
说明 |
| 平均缓存命中率 |
命中缓存的调用率是根据 API 总流量测得的。 |
| 缓存命中(按 API 代理) |
命中缓存的调用总和(按 API 代理细分)。
|
| 缓存的平均时间 |
API 调用命中缓存的平均时间。 |
| 无缓存的平均时间 |
API 调用未命中缓存的平均时间。 |
如未另行说明,那么本页面中的内容已根据知识共享署名 4.0 许可获得了许可,并且代码示例已根据 Apache 2.0 许可获得了许可。有关详情,请参阅 Google 开发者网站政策。Java 是 Oracle 和/或其关联公司的注册商标。
最后更新时间 (UTC):2025-10-09。
[[["易于理解","easyToUnderstand","thumb-up"],["解决了我的问题","solvedMyProblem","thumb-up"],["其他","otherUp","thumb-up"]],[["很难理解","hardToUnderstand","thumb-down"],["信息或示例代码不正确","incorrectInformationOrSampleCode","thumb-down"],["没有我需要的信息/示例","missingTheInformationSamplesINeed","thumb-down"],["翻译问题","translationIssue","thumb-down"],["其他","otherDown","thumb-down"]],["最后更新时间 (UTC):2025-10-09。"],[],[]]