Cache performance ダッシュボード
このページは Apigee と Apigee ハイブリッドに適用されます。
Apigee Edge のドキュメントを表示する。

このダッシュボードの内容
キャッシュ パフォーマンス ダッシュボードは、ResponseCache ポリシーからデータを収集します。このダッシュボードは、LookupCache ポリシーまたは PopulateCache ポリシーからデータを収集しません。
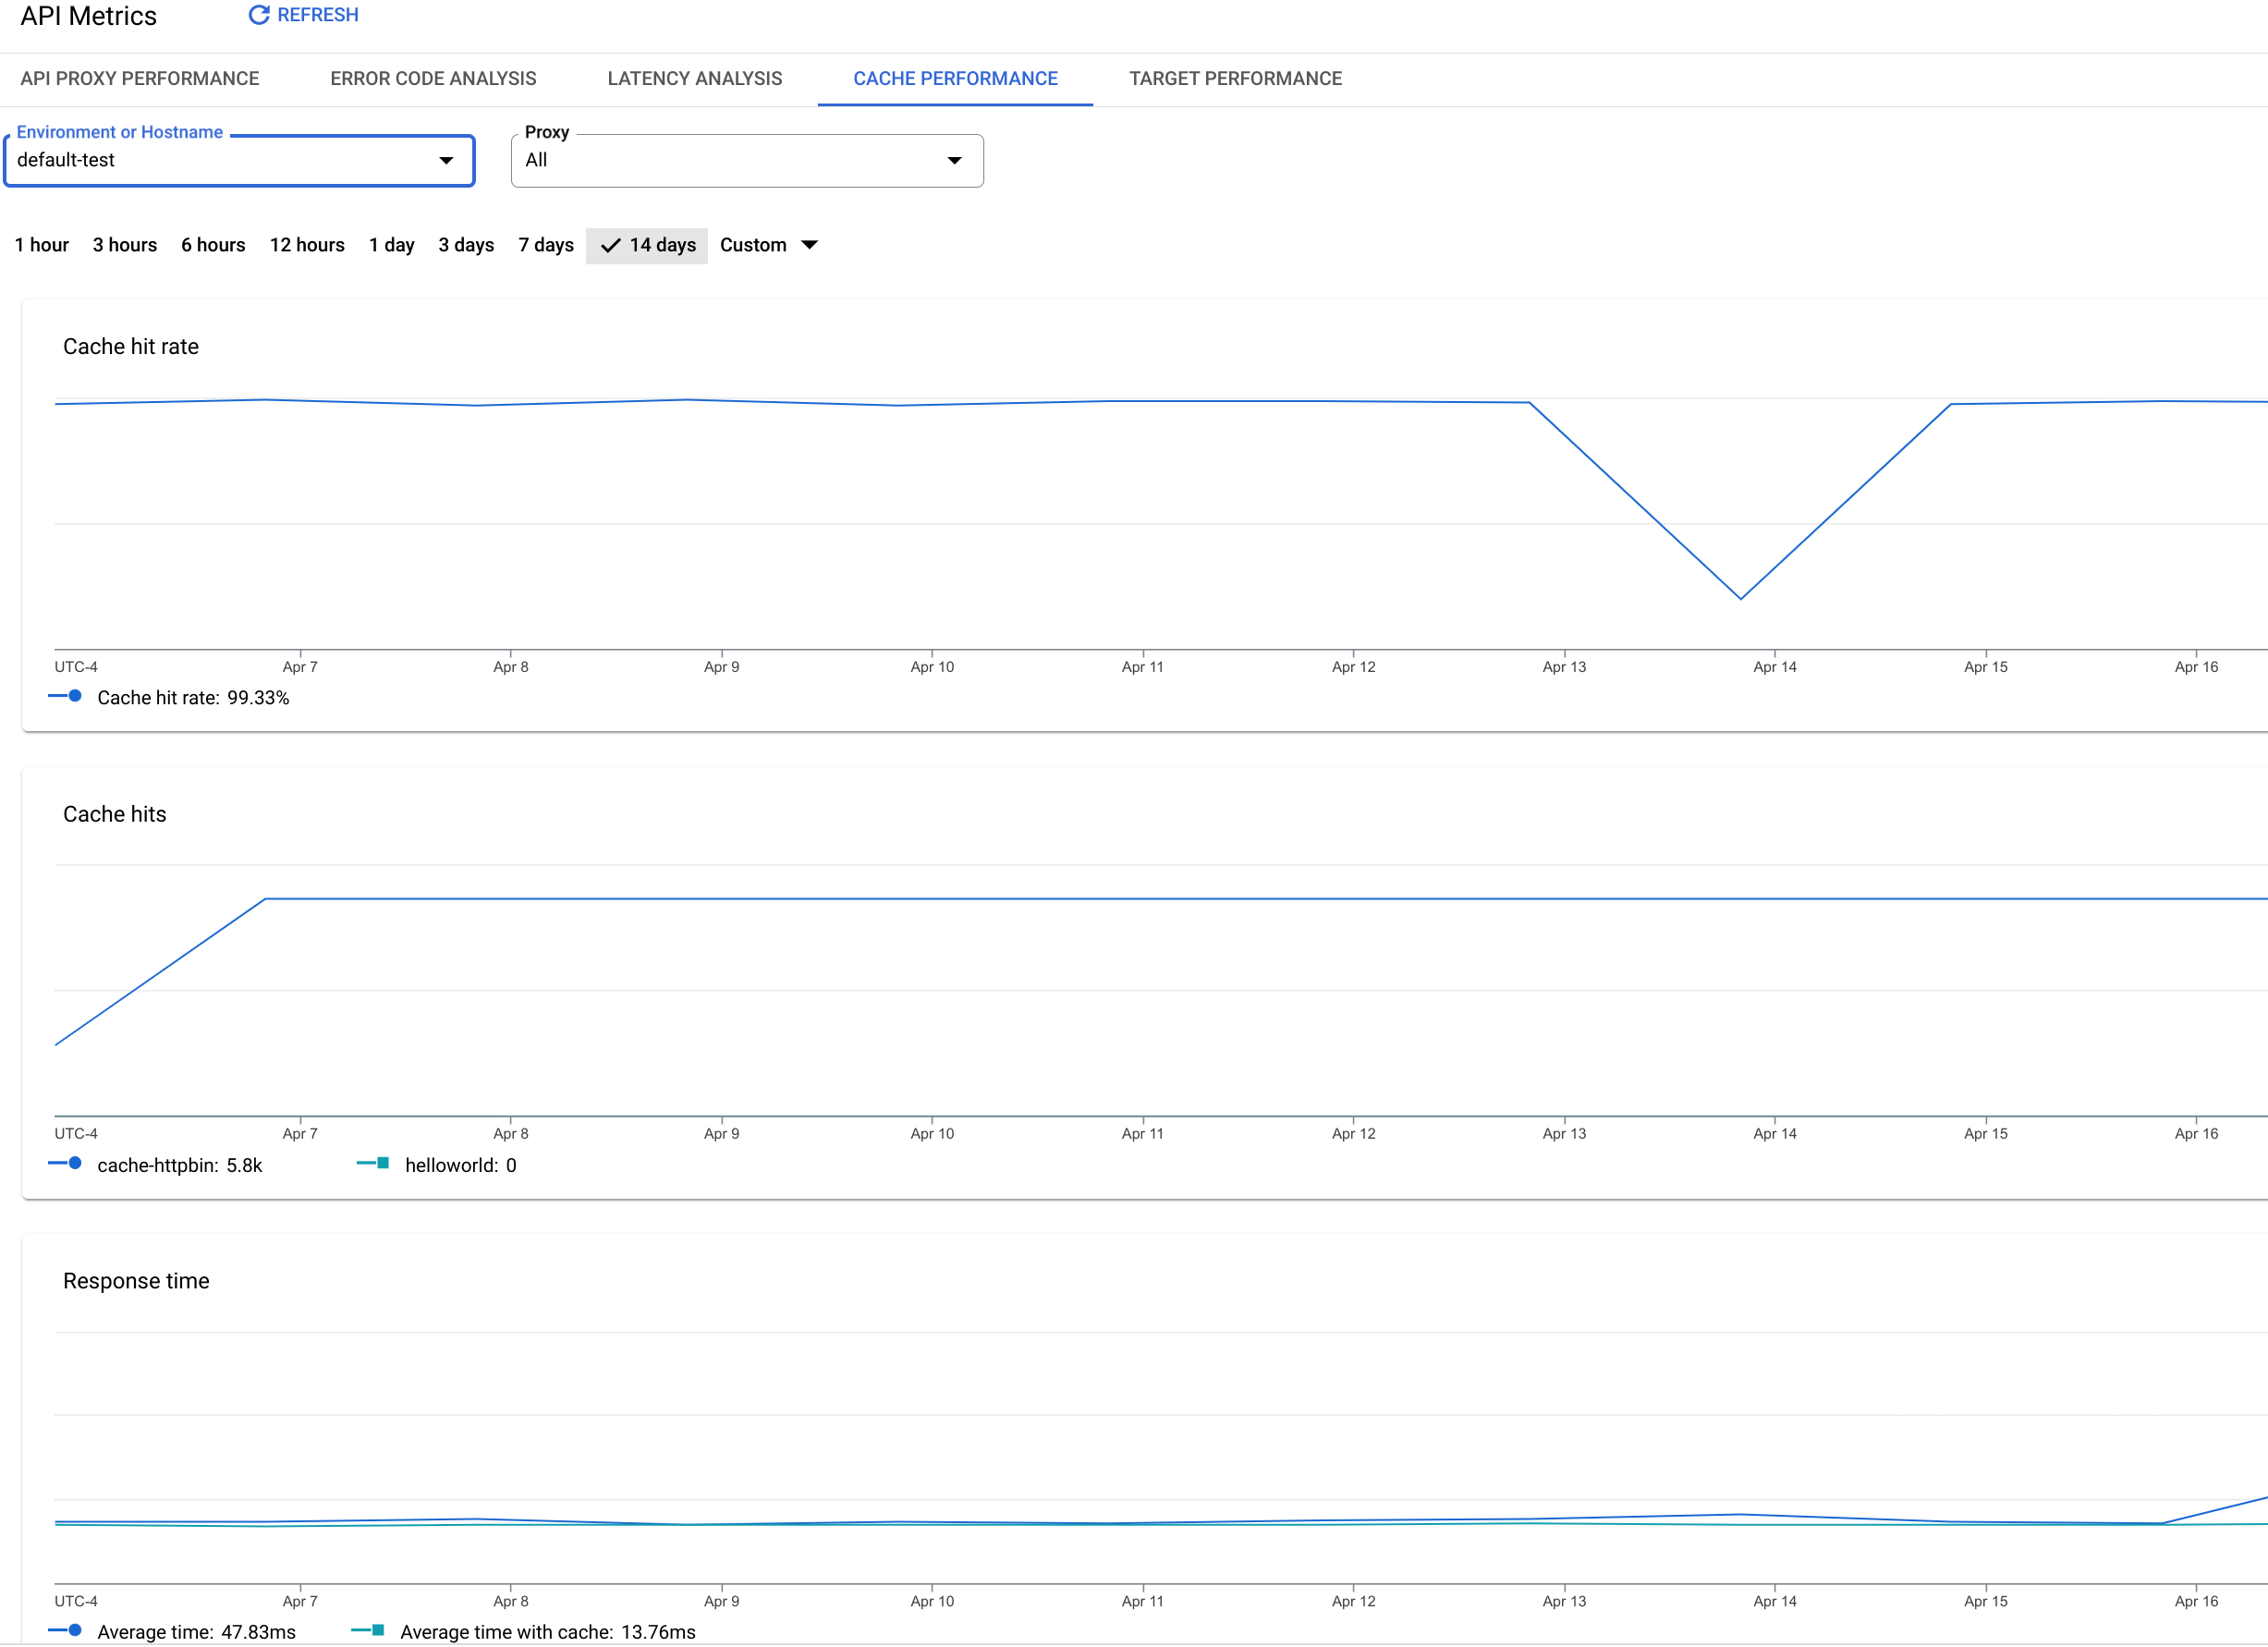
キャッシュ パフォーマンス ダッシュボードでは、レスポンス キャッシュの値を一目で確認できます。このダッシュボードは、レスポンス キャッシュの状況を可視化できます。これにより、レイテンシを短縮し、バックエンド サーバーでの負荷を軽減できます。
キャッシュ パフォーマンス ダッシュボードにアクセスするには:
Google Cloud コンソールで、[アナリティクス] > [API 指標] > [キャッシュ パフォーマンス] ページに移動します。
[キャッシュ パフォーマンス] に移動
[キャッシュ パフォーマンス] ビューが表示されます。
このダッシュボードの測定内容
| 指標 |
説明 |
| Average cache hit rate |
API トラフィックの合計に対して、キャッシュにヒットした呼び出しの割合。 |
| API プロキシ別のキャッシュ ヒット数 |
キャッシュにヒットした呼び出しの合計(API プロキシ別に分類)。
|
| Average time with cache |
キャッシュにヒットしたときの API 呼び出しの平均時間。 |
| Average time without cache |
キャッシュにヒットしなかった API 呼び出しの平均時間。 |
特に記載のない限り、このページのコンテンツはクリエイティブ・コモンズの表示 4.0 ライセンスにより使用許諾されます。コードサンプルは Apache 2.0 ライセンスにより使用許諾されます。詳しくは、Google Developers サイトのポリシーをご覧ください。Java は Oracle および関連会社の登録商標です。
最終更新日 2025-10-19 UTC。
[[["わかりやすい","easyToUnderstand","thumb-up"],["問題の解決に役立った","solvedMyProblem","thumb-up"],["その他","otherUp","thumb-up"]],[["わかりにくい","hardToUnderstand","thumb-down"],["情報またはサンプルコードが不正確","incorrectInformationOrSampleCode","thumb-down"],["必要な情報 / サンプルがない","missingTheInformationSamplesINeed","thumb-down"],["翻訳に関する問題","translationIssue","thumb-down"],["その他","otherDown","thumb-down"]],["最終更新日 2025-10-19 UTC。"],[],[]]