本頁內容適用於 Apigee 和 Apigee Hybrid。
查看
Apigee Edge 說明文件。
![]()
API Monitoring 的「Recent」檢視畫面會顯示依 Proxy 分類的 API 流量樹狀圖。
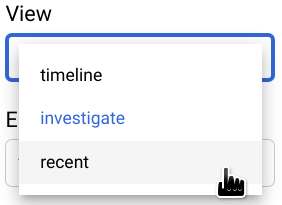
如要存取「最近」檢視畫面,請按照「存取 API 監控」一文中的步驟操作,然後選取「最近」。

下圖顯示選取「最近」的 UI。

「近期」檢視畫面會顯示三張樹狀圖,其中每個 Proxy 的 API 流量會以矩形表示,矩形大小與該 Proxy 的流量成正比。矩形的顏色代表下列其中一個變數的相對大小 (視您查看的樹狀圖而定):
- 快訊觸發的事件數
- 錯誤率
- 延遲時間第 50 個百分位數上限
請注意,如果忽略矩形的顏色,這三張圖表顯示的矩形基本模式都相同。這是因為每個 Proxy 的矩形大小只取決於流量,而這三張圖的流量相同。
舉例來說,第二張圖表「依 Proxy 劃分的 Proxy 錯誤率」會顯示每個 Proxy 的相對錯誤率大小:長方形越深,錯誤率就越高。如要在 Apigee 使用者介面中查看 Proxy 的錯誤率值,請將游標移至 Proxy 的矩形上。範例如下所示:

矩形中的文字會顯示 proxy43 的下列資料:
- 總流量:760
- 錯誤率:0.48
由於 proxy43 的錯誤率是所有 Proxy 中最高的,因此圖表中的矩形會以最深的藍色表示。
根據預設,「最近」檢視畫面會顯示三個表格:
- 依 Proxy 劃分的事件
- 按 Proxy 列出的 Proxy 錯誤率
- 各 Proxy 的最大 Proxy 延遲時間 p50 (毫秒)
與時間軸檢視畫面相同,您可以從「圖表」選單中選取任意表格組合來顯示。所有其他圖表選項與時間軸檢視畫面相同。
深入瞭解儲存格資料的分布情形
與「調查」檢視畫面相同,您可以點選表格儲存格,更精細地查看個別表格儲存格的資料。右側面板會顯示不同屬性的儲存格資料分布情形。詳情請參閱「查看儲存格資料的分布情形」。

