本頁內容適用於 Apigee 和 Apigee Hybrid。
查看
Apigee Edge 說明文件。

API 監控時間軸檢視畫面會顯示近期 API 流量的時間軸,協助您診斷及調查問題。
如要存取時間軸檢視畫面,請按照「存取 API 監控」一文中的步驟操作,然後選取「時間軸」。
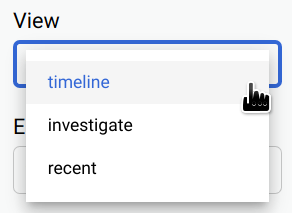
下圖顯示選取「時間軸」的 UI。

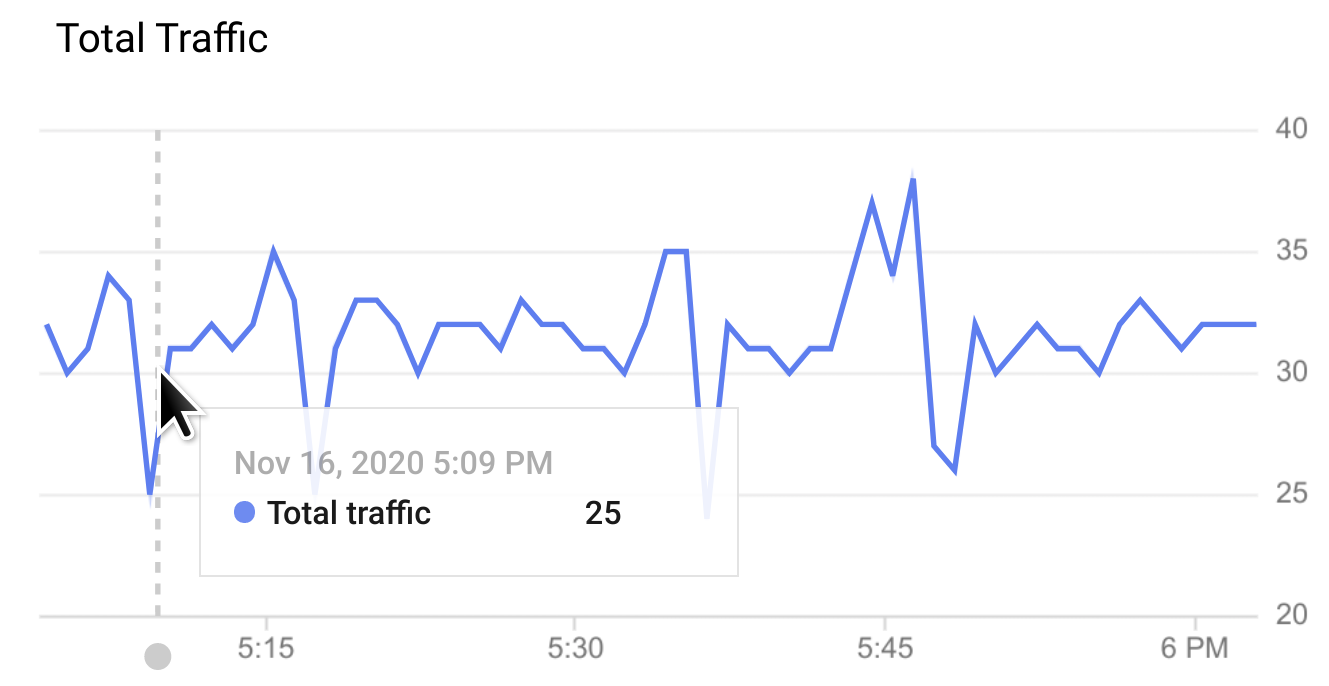
時間軸檢視畫面會顯示下列圖表:
- Proxy 總流量:時間範圍內每分鐘間隔的要求數。
- Proxy 錯誤率:每個間隔的錯誤總數 (4xx 和 5xx) 除以流量總數。
- Proxy 延遲百分位數:API 延遲的百分位數。圖表會顯示下列百分位數:第 50 (中位數)、第 90、第 95 和第 99 個百分位數。
- 目標總流量
- 目標錯誤率
- 目標延遲百分位數
將滑鼠游標懸停在圖表中的任一點上,即可顯示該點的值。
您可以從「圖表」下拉式選單中選擇要顯示的圖表。
所有檢視畫面的圖表選項
所有三種檢視畫面 (時間軸、調查和近期) 都提供下列圖表選項:
- 快訊:按一下「快訊」,即可設定快訊和通知,在發生流量或延遲尖峰等事件時收到通知。
檢視畫面:選取其中一個 API Monitoring 檢視畫面:
- 時間軸 (如上圖所示)
- 調查
- 近期
圖表:從下拉式清單中選取要顯示的圖表。
選取圖表後,系統會按照選取順序顯示圖表,最近選取的圖表會排在最前面。
時間範圍:選取圖表的時間範圍長度。
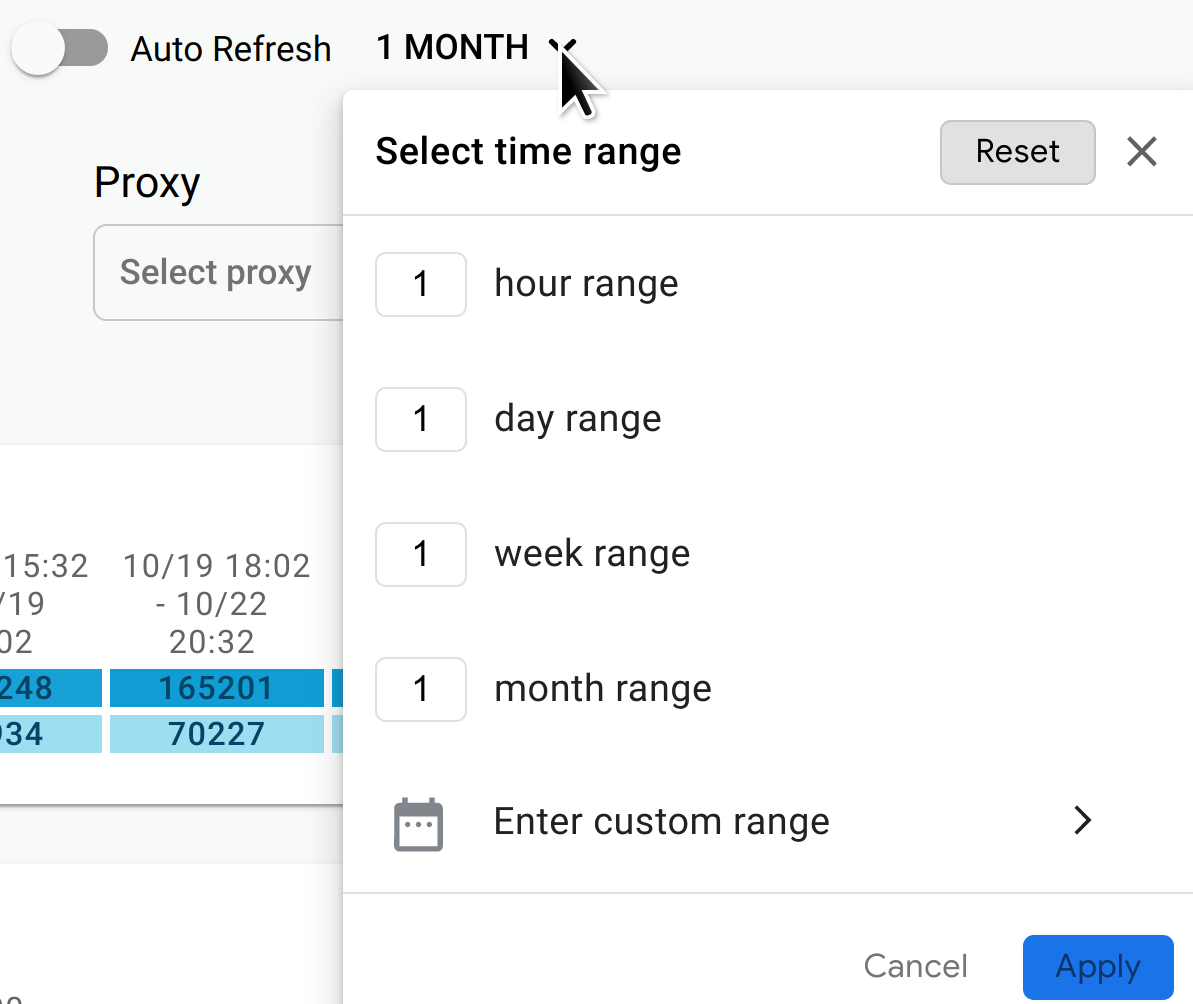
你也可以開啟「自動重新整理」,讓系統每分鐘自動重新整理資料。
環境:選取 API 的環境。
區域 (僅限時間軸和「調查」檢視畫面):選取 API 區域。
Proxy (僅限時間軸和「調查」檢視畫面):選取 API Proxy。