Com a Apigee, você cria alertas acionados por padrões específicos de tráfego da API.
Por exemplo, quando a taxa
de erro da API atinge um limite predeterminado. As operações de API ampliam esse recurso com
alertas de anomalias, que são acionados sempre que a Apigee detecta dados incomuns de
tráfego de APIs. A vantagem dos alertas de anomalias é que você não precisa definir as condições exatas
para cada anomalia. As operações de API determinam as condições de anomalias corretas usando métodos estatísticos
e as atualizam constantemente com base nos dados de tráfego recentes.
Ao usar a detecção de anomalias, você permite que a Apigee detecte problemas de tráfego e desempenho em vez de
pré-determinar as condições de alerta por conta própria.
Quando as operações de API detectam uma anomalia, elas exibem o evento no painel
Eventos de anomalias. No entanto, não gera um alerta automaticamente para
a anomalia. Se você examinar uma anomalia no painel e decidir ser alertado sobre
um evento semelhante no futuro, poderá criar um alerta de anomalia
e configurar uma notificação, que envia uma mensagem sempre que a anomalia é detectada.
Antes de criar um alerta de anomalia, verifique se você recebeu os
papéis necessários
para as operações da API.
Para criar um alerta de anomalia no painel de políticas de alertas, faça o seguinte:
Observação: abra o painel Criar política de alertas em uma nova guia se quiser seguir
as etapas abaixo.
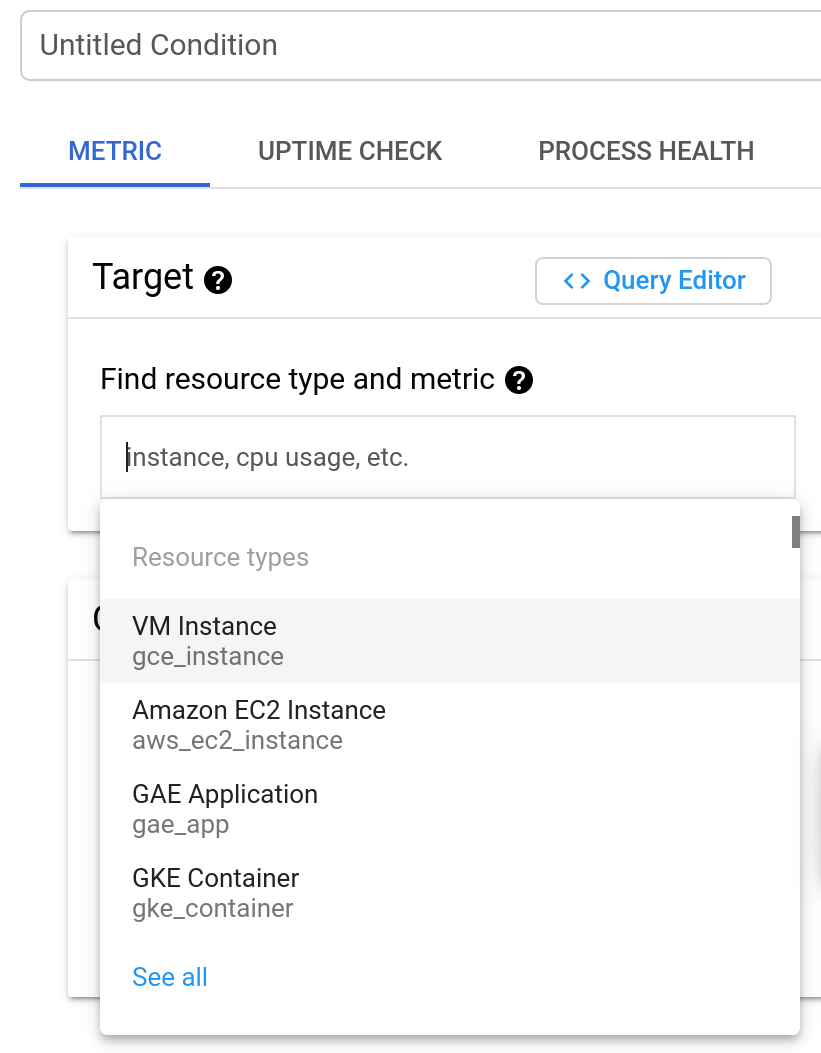
Clique em ADICIONAR CONDIÇÃO. Isso abre uma nova janela onde é possível adicionar a condição do alerta.
Opcional: adicione um título para a
condição no campo Condição sem título. Deixaremos em branco para
este exemplo. Nesse caso, a condição recebe o título padrão.
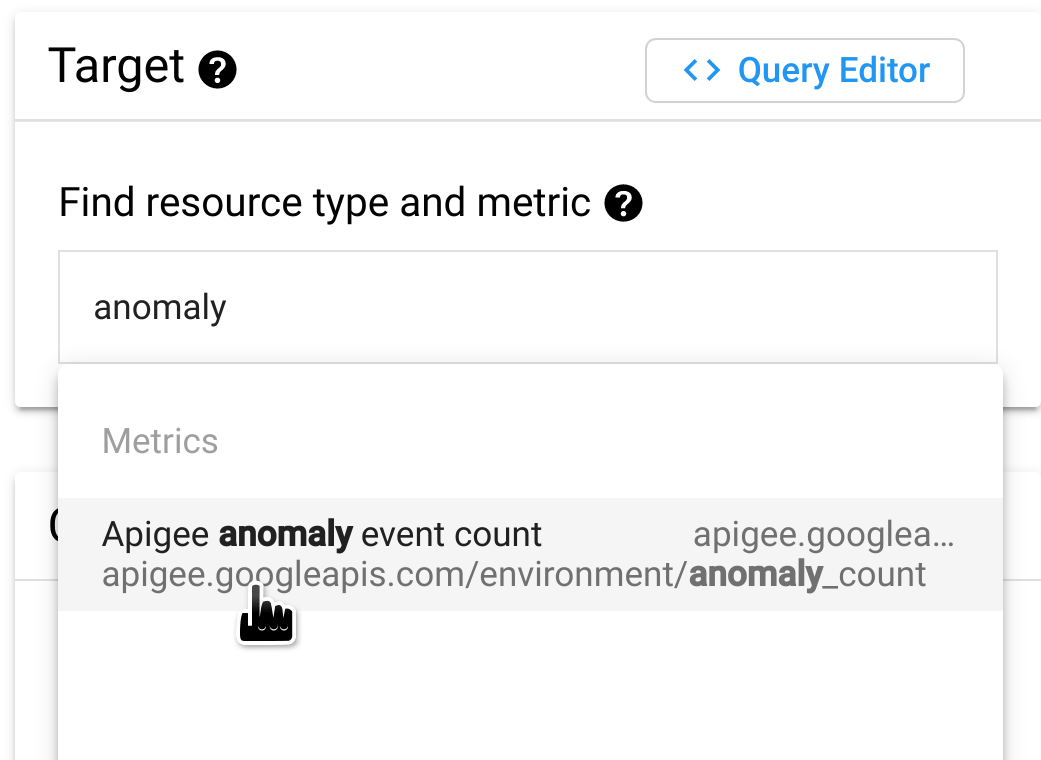
No campo Localizar tipo de recurso e métrica, digite
anomaly
e selecione Contagem de eventos de anomalias da Apigee.
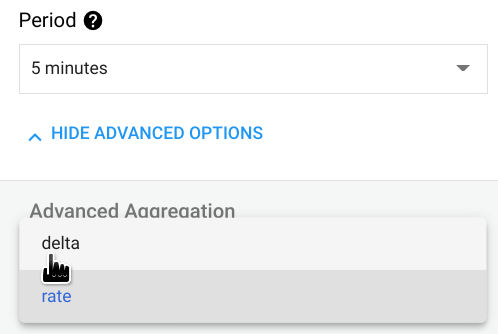
Clique em EXIBIR CONFIGURAÇÕES AVANÇADAS e no painel Agregação avançada,
selecione delta no campo Alinhador field. Especifica como os dados são
agregados em cada período, que você pode definir no campo Período.
Com a configuração delta, o valor agregado é igual ao
valor dos dados finais no período menos o valor dos dados iniciais.
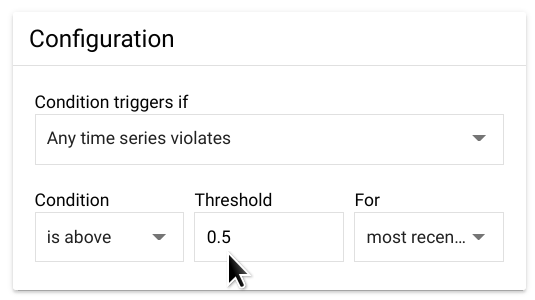
No painel Configuração, defina o Limite como 0,5.
(Qualquer número entre 0 e 1 funcionará para o limite.)
Com esse valor, uma única anomalia excede o limite e aciona o alerta.
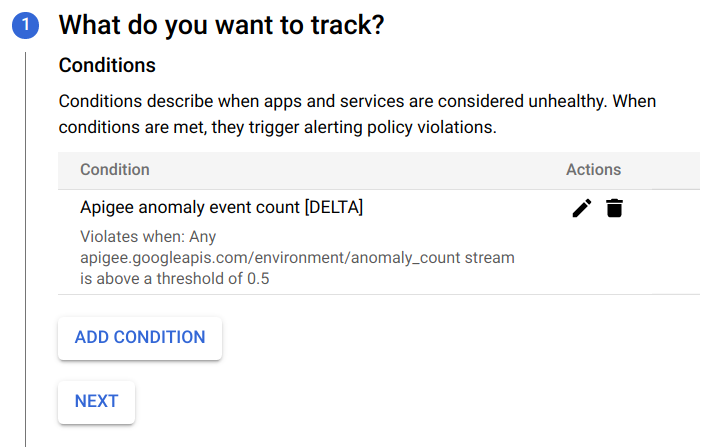
Clique em Adicionar. Isso levará você de volta à página Criar política de alertas,
onde poderá ver a condição que acabou de criar.
Nesse ponto, você pode optar por:
Clique em Adicionar condição para criar outra condição para o alerta.
Clique em PRÓXIMO para ir para a próxima etapa, em que você terá a opção de
criar uma notificação para o
alerta, conforme descrito na próxima seção.
Se você não quiser criar uma notificação, clique em PRÓXIMO duas vezes
sem digitar nada para ignorar as etapas 2 e 3.
Clique em SALVAR para salvar o alerta.
Como criar uma notificação para um alerta
Caso queira receber uma notificação imediatamente quando ocorrer um incidente, crie
uma notificação para o alerta. Quando o alerta é acionado, a Apigee envia uma notificação. É possível escolher qualquer um dos seguintes canais para receber
a notificação:
E-mail
PagerDuty
Slack
Webhooks
Para criar uma notificação para o alerta:
Se você acabou de criar o alerta (como mostrado no
exemplo anterior) e está visualizando o painel
Criar política de alertas, pule para a próxima etapa.
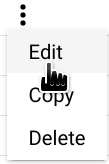
Caso contrário, abra o painel
Políticas no painel de alertas do Console do Cloud e, na
linha do alerta criado, clique no ícone de três pontos no final
da linha e selecione Editar.
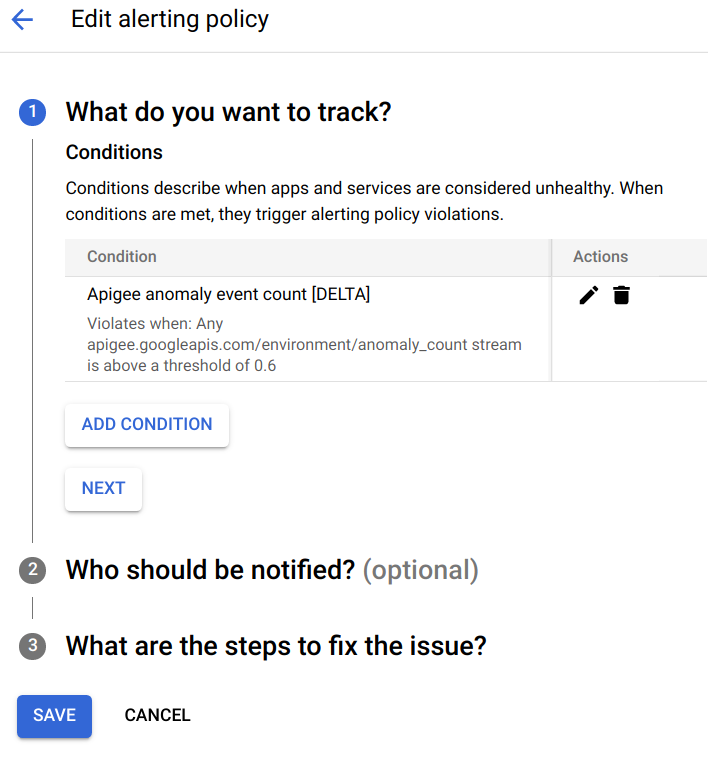
Isso abre o painel Editar política de alertas:
Na seção O que você quer rastrear? clique em PRÓXIMO.
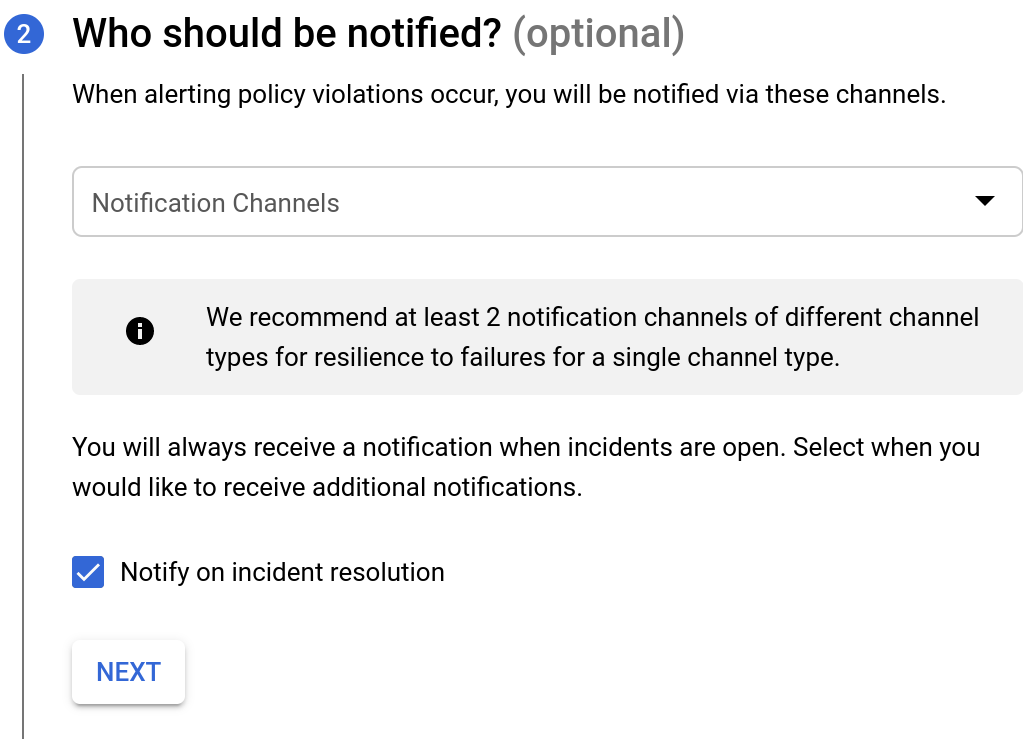
Na seção Quem será notificado, selecione
Canais de notificação, onde você pode escolher dentre as opções de canais para receber
notificações.
Se você quiser criar um novo canal de notificação, selecione GERENCIAR CANAIS DE NOTIFICAÇÃO. Essa
opção abre o painel "Canais de notificação" no Console do Cloud, onde é possível
adicionar canais. Consulte
Criar e gerenciar canais de notificação para mais detalhes.
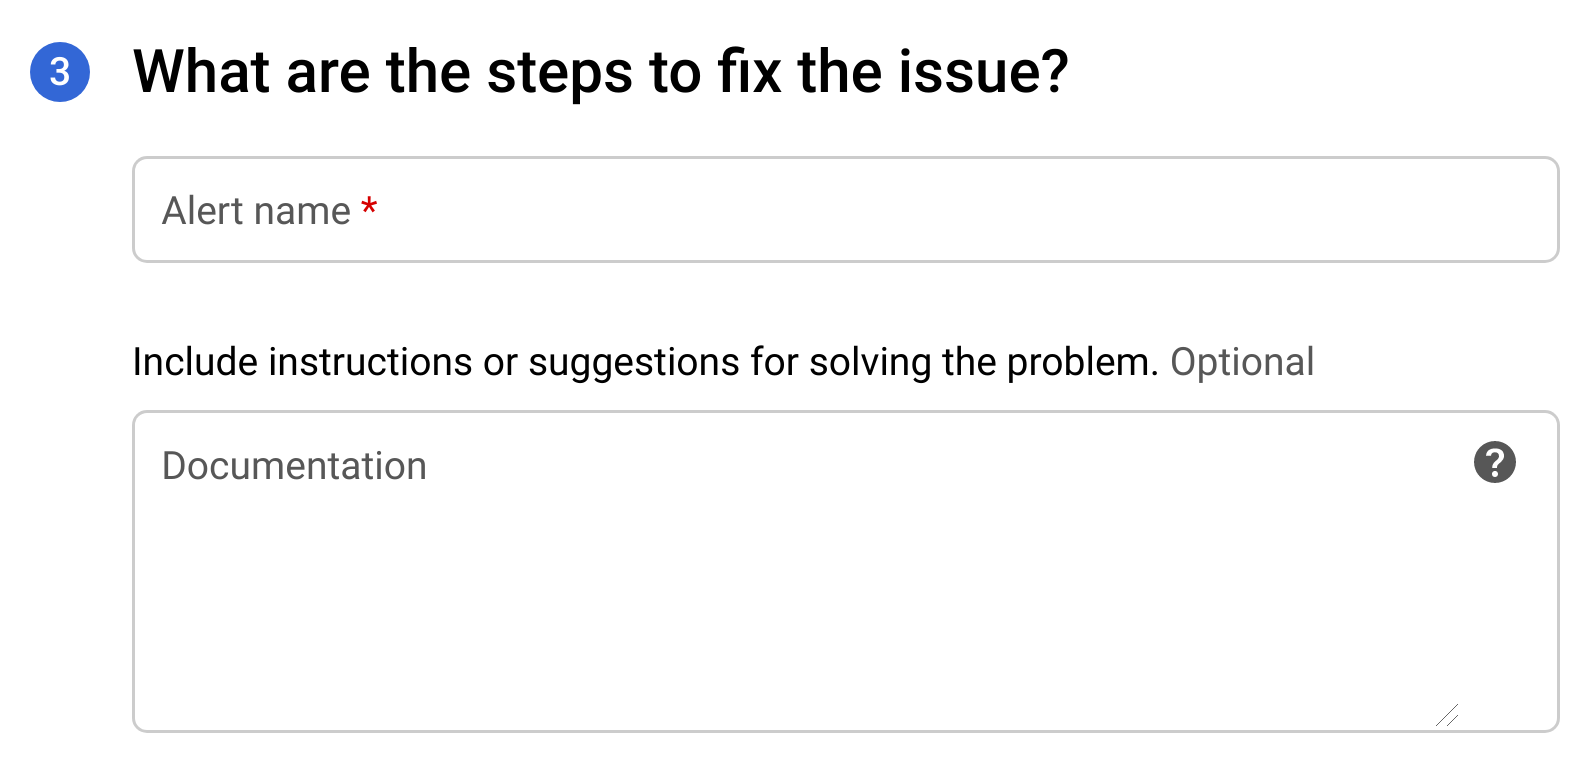
Clique em PRÓXIMA. Isso exibe as opções mostradas abaixo.
No campo Nome do alerta, digite um nome para o alerta.
No campo Documentação, insira o URL de uma página da Web que
forneça informações sobre como corrigir o problema que causou o alerta. O URL será incluído na notificação.
Clique em Salvar para criar o alerta.
Quando um alerta for acionado, você receberá uma notificação com um resumo do incidente e quando ele ocorreu. A notificação também contém dois links para ajudar você a investigar o incidente:
VER INCIDENTE: visualize o incidente no Console do Cloud.
[[["Fácil de entender","easyToUnderstand","thumb-up"],["Meu problema foi resolvido","solvedMyProblem","thumb-up"],["Outro","otherUp","thumb-up"]],[["Difícil de entender","hardToUnderstand","thumb-down"],["Informações incorretas ou exemplo de código","incorrectInformationOrSampleCode","thumb-down"],["Não contém as informações/amostras de que eu preciso","missingTheInformationSamplesINeed","thumb-down"],["Problema na tradução","translationIssue","thumb-down"],["Outro","otherDown","thumb-down"]],["Última atualização 2025-08-28 UTC."],[[["\u003cp\u003eApigee offers anomaly alerts that automatically detect unusual API traffic patterns without requiring users to manually define specific anomaly conditions.\u003c/p\u003e\n"],["\u003cp\u003eAnomaly detection events are displayed on the Anomaly Events dashboard, and users can choose to set up anomaly alerts with notifications for similar future events.\u003c/p\u003e\n"],["\u003cp\u003eTo create an anomaly alert, users must navigate to the "Create alerting policy" dashboard in the Google Cloud console and select "Apigee anomaly event count" as the metric.\u003c/p\u003e\n"],["\u003cp\u003eUsers can configure notifications for anomaly alerts to be sent via email, PagerDuty, Slack, or webhooks when an anomaly is detected.\u003c/p\u003e\n"],["\u003cp\u003eWhen an anomaly alert is triggered, notifications include links to view the incident in the Cloud console and an API traffic timeline graph in the API Monitoring Investigate dashboard.\u003c/p\u003e\n"]]],[],null,["# Creating anomaly alerts\n\n*This page\napplies to **Apigee** and **Apigee hybrid**.*\n\n\n*View [Apigee Edge](https://docs.apigee.com/api-platform/get-started/what-apigee-edge) documentation.*\n\nApigee enables you to create alerts that are triggered by specific API traffic patterns---\nfor example, when an API's\nerror rate reaches a predetermined threshold. AAPI Ops extends this capability with\n*anomaly alerts*, which are triggered whenever Apigee detects unusual API traffic\ndata. The advantage of anomaly alerts is that you don't have to define the exact conditions\nfor each anomaly yourself. AAPI Ops determines the right anomaly conditions using statistical methods,\nand constantly updates them based on recent traffic data.\nUsing anomaly detection, you let Apigee detect traffic and performance issues, rather than\npredetermining the alert conditions yourself.\n| **Important:** \"Anomaly Detection\" describes the Advanced API Operations Anomaly Detection functionality, which is available in the Classic Apigee UI. This functionality is comparable to the \"Operations Anomalies\" functionality in [Apigee UI in Cloud console](https://console.cloud.google.com/apigee). Both are available at this time. See [Operations Anomalies overview](/apigee/docs/api-platform/analytics/operations-anomalies-overview) for information on the Operations Anomalies functionality.\n\nWhen AAPI-Ops detects an anomaly, it displays the event in the Anomaly Events\ndashboard. However, it doesn't automatically raise an alert for\nthe anomaly. If you examine an anomaly in the dashboard and decide you want to be alerted about\nsimilar event in future, you can create an anomaly alert\nand set up a notification, which sends you a message whenever the anomaly is detected.\n\nBefore creating an anomaly alert, make sure you have been assigned the\n[required roles](/apigee/docs/aapi-ops#required-roles-for-aapi-ops)\nfor AAPI Ops.\n\nTo create an anomaly alert in the Alerting policy dashboard, do the following:\n\n1. Open the\n [Create alerting policy](https://console.cloud.google.com/monitoring/alerting/policies/create?) dashboard in the Google Cloud console.\n\n **Note:** Open the Create alerting policy dashboard in a new tab if you want to follow\n the steps below.\n2. Click **ADD CONDITION** . This opens a new window where you can add the alert condition.\n\n\n3. Optional: Add a title for the condition in the **Untitled Condition** field. We'll leave it blank for this example, in which case the condition is given a default title.\n4. In the **Find resource type and metric** field, type\n\n ```\n anomaly\n ```\n\n and then select **Apigee anomaly event count**.\n5. Click **SHOW ADVANCED SETTINGS** and in the **Advanced Aggregation** pane,\n select **delta** in the **Aligner** field. This specifies how the data is\n aggregated over each time period, which you can set in the **Period** field.\n With the **delta** setting, the aggregated value equals the\n final data value in the time period minus the initial data value.\n\n6. In the **Configuration** pane, set the **Threshold** to **0.5**.\n (Any number between 0 and 1 will work for the threshold.)\n With this value, a single anomaly exceeds the threshold and triggers the alert.\n\n7. Click **Add** . This takes you back to the **Create alerting policy** page\n where you can see the condition you just created.\n\nAt this point you can choose to either:\n\n- Click **ADD Condition** to create another condition for the alert, or\n- Click **NEXT** to go to the next step, where you will have the option to [create a notification for the\n alert](#creating-a-notification-for-an-alert), as described in the next section.\n\nIf you don't want to create a notification, click **NEXT** twice\nwithout entering anything to bypass Steps 2 and 3.\n\nClick **SAVE** to save the alert.\n\nCreating a notification for an alert\n------------------------------------\n\nIf you want to be notified immediately when an incident occurs, you can create\na notification for the alert. When the alert is triggered, Apigee sends you\na notification. You can choose any of the following channels to receive\nthe notification:\n\n- Email\n- PagerDuty\n- Slack\n- Webhooks\n\n| **Note:** Currently, to receive a notification, you must add **org** to the **Group by** field in the alert. This requirement will be removed in a future release.\n\nTo create a notification for an alert:\n\n1. If you just created the alert (as shown in the\n preceding example) and are currently viewing the\n **Create alerting policy** dashboard, skip to the next step.\n\n Otherwise, open the\n [**Policies** pane](https://console.cloud.google.com/monitoring/alerting/policies) in the Cloud console Alerting dashboard, and in\n the row for the alert you created, click the three dots icon at the end\n of the row and select **Edit**.\n\n This opens the **Edit alerting policy** dashboard:\n2. In the **What do you want to track?** section, click **NEXT**.\n\n3. In the **Who should be notified** section, select\n **Notification Channels**, where you can choose from existing channels for receiving\n notifications.\n\n If you want to create a new\n notification channel, select **MANAGE NOTIFICATION CHANNELS** . This\n opens the Notification channels dashboard in the Cloud console, where you can\n add channels. See\n [Create and manage notification channels](https://cloud.google.com/monitoring/support/notification-options) for more details.\n4. Click **NEXT**. This displays the options shown below.\n\n5. In the **Alert name** field, enter a name for the alert.\n6. In the **Documentation** field, enter the URL for a web page that provides information on how to fix the issue that caused the alert. The URL will be included in the notification.\n7. Click **Save** to create the alert.\n\nWhen an alert is triggered, you will receive a notification\nproviding a summary of the incident and when it occurred. The notification\nalso contains two links to help you investigate the incident:\n\n- **VIEW INCIDENT**: View the incident in the Cloud console.\n- **VIEW IN APIGEE** : View a timeline graph of API traffic and related data tables in the [API Monitoring Investigate dashboard](/apigee/docs/api-monitoring/investigate)."]]