本頁內容適用於 Apigee 和 Apigee Hybrid。
查看
Apigee Edge 說明文件。

Apigee UI 中的「異常事件」資訊主頁是偵測到的 API 異常狀況主要資訊來源。資訊主頁會顯示最近的異常狀況清單。
開啟資訊主頁前,請確認您已獲派 AAPI Ops 的必要角色。
如要開啟異常狀況資訊主頁,請按照下列步驟操作:
Cloud 控制台中的 Apigee
-
前往 Google Cloud 控制台的「Operations anomalies」(作業異常) 頁面。
- 切換至要監控的機構。
根據預設,資訊主頁會顯示前一小時發生的異常狀況。 如果該時間範圍內未偵測到任何異常狀況,資訊主頁就不會顯示任何資料列。如要查看更多資料,請在資訊主頁右上角的時間範圍選單中選取較長的時間範圍。
表格中的每一列都對應一項偵測到的異常狀況,並顯示下列資訊:
- 異常狀況的日期和時間。
- 異常狀況的簡短摘要,包括發生異常的 Proxy 和觸發異常的錯誤代碼。
- 發生異常狀況的環境。
- 發生異常的區域。
- 異常事件的嚴重程度:輕微、中等或嚴重。嚴重程度是根據統計測量值 (P 值) 判斷,也就是事件偶然發生的機率 (事件越不可能發生,嚴重程度就越高)。
您可以進一步調查異常狀況,判斷是否應採取任何因應措施。建議您先從 API 監控資訊主頁開始調查,當中會顯示各種近期 API 流量資料的圖表。下一節「 調查異常情況」將說明如何執行這項操作。
傳統版 UI
登入 Apigee 使用者介面。
注意:如要按照下列步驟操作,請在新分頁中開啟 Apigee 使用者介面。
- 切換至要監控的機構。
- 在導覽窗格中,依序選取「Analyze」>「Anomaly Events」。
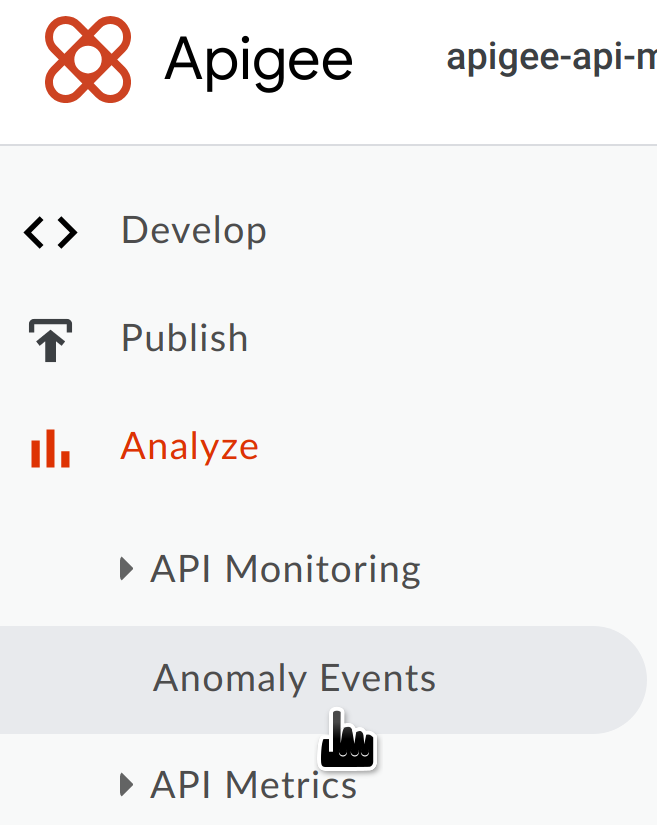
隨即顯示「異常事件」資訊主頁。
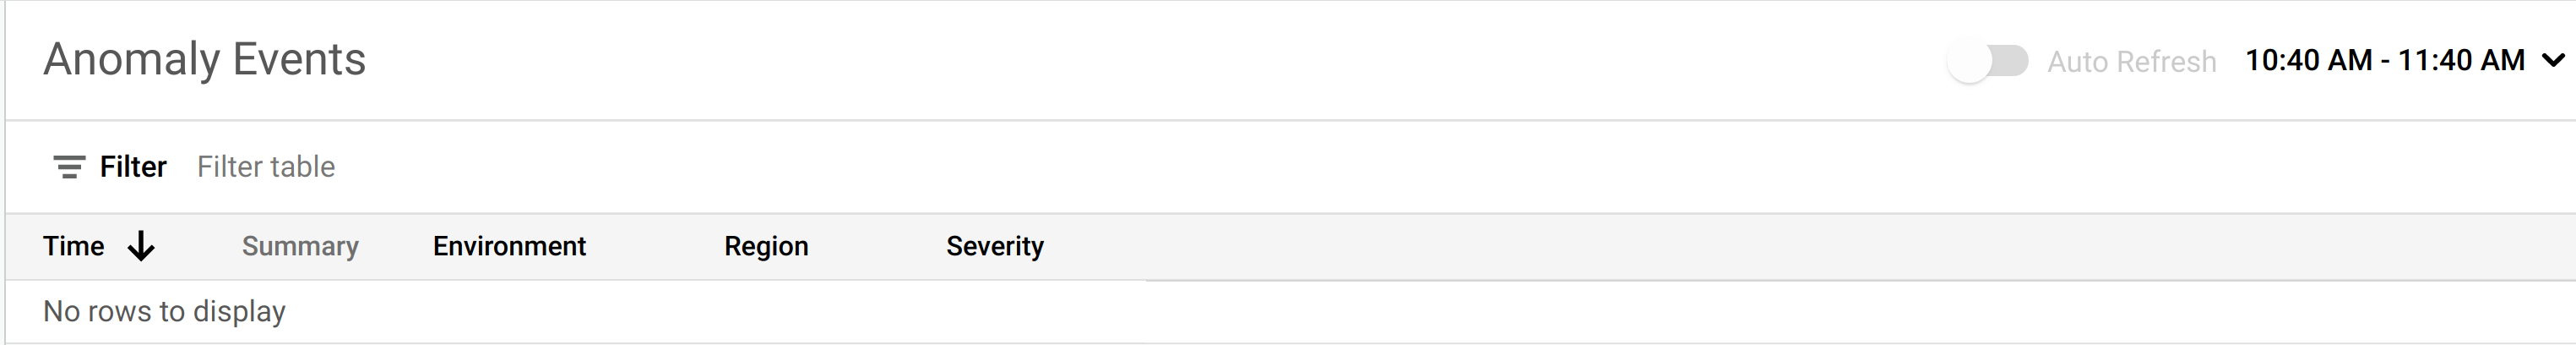
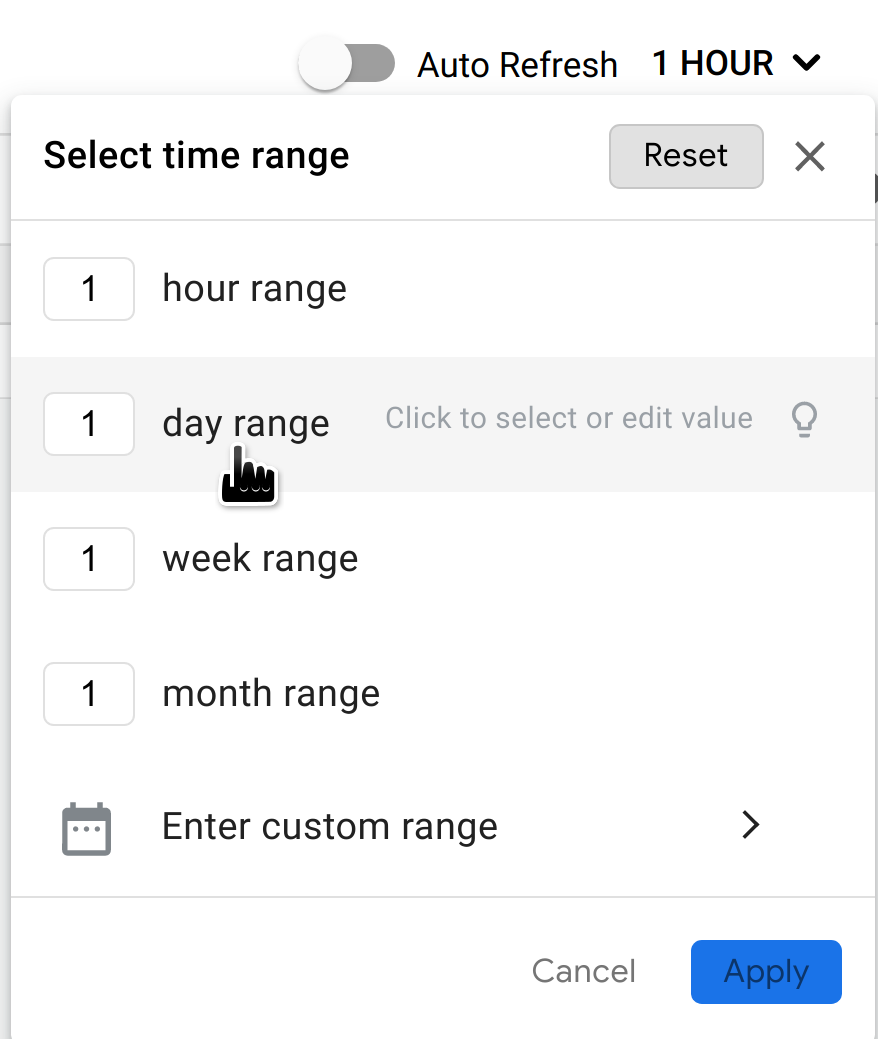
根據預設,資訊主頁會顯示前一小時發生的異常狀況。 如果該時間範圍內未偵測到任何異常狀況,資訊主頁就不會顯示任何資料列。如要查看更多資料,請在資訊主頁右上角的時間範圍選單中選取較長的時間範圍。
如果這個時間範圍內有異常狀況,顯示方式會與下方所示類似。

表格中的每一列都對應一項偵測到的異常狀況,並顯示下列資訊:
- 異常狀況的日期和時間。
- 異常狀況的簡短摘要,包括發生異常的 Proxy 和觸發異常的錯誤代碼。
- 發生異常狀況的環境。
- 發生異常的區域。
- 異常事件的嚴重程度:輕微、中等或嚴重。嚴重程度是根據統計測量值 (P 值) 判斷,也就是事件偶然發生的機率 (事件越不可能發生,嚴重程度就越高)。
您可以進一步調查異常狀況,判斷是否應採取任何因應措施。建議您先從 API 監控資訊主頁開始調查,當中會顯示各種近期 API 流量資料的圖表。下一節「 調查異常情況」將說明如何執行這項操作。